Abstracts
A critical issue in digital soil mapping (DSM) is the selection of data sampling method for model training. One emerging approach applies instance selection to reduce the size of the dataset by drawing only relevant samples in order to obtain a representative subset that is still large enough to preserve relevant information, but small enough to be easily handled by learning algorithms. Although there are suggestions to distribute data sampling as a function of the soil map unit (MU) boundaries location, there are still contradictions among research recommendations for locating samples either closer or more distant from soil MU boundaries. A study was conducted to evaluate instance selection methods based on spatially-explicit data collection using location in relation to soil MU boundaries as the main criterion. Decision tree analysis was performed for modeling digital soil class mapping using two different sampling schemes: a) selecting sampling points located outside buffers near soil MU boundaries, and b) selecting sampling points located within buffers near soil MU boundaries. Data was prepared for generating classification trees to include only data points located within or outside buffers with widths of 60, 120, 240, 360, 480, and 600m near MU boundaries. Instance selection methods using both spatial selection of methods was effective for reduced size of the dataset used for calibrating classification tree models, but failed to provide advantages to digital soil mapping because of potential reduction in the accuracy of classification tree models.
soil survey; data sampling; model training
Uma questão crítica no mapeamento digital de solos é a seleção do método de amostragem dos dados para treinamento do modelo preditivo. Uma abordagem emergente aplica a seleção de instâncias (observações) para reduzir o tamanho do conjunto de dados, selecionando amostras relevantes para obter um subconjunto representativo, o qual seja grande o suficiente para preservar as informações pertinentes, mas pequeno o suficiente para ser facilmente manipulado pelos algoritmos de aprendizagem. Embora existam sugestões para distribuir a amostragem de dados em função da proximidade de limites de unidades de mapeamento de solos (UM), ainda existem contradições entre as recomendações de pesquisa para localizar amostras mais perto ou mais distantes desses limites. Foi realizado um estudo para avaliar os métodos de seleção de instâncias com base na coleta de dados espacialmente explícita usando a localização em relação aos limites de mapa de solo como o principal critério. Realizou-se análise de árvore de decisão para a modelagem de mapeamento digital de classes de solo usando dois esquemas de amostragem diferentes: a) selecionando pontos de amostragem localizados fora das áreas marginais aos limites das UM e b) selecionando pontos de amostragem situados dentro das áreas marginais aos limites das UM. Os dados foram preparados para a geração de árvores de classificação para incluir somente dados pontuais localizados dentro ou fora de faixas com larguras de 60, 120, 240, 360, 480 e 600m ao redor dos limites de UM. Ambos os métodos de seleção de instâncias foram eficazes para reduzir o tamanho do conjunto de dados usado para calibração de árvores de classificação, mas não trouxeram vantagens para o mapeamento digital de classes de solos.
levantamento de solos; amostragem de dados; treinamento de modelos
INTRODUCTION:
Several studies have evaluated the potential application of digital soil mapping (DSM) to produce soil maps that are at least as accurate as traditional soil maps obtained by field surveys. Most of these studies tested methodological procedures using environmental variables and soil legacy data, either to reproduce traditional soil survey maps or to extrapolate regional soil information to areas where soil surveys are not available. In this context, data sampling methods to train model is a crucial aspect of DSM that still requires further consideration.
Digital soil mapping establishes statistical or mathematical relationships among environmental covariates and soil classes for prediction of the spatial distribution of soil classes or soil properties. Recently, the use of decision or classification trees has proved to be an efficient method for DSM, as demonstrated by studies of ZHOU et al. (2004ZHOU, B.; et al. Automated soil resources mapping based on decision tree and Bayesian predictive modeling. Journal of Zhejiang University Science, v.5, p.782-795, 2004.), SCHMIDT et al. (2008SCHMIDT, K. et al. Instance selection and classification tree analysis for large spatial datasets in digital soil mapping. Geoderma, v.146, p.138-146, 2008. ), HANSEN et al. (2009HANSEN, M.K. et al. Inductively mapping expert-derived soil-landscape units within dambo wetland catenae using multispectral and topographic data. Geoderma, v.150, p.72-84, 2009. Disponível em: <http://www.sciencedirect.com/science/journal/00167061>. Acesso em: 06 maio 2014.
http://www.sciencedirect.com/science/jou...
), and GIASSON et al. (2011GIASSON, E. et al. Decision trees for digital soil mapping on subtropical basaltic steeplands. Scientia Agricola, v.68, p.167-174, 2011. Disponível em: <http://dx.doi.org/10.1590/S0103-90162011000200006>. Acesso em: 06 maio 2014.
http://dx.doi.org/10.1590/S0103-90162011...
). Classification tree analysis is a supervised non-parametric statistical classification approach based on binary recursive partitioning techniques (BREIMAN et al., 1984BUI, E.N. et al. Extracting soil-landscape rules from previous soil surveys. Australian Journal of Soil Research, v.37, p.495-508, 1999.). As in any other prediction method, classification trees have their predictive accuracy greatly affected by inconsistencies within the training dataset (LAGACHERIE & HOLMES, 1997)LAGACHERIE, P.; HOLMES, S. Addressing geographical data errors in a classification tree for soil unit prediction. International Journal of Geographical Information Science, v.11, p.183-198, 1997. Disponível em: <http://www.tandfonline.com/doi/abs/10.1080/136588197242455?journalCode=tgis20#.U2jZVfldWyU>. Acesso em: 06 maio 2014.
http://www.tandfonline.com/doi/abs/10.10...
. LIU & MOTODA (1998LIU, H.; MOTODA, H. Feature selection for knowledge discovery and data mining. Boston: Kluwer Academic Publishers, 1998. 214p.) contended that handling large datasets in a classification tree approach could be inefficient in terms of learning time and prediction accuracy, and proposed instance selection, a branch of statistical learning research, to handle datasets containing redundant and/or noisy instances as well as multi-collinearity. Instance selection is applied to reduce noise and redundant information in the whole dataset. The challenge is to extract a representative subset that is small enough that can be handled easily by learning algorithms but still large enough that no relevant information is lost in the process. The main goal of instance selection is to reasonably reduce large datasets for faster predictions while preserving or even increasing accuracy (BUI et al., 1999BUI, E.N. et al. Extracting soil-landscape rules from previous soil surveys. Australian Journal of Soil Research, v.37, p.495-508, 1999.; LIU & MOTODA, 1998LIU, H.; MOTODA, H. Feature selection for knowledge discovery and data mining. Boston: Kluwer Academic Publishers, 1998. 214p.). Advancing this research topic, SCHMIDT et al. (2008SCHMIDT, K. et al. Instance selection and classification tree analysis for large spatial datasets in digital soil mapping. Geoderma, v.146, p.138-146, 2008. ) suggested that spatially constrained instance selection should be investigated in future pedometric research "focusing on the boundaries instead of concentrating on the more homogeneous core of the class areas". The authors suggested utilization of spatially constrained data sampling methods that would account for soil boundary location and focus data sampling within buffers defined by these boundaries. Although these boundaries or limits are represented in soil maps as lines representing the most probable localization of the change in soil type, they actually represent a zone of uncertainty where a class of soil is changing to become more similar to soils from another class.
Following SCHMIDT´s et al. (2008SCHMIDT, K. et al. Instance selection and classification tree analysis for large spatial datasets in digital soil mapping. Geoderma, v.146, p.138-146, 2008. ) suggestion to account for soil boundaries location, TEN CATEN et al. (2012TEN CATEN, A. Mapeamento digital de solos: estratégia de pré-processamento de dados. Revista Brasileira Ciência do Solo, v.36, n.4,1083-1092, 2012. Disponível em: ISSN 0100-0683.<http://dx.doi.org/10.1590/S0100-06832012000400003>. Acesso em: 06 maio 2014.
http://dx.doi.org/10.1590/S0100-06832012...
) stated that the exact location of boundaries among soil classes could only be established with difficulty because areas close to class boundaries present larger soil variability and, consequently, a weak correlation between environmental parameters and soil class occurrence in those areas. These authors considered that the extension of these areas along both sides of map unit boundaries (now on denominated buffer areas) would most likely vary with map scale and complexity of soil distribution, so that buffer width values determined for a specific environmental situation may not be adequately applied to others. Based on the hypotheses that the use of data from inside these buffer areas would produce poorer prediction models, TEN CATEN et al. (2012TEN CATEN, A. Mapeamento digital de solos: estratégia de pré-processamento de dados. Revista Brasileira Ciência do Solo, v.36, n.4,1083-1092, 2012. Disponível em: ISSN 0100-0683.<http://dx.doi.org/10.1590/S0100-06832012000400003>. Acesso em: 06 maio 2014.
http://dx.doi.org/10.1590/S0100-06832012...
) tested the exclusion of data contained within buffer areas near soil map unit (MU) boundaries. A comparison of the accuracy of classification trees calibrated without data exclusion with classification trees obtained with exclusion of data using two buffer widths (100 and 160m from soil map units boundaries) concluded that classification trees produced excluding data within buffers of 160m were more accurate for predicting spatial distribution of soil classes (TEN CATEN et al., 2012TEN CATEN, A. Mapeamento digital de solos: estratégia de pré-processamento de dados. Revista Brasileira Ciência do Solo, v.36, n.4,1083-1092, 2012. Disponível em: ISSN 0100-0683.<http://dx.doi.org/10.1590/S0100-06832012000400003>. Acesso em: 06 maio 2014.
http://dx.doi.org/10.1590/S0100-06832012...
).
Both studies (SCHMIDT et al., 2008SCHMIDT, K. et al. Instance selection and classification tree analysis for large spatial datasets in digital soil mapping. Geoderma, v.146, p.138-146, 2008. ; TEN CATEN et al., 2012TEN CATEN, A. Mapeamento digital de solos: estratégia de pré-processamento de dados. Revista Brasileira Ciência do Solo, v.36, n.4,1083-1092, 2012. Disponível em: ISSN 0100-0683.<http://dx.doi.org/10.1590/S0100-06832012000400003>. Acesso em: 06 maio 2014.
http://dx.doi.org/10.1590/S0100-06832012...
) referred to the variability of areas located closer to soil class boundaries and recommended two different approaches to design data sampling schemes for pedometric research. SCHMIDT et al. (2008SCHMIDT, K. et al. Instance selection and classification tree analysis for large spatial datasets in digital soil mapping. Geoderma, v.146, p.138-146, 2008. ) did not propose any data sampling scheme, whereas TEN CATEN et al. (2012TEN CATEN, A. Mapeamento digital de solos: estratégia de pré-processamento de dados. Revista Brasileira Ciência do Solo, v.36, n.4,1083-1092, 2012. Disponível em: ISSN 0100-0683.<http://dx.doi.org/10.1590/S0100-06832012000400003>. Acesso em: 06 maio 2014.
http://dx.doi.org/10.1590/S0100-06832012...
) proposed the exclusion of buffer areas close to soil MU boundaries. A more intensive evaluation of instance selection in the context of DSM is timely, because these contrasting approaches of sampling methods may have critical implications on model training. The objective of this study was to test the efficiency of instance selection methods based on spatial selection of data taking into account its location in relation to soil MU boundaries.
MATERIAL AND METHODS:
This study was conducted in the Rio Santo Cristo watershed, which is representative of a large crop production area in southern Brazil. The watershed located on Northwestern Rio Grande do Sul State covers an area of 898 square kilometers. A semi detailed 1:50,000 soil survey is available (KÄMPF et al., 2004KÄMPF, N. Soil survey and land suitability for disposal of pig manure at River Santo Cristo watershed. Porto Alegre. SEMA-RS, 2004. Final Report (in Portuguese).
https://doi.org/SEMA-RS...
). Relief, varying from flat to mountainous developed on basaltic rocks, is the major factor of soil formation that determined soil class differentiation. Soil types occurring in the watershed are listed and classified on table 1, which characterizes the soil mapping units.
Taxonomy of soil map units (MU) of the semi detailed 1:50,000 soil survey of Rio Santo Cristo watershed in Northerwestern Rio Grande do Sul State, Brazil.
For evaluation of classification trees in predictive soil mapping, a digital cartographic database was prepared in geographic information system (GIS) environment using ArcGIS 9.2 (ESRI, 2006ESRI. ArcGis 9.2. Redland, California., 2006. (Software).). This cartographic database comprised a 30m horizontal resolution ASTER GDEM digital elevation model (DEM) (ABRAMS et al., 1999ABRAMS, M. et al. ASTER users´ handbook. Pasadena: JPL, 1999. 93p.), and vector layers of the soil map and stream network. The raster DEM was used to derive six predictive parameters: slope gradient, curvature (combination of planar and profile curvature), flow direction, flow accumulation, flow length, and topographic wetness index (TWI) (BEVEN & KIRKBY, 1979BREIMAN, L. et al. Classification and regression trees. Monterey: Wadsworth, 1984. 358p.
https://doi.org/Wadsworth...
; WOLOCK & MCCABE, 1995WOLOCK, D.M.; MCCABE, G.J. Comparison of single and multiple flow-direction algorithms for computing topographic parameters in TOPMODEL. Water Resources Research, v.31, p.1315-1324, 1995.). Additional calculated variables were local distance to streams and local distance to soil map unit boundaries. These hydrologic and landform parameters were used because they represent changes on soil-forming factors and, therefore, are considered informative on the occurrence of soil map units.
The selected dataset for model training consisted of 9,000 points (corresponding approximately to one observation per 0.1km2), distributed randomly across soil map units. The criterion for selecting this number of sampling points was to have one point for each minimum mapping area of the map. Additionally, randomization of sampling points was applied to eliminate subjectivity and allow simple reproducibility ensuring a proportional distribution of samples on each soil MU area.
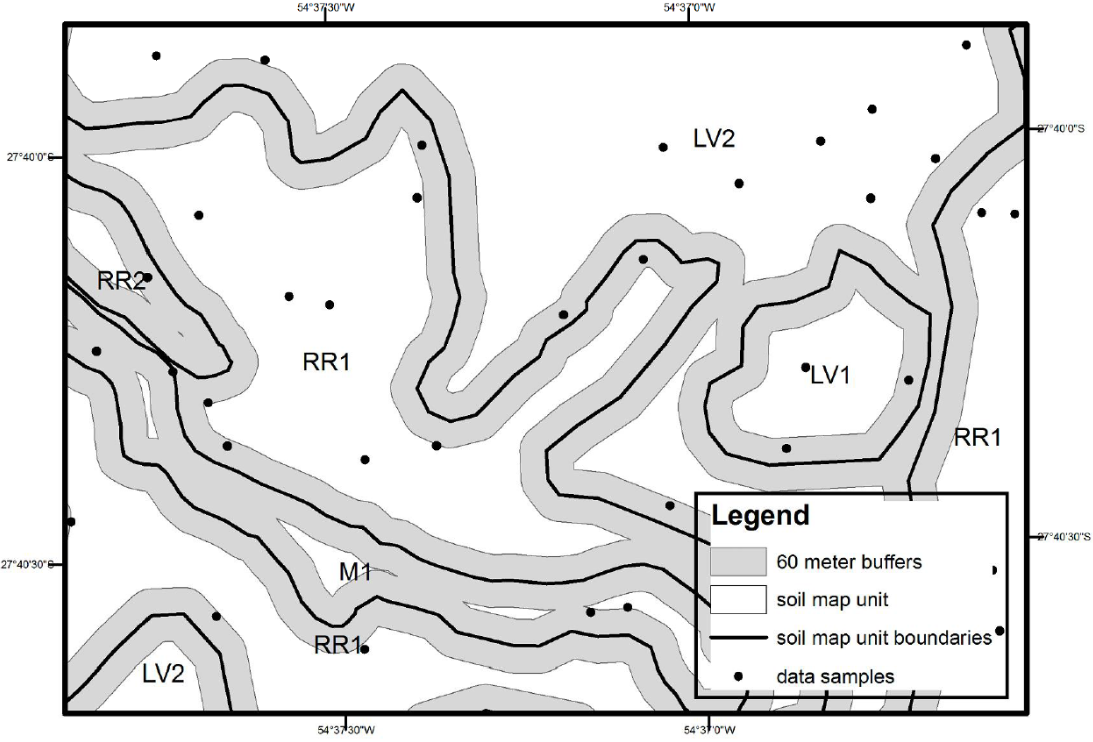
Classification trees were generated using data sampled based on two instance selection methods: a) Selection of sampling points located outside buffers near soil map boundaries, based on the assumption that these datasets would have more predictive power because they excluded uncertainty close to soil MU boundaries, i.e., excluding data points located in within buffers with widths of 60, 120, 240, 360, 480, and 600m near soil MU boundaries (Figure 1); b) Selection of sampling points located within buffers near soil MU boundaries, based on the assumption that these datasets would produce better predictive models and reduced dataset size without losses in accuracy. These dataset included greater variability of predictor variables, i.e., including only data points located within buffers with widths of 60, 120, 240, 360, 480, and 600m near soil MU boundaries.

Representation of soil map unit boundaries separating the different soil map units and a 60 meter wide buffer near soil map unit boundaries.
For the two approaches above, data was extracted from GIS layers with the "sample" function in ArcGIS at each random point position. This operation populated the attribute table of the random point dataset with values of elevation, DEM derived parameters, soil map units, and distance to soil map boundaries. These datasets were exported into comma-delimited files (CSV format) for further processing with classification tree analysis in software Weka 3.5.8 (WITTEN & FRANK, 2005WITTEN, A.H.; FRANK, E. Data mining: practical machine learning tools and techniques. 2.ed. San Francisco: Morgan Kaufmann Publishers, 2005. 664p.).
Variable selection in the classification tree analysis was conducted with correlation-based feature subset selection (HALL, 1999HALL, M.A. Correlation-based feature subset selection for machine learning. 1999. 178f. Tese - Department of Computer Science, University of Waikato.), which evaluates the worth of a subset of attributes based on the individual predictive ability of each feature with the degree of redundancy across features. In this application, classification tree analysis generated trees for each buffer width using nine values for the minimum number of elements in terminal leaves (M) of the trees intending to generate classification trees with several levels of complexities (number of nodes). M then was set to 150, 125, 100, 75, 50, 25, 10, 5 and 2 elements, which originated the smallest to the largest classification tree. The classification tree algorithm used was J48, which is an open source Java implementation of the C4.5 algorithm (QUINLAN, 1993QUINLAN, J.R. C4.5: programs for machine learning. San Francisco: Morgan Kaufmann Publishers, 1993. 302p.) in Weka (WITTEN & FRANK, 2005WITTEN, A.H.; FRANK, E. Data mining: practical machine learning tools and techniques. 2.ed. San Francisco: Morgan Kaufmann Publishers, 2005. 664p.). The C4.5 builds classification trees from a set of training data. At each tree node, C4.5 chooses one attribute of the data that most effectively splits its set of samples into subsets enhanced by either class. The criterion is the normalized information gain (difference in entropy) obtained from choice of a data-split attribute. The attribute with the highest normalized information gain is chosen to make the decision (QUINLAN, 1993QUINLAN, J.R. C4.5: programs for machine learning. San Francisco: Morgan Kaufmann Publishers, 1993. 302p.; WITTEN & FRANK, 2005WITTEN, A.H.; FRANK, E. Data mining: practical machine learning tools and techniques. 2.ed. San Francisco: Morgan Kaufmann Publishers, 2005. 664p.).
Classification tree models were evaluated for accuracy both with 10-fold cross validation method and with a supplied independent dataset used for model testing. Cross validation is a technique for assessing how the results of a statistical analysis will generalize to an independent data set. One round of cross-validation involves partitioning a sample of data into complementary subsets, performing the analysis on one subset (called the training set), and validating the analysis on the other subset (called the validation set or testing set). To reduce variability, multiple rounds of cross-validation are performed using different partitions, and the validation results are averaged over the rounds (SAMMUT & WEBB, 2011SAMMUT, C.; WEBB, G.I. Encyclopedia of machine learning. New York: Springer, 2011. 549p.; WITTEN & FRANK, 2005WITTEN, A.H.; FRANK, E. Data mining: practical machine learning tools and techniques. 2.ed. San Francisco: Morgan Kaufmann Publishers, 2005. 664p.). A second method for evaluating the accuracy of the models used a supplied dataset consisted of an independent dataset of 90,000 random points used to represent the overall variability of the predicting variables in the study area for verifying how well the model predicts soil occurrence on the entire study area (Witten and Frank, 2005WITTEN, A.H.; FRANK, E. Data mining: practical machine learning tools and techniques. 2.ed. San Francisco: Morgan Kaufmann Publishers, 2005. 664p.). The criterion to assess the performance of classification tree models was the model error or the proportion of incorrectly classified instances in both validation tests.
RESULTS AND DISCUSSION:
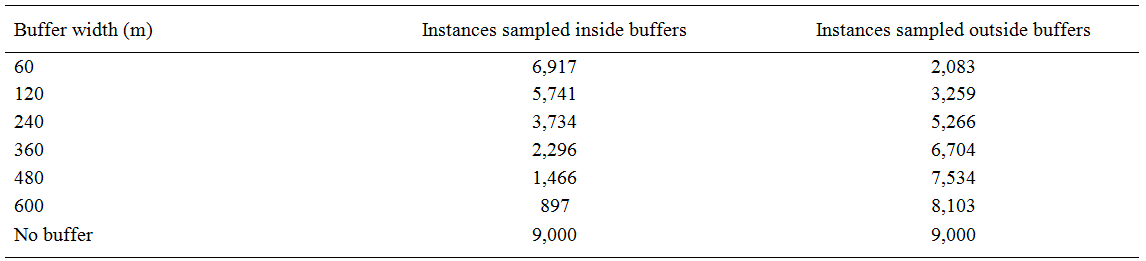
Instance selection by excluding data from buffers near MU boundaries was effective in reducing the size of the dataset used for calibration of classification trees (Table 2), reducing the number of samples to less than 10% of the initial sample size of 9,000 samples when a 600m buffer was used.
Figure 2 presents the relationship between the size of the classification trees (represented by the number of leaves) and errors measured in the validation of the classification trees (represented by the percentage of incorrectly classified instances). For both instance selection methods, the size of the classification trees increased with use of smaller values of M, i.e. reducing the number of elements on final leaves of the trees, while accuracy of classification trees changed with changes in size of the classification trees. Diverse buffer widths generated classification trees with varying accuracy, although the evaluation of the errors of the classification trees showed different behavior when errors were evaluated using 10-fold cross validation test or using the test with the supplied data set.

Variation of the number of incorrect instances predicted by classification tree models in function of variation of tree sizes for classification trees generated by different data sampling methods: a) sampling outside buffers and evaluated using cross validation, b) sampling outside buffers and evaluated using supplied data set, c) sampling inside buffers and evaluated using cross validation, and d) sampling inside buffers and evaluated using supplied data set.
When using data sampling outside buffers and evaluating model errors with 10-fold cross validation (Figure 2a), errors were almost constant for each buffer width and presented little variation with changes in the size of classification trees. Variation on buffer width changed the magnitude of errors, which were smaller when classification trees were obtained from sampling outside larger buffers. The largest errors were obtained without using a buffer, whereas smallest errors were obtained for 600-meter buffer. This could be explained by the smaller variability of predicting variables obtained with wider buffer areas excluded from data sampling. Therefore, the exclusion of data sampling of larger buffers generated classification tree models capable of best estimate occurrence of a mapping unit for that database in use. This is an indication that the classification trees generated using more homogeneous datasets provides a better fit to the dataset used for both calibration and for validation of the model (using subsets of data for cross validation).
However, a different error evaluation was obtained when evaluating the performance of classification tree models estimating occurrence of soil map units covering the entire study area, as conducted with an extensive random dataset uniformly distributed along the study area (Figure 2b). In this situation, it is observed that model error has a small increase with increase in size of classification trees and, more important, that excluding data from wider buffers increase errors, reducing the accuracy and the predictive power of classification tree models. For any size of classification tree, smaller errors were found excluding data from sampling of smaller buffer widths, with the smallest errors found when instance selection was not used. The increase in the buffer size resulted in larger errors and produced classification trees with less predictive power. These results contradict TEN CATEN´s et al. (2012)TEN CATEN, A. Mapeamento digital de solos: estratégia de pré-processamento de dados. Revista Brasileira Ciência do Solo, v.36, n.4,1083-1092, 2012. Disponível em: ISSN 0100-0683.<http://dx.doi.org/10.1590/S0100-06832012000400003>. Acesso em: 06 maio 2014.
http://dx.doi.org/10.1590/S0100-06832012...
findings. Therefore, this evaluation suggests that classification tree models trained using point samples that better represent the entire variability of the predicting variables, i.e. without instance selection excluding data from buffers around soil map boundaries, is capable of producing more accurate classification trees for predicting occurrence of soil map units.
The relationship between the size of classification trees and the errors measured in the validation of the classification trees for the instance selection method using sampling only inside buffers is shown in figure 2c, with errors evaluated using 10-fold cross tabulation, and Figure 2d, evaluating errors using a supplied test set. For both error evaluation methods, sampling inside buffers presented lower accuracy, represented by larger prediction errors. Larger buffers presented smaller errors, and overall smallest errors were obtained using random sampling without instance selection sampling inside buffers around soil map units boundaries. Therefore, no evidence was found that data sampling close to soil map units boundaries would provide any advantage as selection method. No accuracy improvement was obtained.
Both methods of instance selection that account for areas located close to soil map unit boundaries tested in this study did not contribute to greater accuracy of classification trees used in digital soil class mapping when using the model to predict soil occurrence in the overall area. These types of instance selection, although possessing a logical rationale, do not appear adequate for application in digital soil class mapping because of potential reduction in the accuracy of classification tree models.
CONCLUSION:
Instance selection methods using both spatial selection of data avoiding sampling data inside buffers around boundaries of soil map units and sampling only inside these buffers were effective for reducing size of the dataset used for calibrating tree models classification, but failed to provide advantages to digital soil mapping because of potential reduction in the accuracy of classification tree models.
ACKNOWLEDGEMENTS
To Conselho Nacional de Desenvolvimento Científico e Tecnológico (CNPq) for providing a Research Productivity Fellowship for the first author.
- ABRAMS, M. et al. ASTER users´ handbook. Pasadena: JPL, 1999. 93p.
- BEVEN, K.; KIRKBY, N. A physically based variable contributing area model of basin hydrology. Bulletin des Sciences Hydrologiques, v.24, p.43-69, 1979. Disponível: <http://dx.doi.org/10.1080/02626667909491834>. Acesso em: 06 maio 2014.
» http://dx.doi.org/10.1080/02626667909491834 - BREIMAN, L. et al. Classification and regression trees. Monterey: Wadsworth, 1984. 358p.
» https://doi.org/Wadsworth - BUI, E.N. et al. Extracting soil-landscape rules from previous soil surveys. Australian Journal of Soil Research, v.37, p.495-508, 1999.
- EMBRAPA. Brazilian soil classification system. Centro Nacional de Pesquisa de Solos. 3.ed. Rio de Janeiro, 2013. (in Portuguese).
- ESRI. ArcGis 9.2. Redland, California., 2006. (Software).
- GIASSON, E. et al. Decision trees for digital soil mapping on subtropical basaltic steeplands. Scientia Agricola, v.68, p.167-174, 2011. Disponível em: <http://dx.doi.org/10.1590/S0103-90162011000200006>. Acesso em: 06 maio 2014.
» http://dx.doi.org/10.1590/S0103-90162011000200006 - HALL, M.A. Correlation-based feature subset selection for machine learning. 1999. 178f. Tese - Department of Computer Science, University of Waikato.
- HANSEN, M.K. et al. Inductively mapping expert-derived soil-landscape units within dambo wetland catenae using multispectral and topographic data. Geoderma, v.150, p.72-84, 2009. Disponível em: <http://www.sciencedirect.com/science/journal/00167061>. Acesso em: 06 maio 2014.
» http://www.sciencedirect.com/science/journal/00167061 - KÄMPF, N. Soil survey and land suitability for disposal of pig manure at River Santo Cristo watershed. Porto Alegre. SEMA-RS, 2004. Final Report (in Portuguese).
» https://doi.org/SEMA-RS - LAGACHERIE, P.; HOLMES, S. Addressing geographical data errors in a classification tree for soil unit prediction. International Journal of Geographical Information Science, v.11, p.183-198, 1997. Disponível em: <http://www.tandfonline.com/doi/abs/10.1080/136588197242455?journalCode=tgis20#.U2jZVfldWyU>. Acesso em: 06 maio 2014.
» http://www.tandfonline.com/doi/abs/10.1080/136588197242455?journalCode=tgis20#.U2jZVfldWyU - LIU, H.; MOTODA, H. Feature selection for knowledge discovery and data mining. Boston: Kluwer Academic Publishers, 1998. 214p.
- QUINLAN, J.R. C4.5: programs for machine learning. San Francisco: Morgan Kaufmann Publishers, 1993. 302p.
- SAMMUT, C.; WEBB, G.I. Encyclopedia of machine learning. New York: Springer, 2011. 549p.
- SCHMIDT, K. et al. Instance selection and classification tree analysis for large spatial datasets in digital soil mapping. Geoderma, v.146, p.138-146, 2008.
- SOIL SURVEY STAFF. Keys to soil taxonomy. 11.ed. Washington: USDA-Natural Resources Conservation Service, 2010. 338p.
- TEN CATEN, A. Mapeamento digital de solos: estratégia de pré-processamento de dados. Revista Brasileira Ciência do Solo, v.36, n.4,1083-1092, 2012. Disponível em: ISSN 0100-0683.<http://dx.doi.org/10.1590/S0100-06832012000400003>. Acesso em: 06 maio 2014.
» http://dx.doi.org/10.1590/S0100-06832012000400003 - WITTEN, A.H.; FRANK, E. Data mining: practical machine learning tools and techniques. 2.ed. San Francisco: Morgan Kaufmann Publishers, 2005. 664p.
- WOLOCK, D.M.; MCCABE, G.J. Comparison of single and multiple flow-direction algorithms for computing topographic parameters in TOPMODEL. Water Resources Research, v.31, p.1315-1324, 1995.
- ZHOU, B.; et al. Automated soil resources mapping based on decision tree and Bayesian predictive modeling. Journal of Zhejiang University Science, v.5, p.782-795, 2004.
Publication Dates
-
Publication in this collection
Sept 2015
History
-
Received
06 May 2014 -
Accepted
18 Sept 2014