ABSTRACT:
The aim of this study was to verify the genetic divergence amongst three broiler genotype, from both sexes, by means of a multivariate performance analysis and carcass traits. Nine hundred and ninety sexed, one-day chicks were utilized; belonged to the following genetic groups: Cobb 500, Hubbard Flex, and Ross 308. The study evaluated the daily average weight gain, the daily average ration consumption, feed conversion, body weight, weight and performance for breast, and carcass over the period from 1 to 35, and from 1 to 42 days of age. Performance of the genetic groups was evaluated by means of multivariate analysis of variance and by Fisher's linear discriminant function, using Roy's largest eigenvalue and Roy's union-intersection test for multiple comparisons. The genetic divergence study was carried out through the analysis of canonical variables and through Tocher method. Female animals from Cobb 500, Hubbard Flex, and Ross 308 genetic groups presented different canonical averages from males of the same groups. First two canonical variables explained 88.10% of variation between genetic groups. Genetic divergence between the evaluated groups allowed formation of two clusters with the following genotypes: Cluster 1 - Cobb 500, Hubbard Flex and Ross 308 females; Cluster 2 - Cobb 500, Hubbard Flex and Ross 308 males.
Key words:
grouping; discriminating analysis; genetic group
RESUMO:
Objetivou-se com este estudo verificar a divergência genética entre três genótipos de frangos de corte, de ambos os sexos, utilizando o desempenho e as características de carcaça por meio da análise multivariada. Utilizaram-se 990 pintos de um dia, sexados, dos seguintes grupos genéticos: Cobb 500, Hubbard Flex, e Ross 308. Avaliaram-se as seguintes variáveis: ganho em peso médio diário, consumo de ração médio diário, conversão alimentar, peso corporal, peso e rendimento do peito e da carcaça, nos períodos: 1 a 35 dias e 1 a 42 dias de idade. O desempenho dos grupos genéticos foi avaliado por meio da Análise de Variância Multivariada e da função discriminante linear de Fisher, usando os testes do maior autovalor de Roy e da união-interseção de Roy para as comparações múltiplas. O estudo da divergência genética foi feito por meio da análise por variáveis canônicas e pelo método de otimização de Tocher. As fêmeas dos grupos genéticos Cobb 500, Hubbard Flex e Ross 308 apresentaram médias canônicas diferentes dos machos desses mesmos genótipos. As duas primeiras variáveis canônicas explicaram 88,10% da variação entre os grupos genéticos. A divergência genética entre os grupos genéticos avaliados permitiu a formação de dois grupos com os seguintes genótipos: grupo 1 - Fêmeas Cobb 500, Hubbard Flex e Ross 308; e grupo 2 - Machos Cobb 500, Hubbard Flex e Ross 308.
Palavras-chave:
agrupamento; análise discriminante; grupo genético
INTRODUCTION:
The economically relevant characteristics, such as performance and carcass, used to evaluate broilers or genetic groups, are of quantitative nature and; therefore, are subjected to different genetic bases and different degrees of environmental influence, making difficult to understand the set of characteristics from univariate analyses (SAKAGUTI et al., 1996SAKAGUTI, E.S. et al. Evaluation of Tests of Multivariate Analysis of Variance in Experiments with Unbalanced Data. Revista Brasileira de Zootecnia, v.25, n.3, p.437-448, 1996. Available from: <Available from: http://www.revista.sbz.org.br/artigo/index.php?idiom=en&artigo=238
>. Accessed: Aug. 01, 2014.
http://www.revista.sbz.org.br/artigo/ind...
). A way to address this matter is the utilization of multivariate analysis techniques (FRANCI et al., 2001FRANCI, O. et al. The use of multivariate analysis for evaluating relationships among fat depots in heavy pigs of different genotypes. Meat Science, v.58, n.3, p.259-266, 2001. Available from: <Available from: http://www.sciencedirect.com/science/article/pii/S0309174000001637
>. Accessed: Jul. 12, 2014. doi: 10.1016/S0309-1740(00)00163-7.
http://www.sciencedirect.com/science/art...
); since, differently from the univariate analysis, they simultaneously match multiple pieces of information from an experimental unit (VIANA et al., 2000VIANA, C.F.A. et al. Study of Genetic Divergence Among Four Broilers Breeder Lines Using Multivariate Analysis., Revista Brasileira de Zootecnia v.29, n.4, p.1074-1081, 2000. Available from: <Available from: http://www.scielo.br/scielo.php?script=sci_arttext&pid=S1516-35982000000400018
>. Accessed: Jul. 17, 2014. doi: 10.1590/S1516-35982000000400018.
http://www.scielo.br/scielo.php?script=s...
).
There are several approaches in the field of multivariate analyses that allow the joint analysis of these characteristics. Amongst them, canonical variables technique represents an important tool in discriminating genetic groups, allowing the verification of the degree of similarity through uni- or multi-dimensional dispersion diagrams involving canonical averages. Cluster analysis is used by several authors (PIRES et al., 2002PIRES, A.V. et al. Genetic divergence study among six Leghorn lines by multivariate analysis., Arquivo Brasileiro de Medicina Veterinária e Zootecnia v.54, n.3, p.314-319, 2002. Available from: <Available from: http://www.scielo.br/scielo.php?pid=S0102-09352002000300016&script=sci_arttext
>. Accessed: Jun. 18, 2014. doi: 10.1590/S0102-09352002000300016.
http://www.scielo.br/scielo.php?pid=S010...
; YAMAKI et al., 2008YAMAKI, M. et al. Genetic divergence in meat-type hens using cluster analysis., Revista Brasileira de Zootecnia v.37, n.5, p.829-833. 2008. Available from: <Available from: http://www.scielo.br/scielo.php?pid=S1516-35982008000500008&script=sci_arttext
>. Accessed: Jun. 30, 2014. doi: 10.1590/S1516-35982008000500008.
http://www.scielo.br/scielo.php?pid=S151...
; VENTURA et al., 2012VENTURA, H.T. et al. Use of multivariate analysis to evaluate genetic groups of pigs for dry-cured ham production. Livestock Science, v.148, p.214-220, 2012. Available from: <Available from: http://www.sciencedirect.com/science/article/pii/S187114131200217X
>. Accessed: Jun. 01, 2014. doi: 10.1016/j.livsci.2012.06.007.
http://www.sciencedirect.com/science/art...
) as another type of multivariate technique which allowing sampling units to be synthetized in a number of groups. So, homogeneity in cluster and heterogeneity between the clusters are maintained (CRUZ et al., 2004CRUZ, C.D. et al. Modelos biométricos aplicados ao melhoramento genético. 3.ed. Viçosa: UFV, 2004. 480p.),Therefore, this study aimed to verify the genetic divergence amongst three broiler genotypes, from both sexes, by using performance and carcass traits with the multivariate analysis technique.
MATERIAL AND METHODS:
The experiment was conducted in the poultry sector of the Animal Sciences Department at the "Universidade Federal dos Vales do Jequitinhonha e Mucuri" (UFVJM), located at the JK campus, in Diamantina/MG, Brazil, from October 31 to December 12, 2011.
Nine hundred and ninety one-day chicks, male and female, were utilized; the chicks derived from three broiler genotypes: Cobb 500, Hubbard Flex, and Ross 308, and were distributed in an entirely randomized design, with five repetitions. Sexed chicks were kept in an experimental wooden shed, measuring 40 meters in length and 8 meters wide, with a ceiling height of 3 meters, allocated into thirty sections of 1.65x1.55m, with thirty-three animals in each section. Experimental ration was maize and soy-meal based, according to HUBBARD (2011HUBBARD - Breeder Nutrition Guide, 2011. 40p. Available from: <Available from: http://www.hubbardbreeders.com
>. Accessed: Sept. 28, 2011.
http://www.hubbardbreeders.com...
).
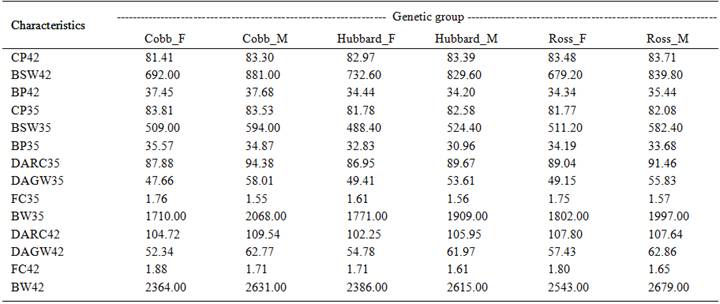
Genetic groups (treatments) consisted of combination between genotypes and sex, for a total of six treatments. Performance and carcass traits were the following: daily average gain weight (DAGW), daily average ration consumption (DARC), feed conversion (FC), body weight (BW), breast weight (BSW), breast performance (BP), carcass weight (CW), and carcass performance (CP), over the following periods: 1 to 35 days (DAGW35, DARC35, FC35, BW35, BSW35, BP35, CW35, and CP35, respectively) and 1 to 42 days (DAGW142, DARC42, FC42 e BW42, BSW42, BP42, CW42, and CP42, respectively). For the carcass traits, two broilers were slaughtered for each repetition, one of each sex, after eight hours of solid food fasting; carcass was composed of head and feet.
Statistical analyses were conducted with the "proc candisc" procedure of SAS software (2002), preceded by the multivariate analysis of variance (MANOVA) according to the model: Yijk = uk + Gik + eijk; Yijk = value observed for the k characteristic, for the j repetition, of the i genetic group (i = 1, 2, ..., 6; j= 1, 2, 3, 4, 5; k=1, 2, ..., 18); uk = average of the k characteristic; Gik = effect of the i genetic group over the k characteristic; eijk = random error associated with the Yijk observation.
The discard criteria for the variables was adopted after evaluating the importance of characteristics from weighting coefficient of every characteristic in the final canonical variables, which, by estimation, withhold the minimal proportion of total variation (CRUZ et al., 2004CRUZ, C.D. et al. Modelos biométricos aplicados ao melhoramento genético. 3.ed. Viçosa: UFV, 2004. 480p.). After discarding variables, researchers carried out average tests for comparison of variables amongst genetic groups with characteristics that were maintained.
In contrast to the univariate analysis, MANOVA generates A, H, and E matrices for sum of squares and products. The hypothesis tested by MANOVA is the equality of average vectors between the groups, i.e.: H0 : G1 =G2 = G3 = G4 = G5 = G6
In order to test this hypothesis Roy's largest eigenvalue test was conducted; it consisted of the determination of characteristic roots (eigenvalues) of the characteristic equation: |E-1λI| = 0 or |H - λE| = 0
I = identity matrix; λ l = eigenvalues; E-1 = residual sum-of-squares-and-products matrix inverse; and H = sum-of-squares-and-treatment-products matrix.
Considering that lmax is the largest eigenvalue of E-1 H, the following statistic is as established: 
The obtained value (θ) is compared to the significance limit given in tables (MORRISON, 1967MORRISON, D.F. Multivariate statistical methods. New York: McGraw-Hill, 1967. 338p.; HARRIS, 1975HARRIS, R.J. A primer of multivariate statistics. New York: Academic, 1975. 332p.).
Afterwards, contrast comparison test amongst averages was carried out amongst the averages through Roy's union-intersection test. For cluster analysis, it was used Tocher method, adopting Mahalanobis distance as the dispersion measure, as mentioned by RAO (1952RAO, C.R. Advanced statistical methods in biometric research. New York: Jonh Wiley & Sons, 1952. 390p.). Several authors have used these tests to study genetic divergence (VIANA et al., 2000VIANA, C.F.A. et al. Study of Genetic Divergence Among Four Broilers Breeder Lines Using Multivariate Analysis., Revista Brasileira de Zootecnia v.29, n.4, p.1074-1081, 2000. Available from: <Available from: http://www.scielo.br/scielo.php?script=sci_arttext&pid=S1516-35982000000400018
>. Accessed: Jul. 17, 2014. doi: 10.1590/S1516-35982000000400018.
http://www.scielo.br/scielo.php?script=s...
; CARNEIRO et al., 2002CARNEIRO, P.L.S. et al. Study on genetic divergence among broilers lines by multivariate analysis. Arquivo Brasileiro de Medicina Veterinária e Zootecnia, v.54, n.1, p.75-83, 2002. Available from: <Available from: http://www.scielo.br/scielo.php?pid=S0102-09352002000100012&script=sci_arttext
>. Accessed: Jul. 23, 2014. doi: 10.1590/S0102-09352002000100012.
http://www.scielo.br/scielo.php?pid=S010...
; PIRES et al., 2002PIRES, A.V. et al. Genetic divergence study among six Leghorn lines by multivariate analysis., Arquivo Brasileiro de Medicina Veterinária e Zootecnia v.54, n.3, p.314-319, 2002. Available from: <Available from: http://www.scielo.br/scielo.php?pid=S0102-09352002000300016&script=sci_arttext
>. Accessed: Jun. 18, 2014. doi: 10.1590/S0102-09352002000300016.
http://www.scielo.br/scielo.php?pid=S010...
; VENTURA et al., 2012VENTURA, H.T. et al. Use of multivariate analysis to evaluate genetic groups of pigs for dry-cured ham production. Livestock Science, v.148, p.214-220, 2012. Available from: <Available from: http://www.sciencedirect.com/science/article/pii/S187114131200217X
>. Accessed: Jun. 01, 2014. doi: 10.1016/j.livsci.2012.06.007.
http://www.sciencedirect.com/science/art...
).
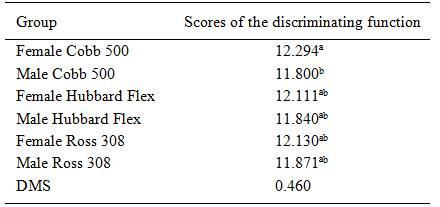
The discriminating function was estimated based on the canonical variable with the largest correlation with the data, the first canonical variable, which obtained a score for each genetic group. Unidimensionally representing genetic groups, an analysis of variance (ANOVA), from these scores, was conducted to test the hypothesis of genotypic equality: H0 : g1 = g2 = g3 = g4 = g5 = g6.
To test the contrast amongst the group averages (treatments), the minimum significant difference (DMS), at the probability of 1%, was calculated through Roy's test (MORRISON, 1967MORRISON, D.F. Multivariate statistical methods. New York: McGraw-Hill, 1967. 338p.; HARRIS, 1975HARRIS, R.J. A primer of multivariate statistics. New York: Academic, 1975. 332p.).
RESULTS AND DISCUSSION:
The CW35, BSW35, and CW42 variables are disposable (Table 1), because they retain a minimum proportion of the total variation; they present large absolute values for the last canonical variables (Can5, Can4, and Can2, respectively) and; thus, account for a practically insignificant variation (CRUZ et al., 2004CRUZ, C.D. et al. Modelos biométricos aplicados ao melhoramento genético. 3.ed. Viçosa: UFV, 2004. 480p.).
From the analyses, regarding only the non-discarded characteristics, no significant difference was observed (P≤0.01) between the genetic groups by Roy's test, considering every characteristic (Table 2). It is evident that, overall, male broilers, independently of their genetic group, had greater tendency for performance. Similarly MORO et al. (2005MORO, D.N. et al. Productive performance of four cut chickens lineages. Ciência Rural, v.35, n.2, p. 446-449, 2005. Available from: <Available from: http://www.scielo.br/scielo.php?pid=S0103-84782005000200032&script=sci_arttext
>. Accessed: Aug. 17, 2014. doi: 10.1590/S0103-84782005000200032.
http://www.scielo.br/scielo.php?pid=S010...
) and LIMA et al. (2008LIMA L.M.B. et al. Effect of energy, lysine and methionine and cystine levels on performance and carcass yield of broiler chickens. Revista Brasileira Zootecnia, v.37, n.8, p.1424-1432, 2008. Available from: <Available from: http://www.scielo.br/scielo.php?script=sci_arttext&pid=S1516-35982008000800013
>. Accessed: Jun. 20, 2014. doi: 10.1590/S1516-35982008000800013.
http://www.scielo.br/scielo.php?script=s...
) research achieved similar results. Male Cobb 500 group presented a greater tendency for performance at 35 days of age and greater breast weight and performance at 42 days. Ross, the best performance for 308 male Ross broilers had been seen at the final breeding stage, i.e., at 42 days of age, aside from having a better carcass performance at the same age.
These results demonstrated that the Cobb 500 male group was the most precocious, because it presented a largest growth rate when compared to the male Ross 308 group; however, at 42 days of age, the male Ross 308 broilers were superior to the other groups, which may had occurred due to the fact that they s had a better compensatory gain because they were more efficient in converting ration into muscle within the same period, most notably by their greater body weight at 42 days of age. Female Cobb 500 group presented greater breast and carcass efficiency at 35 days of age, and the male Cobb 500 group displayed greater weight and higher breast efficiency at 42 days of age, which evinces that broilers from the Cobb 500 genotype, regardless sex, presented higher efficiency in muscle deposition for carcass and breast. Similar results were found by FERNANDES et al. (2013FERNANDES, J.I.M.; et al. Effect of strain, sex and age on carcass parameters of broilers. Acta Scientiarium, v.35, n.1, p-99-105, 2013. Available from: <Available from: http://www.scielo.br/scielo.php?pid=S1807-86722013000100015&script=sci_arttext
>. Accessed: Jul. 25, 2014. doi: 10.4025/actascianimsci.v35i1.13354.
http://www.scielo.br/scielo.php?pid=S180...
).
There is a difference (P≤0.01) in the performance between sexes in the genetic groups evaluated by Roy's test, applied to the discriminating function on the basis of the canonical variable of greater correlation with the data (Table 3). Female Cobb 500 group presented a greater average; excepting of Cobb 500 male group, which did not differ statistically when compared to others. Performance of every genetic group, for each studied characteristic, is explained by Roy's largest eigenvalue test.
In this study, obtained information were employed for comparison amongst groups, as well as in evaluation amongst lineages of a same breed of core livestock, such as in studies of VIANA et al. (2000VIANA, C.F.A. et al. Study of Genetic Divergence Among Four Broilers Breeder Lines Using Multivariate Analysis., Revista Brasileira de Zootecnia v.29, n.4, p.1074-1081, 2000. Available from: <Available from: http://www.scielo.br/scielo.php?script=sci_arttext&pid=S1516-35982000000400018
>. Accessed: Jul. 17, 2014. doi: 10.1590/S1516-35982000000400018.
http://www.scielo.br/scielo.php?script=s...
) and CARNEIRO et al. (2002CARNEIRO, P.L.S. et al. Study on genetic divergence among broilers lines by multivariate analysis. Arquivo Brasileiro de Medicina Veterinária e Zootecnia, v.54, n.1, p.75-83, 2002. Available from: <Available from: http://www.scielo.br/scielo.php?pid=S0102-09352002000100012&script=sci_arttext
>. Accessed: Jul. 23, 2014. doi: 10.1590/S0102-09352002000100012.
http://www.scielo.br/scielo.php?pid=S010...
), when the gathered data were used along with other information for the disposal or selection of lineages.
Canonical variables technique is normally considered efficient when the most part of the variation among characteristics may be explained in the first three main components, since transformation in new scale stores all the variability explained by variables in original scale, which results in non-correlated variables. In the present study, the first two canonical variables explained 88.10% of the observed variation (Table 4) and; therefore, were utilized to generate two canonical averages (MC1 and MC2) used in the bidimensional representation. From figure 1, it is possible to visualise the graphical distances that represent the similarities and dissimilarities between the genetic groups, where the greater differences were observed between the same variables; these variables are larger in MC1 and smaller in MC2, due to the fact that VC1, directly related to MC1, retains the greatest proportion of data variation: 73.83% (Table 4). Differences are big enough for female Cobb 500, Hubbard Flex, and Ross 308 groups to present MC1 with a negative value and; thus, an average in the opposite direction when compared to the other genetic groups, which evinces that these groups are different and that sex influences broilers performance. Regarding the second canonical average (MC2), results were less discrepant, which is justified by the percentage of total variance explained by VC2 (Table 4).
Canonical variables, eigenvalues, and variance percentages obtained with the analysis of the characteristics for the six broiler groups.

Six genetic groups were also gathered by Tocher method, resulting in two clusters, which are represented by the circles in figure 1; circles represent the genetic similarity in the cluster, and genetic divergence between clusters. Female Cobb 500, Hubbard Flex, and Ross 308 groups were gathered altogether, and male Cobb 500, Hubbard Flex, and Ross 308 groups were as well, supporting the hypothesis that, regardless of genotype, sex influences the performance and carcass of broilers. Other cluster analysis studies between genotypes were conducted by YAMAKI et al. (2008YAMAKI, M. et al. Genetic divergence in meat-type hens using cluster analysis., Revista Brasileira de Zootecnia v.37, n.5, p.829-833. 2008. Available from: <Available from: http://www.scielo.br/scielo.php?pid=S1516-35982008000500008&script=sci_arttext
>. Accessed: Jun. 30, 2014. doi: 10.1590/S1516-35982008000500008.
http://www.scielo.br/scielo.php?pid=S151...
), with broiler matrices; PIRES et al. (2002PIRES, A.V. et al. Genetic divergence study among six Leghorn lines by multivariate analysis., Arquivo Brasileiro de Medicina Veterinária e Zootecnia v.54, n.3, p.314-319, 2002. Available from: <Available from: http://www.scielo.br/scielo.php?pid=S0102-09352002000300016&script=sci_arttext
>. Accessed: Jun. 18, 2014. doi: 10.1590/S0102-09352002000300016.
http://www.scielo.br/scielo.php?pid=S010...
), with leghorn poultry; and VENTURA et al. (2012VENTURA, H.T. et al. Use of multivariate analysis to evaluate genetic groups of pigs for dry-cured ham production. Livestock Science, v.148, p.214-220, 2012. Available from: <Available from: http://www.sciencedirect.com/science/article/pii/S187114131200217X
>. Accessed: Jun. 01, 2014. doi: 10.1016/j.livsci.2012.06.007.
http://www.sciencedirect.com/science/art...
) with a swine sample.
CONCLUSION:
Multivariate analysis was an appropriate tool to indicate the traits that are amenable to disposal: carcass weight and breast at 35 days old and carcass weight at 42 days old. Males of Cobb and Ross genotypes were better and female Cobb group obtained higher carcass and breast yields. By cluster analysis it was possible to form two groups: 1 - Cobb female, Hubbard female and Ross female and group 2 - Male Cobb, Hubbard male and Ross male; thus, showing the influence of gender on performance and carcass of broilers.
ACKNOWLEDGEMENTS
The authors thank the financial support and the help from Coordenação de Aperfeiçoamento de Pessoal de Nível Superior (CAPES), Conselho Nacional de Desenvolvimento Científico e Tecnológico (CNPq), and Fundação de Amparo à Pesquisa do estado de Minas Gerais (FAPEMIG), and "Global Breeders Avícola Ltda" for the animals donation.
REFERENCES:
- CARNEIRO, P.L.S. et al. Study on genetic divergence among broilers lines by multivariate analysis. Arquivo Brasileiro de Medicina Veterinária e Zootecnia, v.54, n.1, p.75-83, 2002. Available from: <Available from: http://www.scielo.br/scielo.php?pid=S0102-09352002000100012&script=sci_arttext >. Accessed: Jul. 23, 2014. doi: 10.1590/S0102-09352002000100012.
» https://doi.org/10.1590/S0102-09352002000100012» http://www.scielo.br/scielo.php?pid=S0102-09352002000100012&script=sci_arttext - CRUZ, C.D. et al. Modelos biométricos aplicados ao melhoramento genético. 3.ed. Viçosa: UFV, 2004. 480p.
- FERNANDES, J.I.M.; et al. Effect of strain, sex and age on carcass parameters of broilers. Acta Scientiarium, v.35, n.1, p-99-105, 2013. Available from: <Available from: http://www.scielo.br/scielo.php?pid=S1807-86722013000100015&script=sci_arttext >. Accessed: Jul. 25, 2014. doi: 10.4025/actascianimsci.v35i1.13354.
» https://doi.org/10.4025/actascianimsci.v35i1.13354» http://www.scielo.br/scielo.php?pid=S1807-86722013000100015&script=sci_arttext - FRANCI, O. et al. The use of multivariate analysis for evaluating relationships among fat depots in heavy pigs of different genotypes. Meat Science, v.58, n.3, p.259-266, 2001. Available from: <Available from: http://www.sciencedirect.com/science/article/pii/S0309174000001637 >. Accessed: Jul. 12, 2014. doi: 10.1016/S0309-1740(00)00163-7.
» https://doi.org/10.1016/S0309-1740(00)00163-7» http://www.sciencedirect.com/science/article/pii/S0309174000001637 - HARRIS, R.J. A primer of multivariate statistics. New York: Academic, 1975. 332p.
- HUBBARD - Breeder Nutrition Guide, 2011. 40p. Available from: <Available from: http://www.hubbardbreeders.com >. Accessed: Sept. 28, 2011.
» http://www.hubbardbreeders.com - LIMA L.M.B. et al. Effect of energy, lysine and methionine and cystine levels on performance and carcass yield of broiler chickens. Revista Brasileira Zootecnia, v.37, n.8, p.1424-1432, 2008. Available from: <Available from: http://www.scielo.br/scielo.php?script=sci_arttext&pid=S1516-35982008000800013 >. Accessed: Jun. 20, 2014. doi: 10.1590/S1516-35982008000800013.
» https://doi.org/10.1590/S1516-35982008000800013» http://www.scielo.br/scielo.php?script=sci_arttext&pid=S1516-35982008000800013 - MORO, D.N. et al. Productive performance of four cut chickens lineages. Ciência Rural, v.35, n.2, p. 446-449, 2005. Available from: <Available from: http://www.scielo.br/scielo.php?pid=S0103-84782005000200032&script=sci_arttext >. Accessed: Aug. 17, 2014. doi: 10.1590/S0103-84782005000200032.
» https://doi.org/10.1590/S0103-84782005000200032» http://www.scielo.br/scielo.php?pid=S0103-84782005000200032&script=sci_arttext - MORRISON, D.F. Multivariate statistical methods. New York: McGraw-Hill, 1967. 338p.
- PIRES, A.V. et al. Genetic divergence study among six Leghorn lines by multivariate analysis., Arquivo Brasileiro de Medicina Veterinária e Zootecnia v.54, n.3, p.314-319, 2002. Available from: <Available from: http://www.scielo.br/scielo.php?pid=S0102-09352002000300016&script=sci_arttext >. Accessed: Jun. 18, 2014. doi: 10.1590/S0102-09352002000300016.
» https://doi.org/10.1590/S0102-09352002000300016» http://www.scielo.br/scielo.php?pid=S0102-09352002000300016&script=sci_arttext - RAO, C.R. Advanced statistical methods in biometric research. New York: Jonh Wiley & Sons, 1952. 390p.
- SAKAGUTI, E.S. et al. Evaluation of Tests of Multivariate Analysis of Variance in Experiments with Unbalanced Data. Revista Brasileira de Zootecnia, v.25, n.3, p.437-448, 1996. Available from: <Available from: http://www.revista.sbz.org.br/artigo/index.php?idiom=en&artigo=238 >. Accessed: Aug. 01, 2014.
» http://www.revista.sbz.org.br/artigo/index.php?idiom=en&artigo=238 - VENTURA, H.T. et al. Use of multivariate analysis to evaluate genetic groups of pigs for dry-cured ham production. Livestock Science, v.148, p.214-220, 2012. Available from: <Available from: http://www.sciencedirect.com/science/article/pii/S187114131200217X >. Accessed: Jun. 01, 2014. doi: 10.1016/j.livsci.2012.06.007.
» https://doi.org/10.1016/j.livsci.2012.06.007.» http://www.sciencedirect.com/science/article/pii/S187114131200217X - VIANA, C.F.A. et al. Study of Genetic Divergence Among Four Broilers Breeder Lines Using Multivariate Analysis., Revista Brasileira de Zootecnia v.29, n.4, p.1074-1081, 2000. Available from: <Available from: http://www.scielo.br/scielo.php?script=sci_arttext&pid=S1516-35982000000400018 >. Accessed: Jul. 17, 2014. doi: 10.1590/S1516-35982000000400018.
» https://doi.org/10.1590/S1516-35982000000400018» http://www.scielo.br/scielo.php?script=sci_arttext&pid=S1516-35982000000400018 - YAMAKI, M. et al. Genetic divergence in meat-type hens using cluster analysis., Revista Brasileira de Zootecnia v.37, n.5, p.829-833. 2008. Available from: <Available from: http://www.scielo.br/scielo.php?pid=S1516-35982008000500008&script=sci_arttext >. Accessed: Jun. 30, 2014. doi: 10.1590/S1516-35982008000500008.
» https://doi.org/10.1590/S1516-35982008000500008» http://www.scielo.br/scielo.php?pid=S1516-35982008000500008&script=sci_arttext
-
1
CR-2014-1466.R2
Publication Dates
-
Publication in this collection
24 Nov 2015 -
Date of issue
Mar 2016
History
-
Received
10 Mar 2014 -
Accepted
08 Aug 2015 -
Reviewed
18 Oct 2015