
ABSTRACT:
This study aimed to verify if the growth pattern of coffee berries, considering fresh mass accumulation over time, is double sigmoid and to select the most suitable nonlinear model to describe such behavior. Data used consisted of fourteen longitudinal observations of average fresh mass of coffee berries obtained in an experiment with the cultivar Obatã IAC 1669-20. The fits provided by the Logistic and Gompertz models were compared in their single and double versions. Parameters were estimated using the least squares method using the Gauss-Newton algorithm implemented in the nls function of the R software. It can be concluded that the growth pattern of the coffee fruit, in fresh mass accumulation, is double sigmoid. The double Gompertz and double Logistic models were adequate to describe such a growth curve, with a superiority of the double Logistic model.
Key words:
Coffea arabica; double Gompertz; double Logistic; nonlinear
RESUMO:
O objetivo deste trabalho foi verificar se o padrão de crescimento do fruto do cafeeiro, considerando acúmulo de massa fresca em função do tempo, é realmente duplo sigmoidal e selecionar o modelo não linear mais indicado para descrever tal comportamento. Os dados utilizados são quatorze observações longitudinais de massa fresca média de frutos do cafeeiro obtidos em um experimento com a cultivar Obatã IAC 1669-20. Foram comparados os ajustes fornecidos pelos modelos Logístico e Gompertz em suas versões simples e duplo. A estimação dos parâmetros foi feita pelo método dos mínimos quadrados utilizando o algoritmo de Gauss-Newton implementado na função nls do software R. Pode-se concluir que o padrão de crescimento do fruto do cafeeiro, em acúmulo de massa fresca, é duplo sigmoidal. Os modelos duplo Gompertz e duplo Logístico se mostraram adequados para descrever tal curva de crescimento, com uma superioridade do modelo duplo Logístico.
Palavras-chave:
Coffea arabica; duplo Gompertz; duplo Logístico; não linear
INTRODUCTION:
The concern about producing quality coffee and also increasing productivity has led farmers to invest more and more in processes that involve improved crop management (FERNANDES et al., 2014FERNANDES, T.J. et al. Selection of nonlinear models for the description of the growth curves of coffee fruit. Coffee Science , v.9, n.2, p.207-215, 2014. Available from: <Available from: https://www.coffeescience.ufla.br/index.php/Coffeescience/article/view/618/pdf_86
>. Accessed: Aug. 24, 2016.
https://www.coffeescience.ufla.br/index....
). In this sense, studies that aim to describe growth curves of coffee berries can help the producer to identify possible points of intervention during fruit development, such as time of greatest mass gain and the most appropriate time for fertilization, thus obtaining a better final quality of the product.
A particularly intriguing and useful problem for researchers and producers is to predict the average size and/or weight of the fruit at harvest time based on information available at an earlier point in the agricultural year, possibly at the beginning of the productive cycle. In the case of coffee that is sold in 60kg bags, it is important to know the final weight of the product. Of course, such information depends on a number of environmental and management factors, which may vary from year to year, but are generally well established at the beginning of the production cycle. Several methods can be used in this context, a major one is the determination of the fruit growth curve (BEBBINGTON et al., 2009BEBBINGTON, M. et al. Dynamics and phases of kiwifruit (Actinidia deliciosa) growth curves. New Zealand Journal of Crop and Horticultural Science, v.37, n.3, p.179-188, 2009. Available from: <Available from: http://dx.doi.org/10.1080/01140670909510263
>. Accessed: Aug. 27, 2016.
http://dx.doi.org/10.1080/01140670909510...
).
The coffee plant takes about two years to complete its phenological cycle, which has a succession of vegetative and reproductive phases, unlike most of the plants that produce the inflorescences in spring and fruit in the same year. According to NUNES et al. (2010NUNES, F.L. et al. Agrometeorological models to estimate the duration of flowering-maturation stage for three arabica coffee cultivars. Bragantia , v.69, n.4, p.1011-1018, 2010. Available from: <Available from: http://dx.doi.org/10.1590/S0006-87052010000400029
>. Accessed: Aug. 24, 2016.
http://dx.doi.org/10.1590/S0006-87052010...
), the first phenological year begins with the vegetative growth and the formation of leaf buds, later the floral buds appear, passing through the induction, maturation and dormancy. The second phenological year begins with flowering, in the resumption of the spring rainfall events followed by the appearance of the fruit between six and eight weeks after flowers fall. From this point, authors such as CASTRO & MARRACCINI (2006CASTRO, R.D.; MARRACCINI, P. Cytology, biochemistry and molecular changes during coffee fruit development. Brazilian Journal of Plant Physiology, v.18, n.1p.175-199, 2006. Available from: <Available from: http://dx.doi.org/10.1590/S1677-04202006000100013
>. Accessed: Aug. 24, 2016.
http://dx.doi.org/10.1590/S1677-04202006...
) and MORAIS et al. (2008MORAIS, H. et al. Detailed phenological scale of the reproductive phase of Coffea arabica. Bragantia, v.67, n.1, p.693-699, 2008. Available from: <Available from: http://dx.doi.org/10.1590/S0006-87052008000100031
>. Accessed: Aug. 24, 2016.
http://dx.doi.org/10.1590/S0006-87052008...
) classify the development of the fruit in five stages, namely: chumbinho, fast growth, slow growth, granulation and maturation.
Along these stages, accompanying the accumulated fresh mass of the fruit, a double sigmoid growth pattern is identified (CASTRO & MARRACCINI, 2006CASTRO, R.D.; MARRACCINI, P. Cytology, biochemistry and molecular changes during coffee fruit development. Brazilian Journal of Plant Physiology, v.18, n.1p.175-199, 2006. Available from: <Available from: http://dx.doi.org/10.1590/S1677-04202006000100013
>. Accessed: Aug. 24, 2016.
http://dx.doi.org/10.1590/S1677-04202006...
; LAVIOLA et al., 2007LAVIOLA, B.G. et al. Nutrient accumulation in coffee fruits at four plantations altitude: calcium, magnesium and sulfur. Revista Brasileira de Ciência do Solo, v.31, n.6, p.1451-1462, 2007. Available from: <Available from: http://dx.doi.org/10.1590/S0100-06832007000600022
>. Accessed: Aug. 24, 2016.
http://dx.doi.org/10.1590/S0100-06832007...
; MORAIS et al., 2008MORAIS, H. et al. Detailed phenological scale of the reproductive phase of Coffea arabica. Bragantia, v.67, n.1, p.693-699, 2008. Available from: <Available from: http://dx.doi.org/10.1590/S0006-87052008000100031
>. Accessed: Aug. 24, 2016.
http://dx.doi.org/10.1590/S0006-87052008...
). But due to the difficulties involved in estimating the parameters of double sigmoid curves, these authors only characterized this pattern, without effectively modeling such growth and obtaining estimates for the parameters of a double sigmoid model.
For being able to describe the most diverse situations, to present better quality of fit even using few parameters and, mainly, to present practical interpretation for the estimations of these parameters, the nonlinear regression models are very used in the most diverse areas of knowledge, mainly in the study of growth curves (THOLON & QUEIROZ, 2009THOLON, P.; QUEIROZ, S.A. Mathematic models applied to describe growth curves in poultry applied to animal breeding. Ciência Rural , v.39, n.7, p.2261-2269, 2009. Available from: <Available from: http://dx.doi.org/10.1590/S0103-84782009000700050
>. Accessed: Aug. 24, 2016.
http://dx.doi.org/10.1590/S0103-84782009...
; PEREIRA et al., 2014PEREIRA, A.A. et al. Description vegetative growth of coffee tree farming ruby mg 1192 using regression models. Coffee Science , v.9, n.2, p.263-271, 2014. Available from: <Available from: https://coffeescience.ufla.br/index.php/Coffeescience/article/view/632/pdf_93
>. Accessed: Aug. 24, 2016.
https://coffeescience.ufla.br/index.php/...
; SOUSA et al., 2014SOUSA, I.F. et al. Fitting nonlinear autoregressive models to describe coffee seed germination. Ciência Rural , v.44, p.2016-2021, 2014. Available from: <Available from: http://dx.doi.org/10.1590/0103-8478cr20131341
>. Accessed: Aug. 24, 2016.
http://dx.doi.org/10.1590/0103-8478cr201...
; LÚCIO et al., 2016LÚCIO A.D. et al. Nonlinear models for estimating cherry tomato yield. Ciência Rural, v.46, n.2, p.233-241, 2016. Available from: <Available from: http://dx.doi.org/10.1590/0103-8478cr20150067
>. Accessed: Aug. 24, 2016.
http://dx.doi.org/10.1590/0103-8478cr201...
). Nonlinear models of the Richards family are the most indicated in the literature for the description of growth curves, namely: Logistic, Gompertz, Brody and von Bertalanffy.
Although, consolidated in the description of growth curves with a simple sigmoid, in curves with double sigmoid pattern these models are still not widely used, possibly due to the lack of knowledge on how to obtain a double sigmoid expression. Assuming that double sigmoid curves result from two consecutive growth processes, these can be obtained by the sum of two simple growth functions (MISCHAN et al., 2015MISCHAN, M.M. et al. Inflection and stability points of diphasic logistic analysis of growth. Scientia Agricola, v.72, n.3, p.215-220, 2015. Available from: <http://dx.doi.org/10.1590/0103-9016-2014-0212>. Accessed: Aug. 24, 2016.
http://dx.doi.org/10.1590/0103-9016-2014...
). Thus, to describe the double sigmoid growth, two simple sigmoids are considered in a single model, each with the purpose of explaining a certain stage of growth.
The few researchs using double sigmoid models are related to animal growth (SANTORO et al., 2005SANTORO, K.R. et al. Growth curve parameters for Zebu breeds raised at Pernambuco State, Northeastern Brazil. Revista Brasileira de Zootecnia, v.34, n.6, p.2262-2279, 2005. Available from: <Available from: http://dx.doi.org/10.1590/S1516-35982005000700013
>. Accessed: Aug. 24, 2016.
http://dx.doi.org/10.1590/S1516-35982005...
; MENDES et al., 2008MENDES, P.N. et al. Difasics logistic model in the study of the growth of Hereford breed females. Ciência Rural , v.38, n.7, p.1984-1990, 2008. Available from: <http://dx.doi.org/10.1590/S0103-84782008000700029>. Accessed: Aug. 24, 2016.
http://dx.doi.org/10.1590/S0103-84782008...
; VASQUEZ et al., 2012VASQUEZ, J.A. et al. Evaluation of non-linear equations to model different animal growths with mono and bisigmoid profiles. Journal of Theoretical Biology, v.314, p.95-105, 2012. Available from: <Available from: http://dx.doi.org/10.1016/j.jtbi.2012.08.027
>. Accessed: Aug. 24, 2016.
http://dx.doi.org/10.1016/j.jtbi.2012.08...
). However, in stone fruits, the growth remarkably overlaps the growth of the pulp in a first instant, causing measurements as a function of time present two points of inflection, characterizing a double S-shaped curve that can be described by two sigmoids. Nonetheless, most of the authors who study fruit growth only visually identify such a growth pattern without proceeding with the fit of regression models (BEBBINGTON et al., 2009BEBBINGTON, M. et al. Dynamics and phases of kiwifruit (Actinidia deliciosa) growth curves. New Zealand Journal of Crop and Horticultural Science, v.37, n.3, p.179-188, 2009. Available from: <Available from: http://dx.doi.org/10.1080/01140670909510263
>. Accessed: Aug. 27, 2016.
http://dx.doi.org/10.1080/01140670909510...
; FAMIANI et al., 2012FAMIANI, F. et al. Development and metabolism of the fruit and seed of the Japanese plum Ozark premier (Rosaceae). Journal of Plant Physiology, v.169, p.551-560, 2012. Available from: <Available from: http://dx.doi.org/10.1016/j.jplph.2011.11.020
>. Accessed: Aug. 24, 2016.
http://dx.doi.org/10.1016/j.jplph.2011.1...
; SILVA et al., 2013SILVA, D.F.P. et al. Growth curve and respiratory pattern of genotypes of peach fruit in subtropical region. Revista Brasileira de Fruticultura , v.35, n.2, p.642-649, 2013. Available from: <Available from: http://dx.doi.org/10.1590/S0100-29452013000200037
>. Accessed: Aug. 24, 2016.
http://dx.doi.org/10.1590/S0100-29452013...
; NAVA et al., 2014NAVA, A.D. et al. Growth kinetics of vegetative and reproductive organs of guava (Psidium guajava L.) in Iguala Guerrero, Mexico. Agricultural Sciences, v.5, p.1468-1475, 2014. Available from: <Available from: http://dx.doi.org/10.4236/as.2014.514157
>. Accessed: Aug. 24, 2016.
http://dx.doi.org/10.4236/as.2014.514157...
; SANTOS et al., 2015SANTOS, M.A. et al. Growth and development of gabiroba Campomanesia adamantium (Cambess.) O. Berg fruits. African Journal of Agricultural Research, v.10, n.14, p.1765-1772, 2015. Available from: <Available from: http://dx.doi.org/10.5897/AJAR2014.8517
>. Accessed: Aug. 24, 2016.
http://dx.doi.org/10.5897/AJAR2014.8517...
).
In this context, the goal of this study was to verify if the growth pattern of coffee berries, explaining the accumulated fresh mass over time, is double sigmoid and selecting the most suitable nonlinear model to describe such curve.
MATERIALS AND METHODS:
Data were extracted from CUNHA & VOLPE (2011CUNHA, A.R.; VOLPE, C.A. Growth curves of coffee fruits ‘Obatã IAC 1669-20’ in different alignments planting. Semina: Ciências Agrárias, v.32, n.1, p.49-62, 2011. Available from: <Available from: http://dx.doi.org/10.5433/1679-0359.2011v32n1p49
>. Accessed: Aug. 24, 2016.
http://dx.doi.org/10.5433/1679-0359.2011...
) and corresponded to partial results of an experiment conducted at the Faculty of Agrarian and Veterinary Sciences, Universidade Estadual Paulista “Júlio de Mesquita Filho” (UNESP), Jaboticabal Campus, State of São Paulo (615m altitude), with the cultivar ‘Obatã IAC 1669-20’, C. arabica species. Crop was implemented at the alignment of planting 51º - 231º; the experiment was conducted in the 2007/2008 growing season, in which the coffee plants were 5 years of age, average height of 2m and spacing of 3.5x0.5m.
The experimental crop was divided into four plots with 100 plants each. Samples were taken randomly in the plots, by collecting 50 berries from the north face and 50 from the southern face. The development of the fruit was monitored for 14 collections with a mean interval of 15 days, the first obtained on 11-06-07, at 96 days after flowering (DAF) and the last on 05-21-08, at 293 DAF. Berries were weighed on an analytical balance accurate to 0.0001g to obtain the average fresh mass (in grams).
The Logistic and Gompertz nonlinear regression models were used, in their simple and double sigmoid versions, because even if the information in the literature indicates a pattern of double sigmoid growth, it is necessary to verify if doubling the number of parameters of the model really attains a gain in the quality of fit, thus prevailing the parsimony principle. There are different parameterizations of these models and, according to FERNANDES et al. (2015FERNANDES, T.J. et al. Parameterization effects in nonlinear models to describe growth curves. Acta Scientiarum. Technology, v.37, n.4, p.397-402, 2015. Available from: <Available from: http://dx.doi.org/10.4025/actascitechnol.v37i4.27855
>. Accessed: Aug. 24, 2016.
http://dx.doi.org/10.4025/actascitechnol...
), the following ones should be preferred because they present better behavior in terms of non-linearity:
Logistic

Double Logistic

Gompertz

Double Gompertz

In these expressions: i represents the longitudinal observations i = 1,2, ..., 14; yi is the i-th observation of the average fresh mass of the fruit; xi are the ages, in days after flowering (DAF); a2 is the expected final value for the fresh mass, or weight at maturity; a1 is the maximum fresh mass expected for the first growth stage; k, k1 and k2 correspond to the maturity index of the curves and the higher these indices the less time the berry takes to reach maturity weight; b, b1 and b2 are the abscissa of the inflection points of the respective curves, at this point, the growth rate reaches its maximum and begins to decrease to stabilize; is the random error associated with the model, which assumes that it is independently and identically distributed so that ε~N(0,1σ²).
Estimation of the models’ parameters was performed using the least squares method, which consists of minimizing the sum of the squares of the errors generating the system of normal equations - SNE. Because the SNE is nonlinear, it has no closed form for the solutions and thus they are obtained by iterative algorithms, the best known are: Gauss-Newton, Marquardt and Gradient. We used in this research the iterative method of Gauss-Newton that is implemented in the nls function of the R software.
The quality of fit obtained by the models was evaluated based on the following criteria: Adjusted coefficient of determination (R²aj ), Akaike’s information criterion (AIC), residual standard deviation (RSD) and Likelihood Ratio Test (LRT).
The likelihood ratio test is indicated to compare two hierarchically nested models and the hypotheses in question are:

The test is distributed asymptotically according to a chi-square distribution with ν degrees of freedom, where ν is the difference in the number of parameters between the most complete and the simplest model. However, for small samples (n<120), the F-statistics rather than the chi-square should be used, since the type I error rates are lower considering this approximation (REGAZZI & SILVA, 2004REGAZZI, A.J.; SILVA, C.H.O. Test for parameters equality in nonlinear regression models. Data in the randomized complete design. Revista de Matemática e Estatistica, v.22, n.3, p.33-45, 2004. Available from: <Available from: http://jaguar.fcav.unesp.br/RME/fasciculos/v22/v22_n3/indice_v22_n3.php
>. Accessed: Aug. 24, 2016.
http://jaguar.fcav.unesp.br/RME/fascicul...
). Thus, the test decision criterion will be based on the p-value of the F-test with a significance level of 1%. Therefore, we reject H0 if p-value <0.01, being considered a significant test, that is, the model with more parameters is the correct one.
The computational part of this work, the estimation of the parameters, the achievement of the quality evaluators and the graph construction were done using the R software (R CORE TEAM, 2016R CORE TEAM. R a language and environment for statistical computing. Viena: R Foundation for Statistical Computing, 2016. Available from: <Available from: http://www.r-project.org
>. Accessed: Jun. 21, 2016.
http://www.r-project.org...
).
RESULTS AND DISCUSSION:
The estimates of the quality of fit criteria for the two versions of the Logistic and Gompertz models are presented in table 1.
Estimates of the adjusted coefficient of determination (R²aj ), Akaike’s information criterion (AIC), residual standard deviation (RSD) and p-value of the likelihood ratio test (LRT) for Logistic and Gompertz models in single and double versions in the description of the coffee fruit growth in fresh mass of both faces at the alignment of planting 51º-231º.
The likelihood ratio test was significant (p-value <0.01) in the four situations studied, indicating that the models with six parameters are statistically the most suitable to describe the fresh mass growth of coffee berries over time. In the other criteria presented (Table 1), in both models there is an improvement when comparing the fit of the double sigmoid models with respect to the simple sigmoid. The adjusted coefficient of determination (R²aj
)is above 99%, a decrease occurs in AIC and, especially, in RSD which is reduced to less than half. These results confirm the idea that coffee fruit growth has a double sigmoid growth pattern as commented by CASTRO & MARRACCINI (2006CASTRO, R.D.; MARRACCINI, P. Cytology, biochemistry and molecular changes during coffee fruit development. Brazilian Journal of Plant Physiology, v.18, n.1p.175-199, 2006. Available from: <Available from: http://dx.doi.org/10.1590/S1677-04202006000100013
>. Accessed: Aug. 24, 2016.
http://dx.doi.org/10.1590/S1677-04202006...
) and MORAIS et al. (2008MORAIS, H. et al. Detailed phenological scale of the reproductive phase of Coffea arabica. Bragantia, v.67, n.1, p.693-699, 2008. Available from: <Available from: http://dx.doi.org/10.1590/S0006-87052008000100031
>. Accessed: Aug. 24, 2016.
http://dx.doi.org/10.1590/S0006-87052008...
).
In this sense, the double sigmoid models are the most suitable to describe the growth curve of coffee berries. Table 2 shows the estimates, with their respective standard errors, for the parameters of the Logistic and Gompertz double sigmoid models.
Estimates and standard error for the parameters of the double Logistic and double Gompertz models in the description of the coffee fruit growth in fresh mass of both faces at the alignment of planting 51º-231º.
As commented by BEBBINGTON et al. (2009BEBBINGTON, M. et al. Dynamics and phases of kiwifruit (Actinidia deliciosa) growth curves. New Zealand Journal of Crop and Horticultural Science, v.37, n.3, p.179-188, 2009. Available from: <Available from: http://dx.doi.org/10.1080/01140670909510263
>. Accessed: Aug. 27, 2016.
http://dx.doi.org/10.1080/01140670909510...
), the fruit weight at maturity is information of extreme importance for producers, especially in the case of coffee, because it is marketed according to its weight. The parameter a2
provides this information and its estimates by the double logistic model were 1.06g and 1.04g, while the maximum fresh mass observed by CUNHA & VOLPE (2011CUNHA, A.R.; VOLPE, C.A. Growth curves of coffee fruits ‘Obatã IAC 1669-20’ in different alignments planting. Semina: Ciências Agrárias, v.32, n.1, p.49-62, 2011. Available from: <Available from: http://dx.doi.org/10.5433/1679-0359.2011v32n1p49
>. Accessed: Aug. 24, 2016.
http://dx.doi.org/10.5433/1679-0359.2011...
) was 1.09g and 1.05g for the north and south faces, respectively. It is observed a tendency to underestimate the observed maximum fresh mass, but this is natural since after reaching its maximum fresh weight the fruit dehydrates in the plant and loses mass, passing to dry maturation (CUNHA & VOLPE, 2011CUNHA, A.R.; VOLPE, C.A. Growth curves of coffee fruits ‘Obatã IAC 1669-20’ in different alignments planting. Semina: Ciências Agrárias, v.32, n.1, p.49-62, 2011. Available from: <Available from: http://dx.doi.org/10.5433/1679-0359.2011v32n1p49
>. Accessed: Aug. 24, 2016.
http://dx.doi.org/10.5433/1679-0359.2011...
). As commented by MUIANGA et al. (2016MUIANGA, C.A. et al. Description of the growth curve of cashew fruits in nonlinear models. Revista Brasileira de Fruticultura, v.38, n.1, p.022-032, 2016. Available from: <Available from: http://dx.doi.org/10.1590/0100-2945-295/14
>. Accessed: Aug. 24, 2016.
http://dx.doi.org/10.1590/0100-2945-295/...
), after the fruit reaches the physiological maturity, there is a decrease in the dimensions and water contents and, consequently, loss of fresh mass. Thus, naturally, the fresh weight at maturity (a2
) must be lower than the observed maximum.
The estimates of the parameters b1
and b2
indicate the ages (in days after flowering) in which the fruit reaches the maximum rate of growth in the respective stages. It can be noticed that the estimates for this parameter in the north face are lower than for the south face, in the respective models, suggesting a different growth pattern between the faces of the same plant (Table 2). This suggests that the north face presents an earlier growth curve, reaching the maximum growth sooner. Since this is the face that receives sun for most of the time, these results corroborate with those observed by CUSTÓDIO et al. (2013)CUSTODIO, A.A.P. et al. Coffee productive and vegetative traits characteristics under different deletions of irrigation and side exposure to sun. Coffee Science, v.8, n.4, p.411-422, 2013. Available from: <Available from: https://coffeescience.ufla.br/index.php/Coffeescience/article/view/483/pdf_59
>. Accessed: Aug. 24, 2016.
https://coffeescience.ufla.br/index.php/...
, who verified large differences in productivity between the faces of the plant and also affirmed that the face with greater exposure to the sun presents different maturation with an accelerated process of fruit drying.
Information based on the practical interpretation of the parameters is that in both the double Logistic model and the double Gompertz model, the estimates for parameter k1
are greater than for k2
on both faces (Table 2). This result indicates that the development of the coffee fruit is more accelerated in the first stage of growth (or first sigmoid), a contrary behavior, for example, to peach that has a more remarkable growth in the second stage as observed by SILVA et al. (2013SILVA, D.F.P. et al. Growth curve and respiratory pattern of genotypes of peach fruit in subtropical region. Revista Brasileira de Fruticultura , v.35, n.2, p.642-649, 2013. Available from: <Available from: http://dx.doi.org/10.1590/S0100-29452013000200037
>. Accessed: Aug. 24, 2016.
http://dx.doi.org/10.1590/S0100-29452013...
). This rapid expansion in the first stage of coffee berry development coincides with the rapid growth stage of the phenological scale proposed by authors such as CASTRO & MARRACCINI (2006CASTRO, R.D.; MARRACCINI, P. Cytology, biochemistry and molecular changes during coffee fruit development. Brazilian Journal of Plant Physiology, v.18, n.1p.175-199, 2006. Available from: <Available from: http://dx.doi.org/10.1590/S1677-04202006000100013
>. Accessed: Aug. 24, 2016.
http://dx.doi.org/10.1590/S1677-04202006...
) and NUNES et al. (2010NUNES, F.L. et al. Agrometeorological models to estimate the duration of flowering-maturation stage for three arabica coffee cultivars. Bragantia , v.69, n.4, p.1011-1018, 2010. Available from: <Available from: http://dx.doi.org/10.1590/S0006-87052010000400029
>. Accessed: Aug. 24, 2016.
http://dx.doi.org/10.1590/S0006-87052010...
).
LAVIOLA et al. (2007LAVIOLA, B.G. et al. Nutrient accumulation in coffee fruits at four plantations altitude: calcium, magnesium and sulfur. Revista Brasileira de Ciência do Solo, v.31, n.6, p.1451-1462, 2007. Available from: <Available from: http://dx.doi.org/10.1590/S0100-06832007000600022
>. Accessed: Aug. 24, 2016.
http://dx.doi.org/10.1590/S0100-06832007...
) observed that the maximum rate of dry mass accumulation occurred at 154 DAF in the ‘Catuaí IAC-44’ cultivar, being slightly later than the maximum rate of fresh mass accumulation estimated in this study, which were at 146 DAF and 150 DAF by the double Logistic model and 142 DAF and 145 DAF by the double Gompertz model, for the north and south faces, respectively.
Observing the results of the quality evaluators (Table 1), the fit provided by the two double sigmoid models is similar, with the criteria values very close to each other. However, it should be pointed out that even though they are close to each other, the double logistic presents better results in relation to all the quality criteria used, with a higher value of and lower values of AIC and RSD. Although working with simple sigmoid but using the same quality evaluators, TERRA et al. (2010TERRA, M.F. et al. Fitting logistic and gompertz models to the growth data of dwarf Date palm (Phoenix roebelenii) fruits. Magistra, v.22, n.1, p.1-7, 2010. Available from: <Available from: https://www.ufrb.edu.br/magistra/2000-atual/volume-22-ano-2010/996-numero-1-jan-mar
>. Accessed: Aug. 24, 2016.
https://www.ufrb.edu.br/magistra/2000-at...
), PRADO et al. (2013PRADO, T.K.L. et al. The fit Gompertz and Logístic models to the growth data of green dwarf coconut fruits. Ciência Rural , v.43, n.5, p.803-809, 2013. Available from: <Available from: http://dx.doi.org/10.1590/S0103-84782013005000044
>. Accessed: Aug. 24, 2016.
http://dx.doi.org/10.1590/S0103-84782013...
) and MUIANGA et al. (2016MUIANGA, C.A. et al. Description of the growth curve of cashew fruits in nonlinear models. Revista Brasileira de Fruticultura, v.38, n.1, p.022-032, 2016. Available from: <Available from: http://dx.doi.org/10.1590/0100-2945-295/14
>. Accessed: Aug. 24, 2016.
http://dx.doi.org/10.1590/0100-2945-295/...
) also found very similar results between the Logistic and Gompertz models, with slight superiority of the Logistic model, in the description of the growth of fruit of dwarf-date palm, coconut and cashew, respectively.
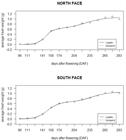
Therefore, the double logistic nonlinear model should be preferred in the description of coffee fruit growth, although the double Gompertz model also presents good results considering the quality evaluators and describing the data well (Figure 1). A small difference is found between the models only at the beginning of the growth, until the 141 DAF, from there the double Logistic and double Gompertz models are practically equal.
CONCLUSION:
The growth pattern of coffee berries, considering the fresh mass accumulated over time, is double sigmoid. The double Logistic and double Gompertz models were suitable to describe the growth pattern of the coffee fruit. All the quality evaluators used indicate a superiority of the double Logistic model, so that this should be preferred in studies on the modeling of the growth curve of this fruit.
REFERENCES:
- BEBBINGTON, M. et al. Dynamics and phases of kiwifruit (Actinidia deliciosa) growth curves. New Zealand Journal of Crop and Horticultural Science, v.37, n.3, p.179-188, 2009. Available from: <Available from: http://dx.doi.org/10.1080/01140670909510263 >. Accessed: Aug. 27, 2016.
» http://dx.doi.org/10.1080/01140670909510263 - CASTRO, R.D.; MARRACCINI, P. Cytology, biochemistry and molecular changes during coffee fruit development. Brazilian Journal of Plant Physiology, v.18, n.1p.175-199, 2006. Available from: <Available from: http://dx.doi.org/10.1590/S1677-04202006000100013 >. Accessed: Aug. 24, 2016.
» http://dx.doi.org/10.1590/S1677-04202006000100013 - CUNHA, A.R.; VOLPE, C.A. Growth curves of coffee fruits ‘Obatã IAC 1669-20’ in different alignments planting. Semina: Ciências Agrárias, v.32, n.1, p.49-62, 2011. Available from: <Available from: http://dx.doi.org/10.5433/1679-0359.2011v32n1p49 >. Accessed: Aug. 24, 2016.
» http://dx.doi.org/10.5433/1679-0359.2011v32n1p49 - CUSTODIO, A.A.P. et al. Coffee productive and vegetative traits characteristics under different deletions of irrigation and side exposure to sun. Coffee Science, v.8, n.4, p.411-422, 2013. Available from: <Available from: https://coffeescience.ufla.br/index.php/Coffeescience/article/view/483/pdf_59 >. Accessed: Aug. 24, 2016.
» https://coffeescience.ufla.br/index.php/Coffeescience/article/view/483/pdf_59 - FAMIANI, F. et al. Development and metabolism of the fruit and seed of the Japanese plum Ozark premier (Rosaceae). Journal of Plant Physiology, v.169, p.551-560, 2012. Available from: <Available from: http://dx.doi.org/10.1016/j.jplph.2011.11.020 >. Accessed: Aug. 24, 2016.
» http://dx.doi.org/10.1016/j.jplph.2011.11.020 - FERNANDES, T.J. et al. Parameterization effects in nonlinear models to describe growth curves. Acta Scientiarum. Technology, v.37, n.4, p.397-402, 2015. Available from: <Available from: http://dx.doi.org/10.4025/actascitechnol.v37i4.27855 >. Accessed: Aug. 24, 2016.
» http://dx.doi.org/10.4025/actascitechnol.v37i4.27855 - FERNANDES, T.J. et al. Selection of nonlinear models for the description of the growth curves of coffee fruit. Coffee Science , v.9, n.2, p.207-215, 2014. Available from: <Available from: https://www.coffeescience.ufla.br/index.php/Coffeescience/article/view/618/pdf_86 >. Accessed: Aug. 24, 2016.
» https://www.coffeescience.ufla.br/index.php/Coffeescience/article/view/618/pdf_86 - LAVIOLA, B.G. et al. Nutrient accumulation in coffee fruits at four plantations altitude: calcium, magnesium and sulfur. Revista Brasileira de Ciência do Solo, v.31, n.6, p.1451-1462, 2007. Available from: <Available from: http://dx.doi.org/10.1590/S0100-06832007000600022 >. Accessed: Aug. 24, 2016.
» http://dx.doi.org/10.1590/S0100-06832007000600022 - LÚCIO A.D. et al. Nonlinear models for estimating cherry tomato yield. Ciência Rural, v.46, n.2, p.233-241, 2016. Available from: <Available from: http://dx.doi.org/10.1590/0103-8478cr20150067 >. Accessed: Aug. 24, 2016.
» http://dx.doi.org/10.1590/0103-8478cr20150067 - MENDES, P.N. et al. Difasics logistic model in the study of the growth of Hereford breed females. Ciência Rural , v.38, n.7, p.1984-1990, 2008. Available from: <http://dx.doi.org/10.1590/S0103-84782008000700029>. Accessed: Aug. 24, 2016.
- MISCHAN, M.M. et al. Inflection and stability points of diphasic logistic analysis of growth. Scientia Agricola, v.72, n.3, p.215-220, 2015. Available from: <http://dx.doi.org/10.1590/0103-9016-2014-0212>. Accessed: Aug. 24, 2016.
- MORAIS, H. et al. Detailed phenological scale of the reproductive phase of Coffea arabica Bragantia, v.67, n.1, p.693-699, 2008. Available from: <Available from: http://dx.doi.org/10.1590/S0006-87052008000100031 >. Accessed: Aug. 24, 2016.
» http://dx.doi.org/10.1590/S0006-87052008000100031 - MUIANGA, C.A. et al. Description of the growth curve of cashew fruits in nonlinear models. Revista Brasileira de Fruticultura, v.38, n.1, p.022-032, 2016. Available from: <Available from: http://dx.doi.org/10.1590/0100-2945-295/14 >. Accessed: Aug. 24, 2016.
» http://dx.doi.org/10.1590/0100-2945-295/14 - NAVA, A.D. et al. Growth kinetics of vegetative and reproductive organs of guava (Psidium guajava L.) in Iguala Guerrero, Mexico. Agricultural Sciences, v.5, p.1468-1475, 2014. Available from: <Available from: http://dx.doi.org/10.4236/as.2014.514157 >. Accessed: Aug. 24, 2016.
» http://dx.doi.org/10.4236/as.2014.514157 - NUNES, F.L. et al. Agrometeorological models to estimate the duration of flowering-maturation stage for three arabica coffee cultivars. Bragantia , v.69, n.4, p.1011-1018, 2010. Available from: <Available from: http://dx.doi.org/10.1590/S0006-87052010000400029 >. Accessed: Aug. 24, 2016.
» http://dx.doi.org/10.1590/S0006-87052010000400029 - PEREIRA, A.A. et al. Description vegetative growth of coffee tree farming ruby mg 1192 using regression models. Coffee Science , v.9, n.2, p.263-271, 2014. Available from: <Available from: https://coffeescience.ufla.br/index.php/Coffeescience/article/view/632/pdf_93 >. Accessed: Aug. 24, 2016.
» https://coffeescience.ufla.br/index.php/Coffeescience/article/view/632/pdf_93 - PRADO, T.K.L. et al. The fit Gompertz and Logístic models to the growth data of green dwarf coconut fruits. Ciência Rural , v.43, n.5, p.803-809, 2013. Available from: <Available from: http://dx.doi.org/10.1590/S0103-84782013005000044 >. Accessed: Aug. 24, 2016.
» http://dx.doi.org/10.1590/S0103-84782013005000044 - R CORE TEAM. R a language and environment for statistical computing. Viena: R Foundation for Statistical Computing, 2016. Available from: <Available from: http://www.r-project.org >. Accessed: Jun. 21, 2016.
» http://www.r-project.org - REGAZZI, A.J.; SILVA, C.H.O. Test for parameters equality in nonlinear regression models. Data in the randomized complete design. Revista de Matemática e Estatistica, v.22, n.3, p.33-45, 2004. Available from: <Available from: http://jaguar.fcav.unesp.br/RME/fasciculos/v22/v22_n3/indice_v22_n3.php >. Accessed: Aug. 24, 2016.
» http://jaguar.fcav.unesp.br/RME/fasciculos/v22/v22_n3/indice_v22_n3.php - SANTORO, K.R. et al. Growth curve parameters for Zebu breeds raised at Pernambuco State, Northeastern Brazil. Revista Brasileira de Zootecnia, v.34, n.6, p.2262-2279, 2005. Available from: <Available from: http://dx.doi.org/10.1590/S1516-35982005000700013 >. Accessed: Aug. 24, 2016.
» http://dx.doi.org/10.1590/S1516-35982005000700013 - SANTOS, M.A. et al. Growth and development of gabiroba Campomanesia adamantium (Cambess.) O. Berg fruits. African Journal of Agricultural Research, v.10, n.14, p.1765-1772, 2015. Available from: <Available from: http://dx.doi.org/10.5897/AJAR2014.8517 >. Accessed: Aug. 24, 2016.
» http://dx.doi.org/10.5897/AJAR2014.8517 - SILVA, D.F.P. et al. Growth curve and respiratory pattern of genotypes of peach fruit in subtropical region. Revista Brasileira de Fruticultura , v.35, n.2, p.642-649, 2013. Available from: <Available from: http://dx.doi.org/10.1590/S0100-29452013000200037 >. Accessed: Aug. 24, 2016.
» http://dx.doi.org/10.1590/S0100-29452013000200037 - SOUSA, I.F. et al. Fitting nonlinear autoregressive models to describe coffee seed germination. Ciência Rural , v.44, p.2016-2021, 2014. Available from: <Available from: http://dx.doi.org/10.1590/0103-8478cr20131341 >. Accessed: Aug. 24, 2016.
» http://dx.doi.org/10.1590/0103-8478cr20131341 - TERRA, M.F. et al. Fitting logistic and gompertz models to the growth data of dwarf Date palm (Phoenix roebelenii) fruits. Magistra, v.22, n.1, p.1-7, 2010. Available from: <Available from: https://www.ufrb.edu.br/magistra/2000-atual/volume-22-ano-2010/996-numero-1-jan-mar >. Accessed: Aug. 24, 2016.
» https://www.ufrb.edu.br/magistra/2000-atual/volume-22-ano-2010/996-numero-1-jan-mar - THOLON, P.; QUEIROZ, S.A. Mathematic models applied to describe growth curves in poultry applied to animal breeding. Ciência Rural , v.39, n.7, p.2261-2269, 2009. Available from: <Available from: http://dx.doi.org/10.1590/S0103-84782009000700050 >. Accessed: Aug. 24, 2016.
» http://dx.doi.org/10.1590/S0103-84782009000700050 - VASQUEZ, J.A. et al. Evaluation of non-linear equations to model different animal growths with mono and bisigmoid profiles. Journal of Theoretical Biology, v.314, p.95-105, 2012. Available from: <Available from: http://dx.doi.org/10.1016/j.jtbi.2012.08.027 >. Accessed: Aug. 24, 2016.
» http://dx.doi.org/10.1016/j.jtbi.2012.08.027
-
0
CR-2016-0646.R1
Publication Dates
-
Publication in this collection
2017
History
-
Received
04 July 2016 -
Accepted
09 May 2017 -
Reviewed
10 June 2017

