ABSTRACT:
The lowland soils are characterized by high susceptibility to water saturation. This anaerobic condition is usually reported in paddy fields and alters the decomposition process of soil organic compounds. The aim of this study was to evaluate the soil microbial and enzymatic activity of a lowland soil at different soil moisture contents. A poorly drained Albaqualf cultivated with irrigated rice was used to evaluate microbial and enzymatic activity in treatments with different levels of soil moisture, being: i) 60% of field capacity (FC) (60%FC); ii) 100% of FC (100%FC); iii) flooded soil with a 2 cm water layer above soil surface, and iv) soil kept at 60%FC with late flood after 29 days the incubation. The greater soil microbial activity was observed in the 100%FC treatment, being 41% greater than 60%FC treatment and only 2% higher than flooded treatment. The enzymatic activity data by fluorescein diacetate (FDA) hydrolysis corroborated the higher CO2 release in treatments with higher soil moisture content. Differently from the results reported, the main methodologies to evaluate microbial activity still recommend maintenance of the soil with a moisture content close to 60% of the FC. However, in lowland soil with history of frequent paddy fields, the maintenance of moisture close to 60% of the FC can limit the microbial activity. The soil respiration technique can be used to evaluate the microbial activity in flooded soil conditions. However, further studies should be conducted to understand the effect of the cultivation history on the microbial community of these environments.
Key words:
flooded rice; enzymatic activity; FDA hydrolysis; soil respiration.
RESUMO:
Os solos de várzea são caracterizados pela alta suscetibilidade à saturação por água. Esta condição anaeróbica é geralmente encontrada em solos arrozeiros e altera o processo de decomposição dos compostos orgânicos do solo. O objetivo deste estudo foi avaliar a atividade microbiana e enzimática de um solo de várzea sob diferentes teores de umidade no solo. Um Planossolo historicamente cultivado com arroz irrigado foi utilizado para avaliar a atividade microbiana e enzimática em tratamentos com diferentes níveis de umidade do solo, sendo: i) 60% de capacidade de campo (CC) (60%CC); ii) 100% da CC (100%CC); iii) solo inundado com uma camada de água de 2 cm acima da superfície do solo; e iv) solo mantido a 60%CC com inundação após 29 dias da incubação. A maior atividade microbiana do solo foi observada no tratamento 100%CC, sendo 41% maior que o tratamento 60%CC e 2% maior que tratamento inundado. Os dados da atividade enzimática pela hidrólise do diacetato de fluoresceína (FDA) corroboraram a maior liberação de CO2 nos tratamentos com maior umidade do solo. Diferentemente dos resultados encontrados, as principais metodologias para avaliação da atividade microbiana ainda recomendam manter o solo com umidade próxima a 60% da CC. No entanto, em solos de várzea com históricos de cultivos de arroz, a manutenção de umidade próxima a 60% da CC pode limitar a atividade microbiana. A técnica de respiração do solo pode ser usada para avaliar a atividade microbiana em condições de solo inundado. No entanto, mais estudos devem ser realizados para entender o efeito do histórico de cultivo na comunidade microbiana nesses ambientes.
Palavras-chave:
solos alagados; atividade enzimática; hidrólise da FDA; respiração do solo
INTRODUCTION:
The lowland soils are characterized by high susceptibility to saturation, due both to their position in the landform and their physical characteristics. Therefore, it possesses water excess on its surface during the growth of annual crops (BRINKMAN & BLOKHUIS, 1986BRINKMAN, R.; BLOKHUIS, W. A. Classification of the soils. In: Wetlands and Rice Production in Sub Saharan Africa. International Institute of Tropical Agriculture, Ibadan, Nigeria, 1986.). Lowlands are estimated to be 4 to 6% of the terrestrial surface, covering an area of 7 to 9 million km² (LEFEUVRE & BOUCHARD, 2002). In Brazil, the majority of this soil is reported in the Southern region, mainly under crops such as flooded rice (SOSBAI, 2016SOSBAI. Irrigated Rice: Technical recommendations of the research for the Southern Brazil. 31 ed., Pelotas: SOSBAI, 2016. 200p.).
In Brazil, many flooded rice soils are anaerobic, have sandy-loam textures, low soil organic matter (SOM), low porosity and low macro/micropore ratio, and deficient soil aggregation (PINTO et al., 2004PINTO, L.F.S. et al. Lowland soils in southern Brazil cultivated with irrigated rice. In: Irrigated Rice in Southern Brazil. Brasília: Embrapa, 2004.). The irrigation system utilized in paddy fields is flooding, with the maintenance of continuous water layer of 10 cm above soil surface for an average period of 90 days (SOSBAI, 2016SOSBAI. Irrigated Rice: Technical recommendations of the research for the Southern Brazil. 31 ed., Pelotas: SOSBAI, 2016. 200p.), which impacts the soil physical, chemical, biological and electrochemical characteristics. After flooded, the molecular oxygen concentration in soil rapidly decreases (PONNAMPERUMA, 1966PONNAMPERUMA, F. N. et al. Influence of redox potential and partial pressure of carbon dioxide on pH values and the suspension effect of flooded soils. Soil Science. v.101, p.421-431; 1966. Available from: <Available from: https://journals.lww.com/soilsci/Citation/1966/06000/INFLUENCE_OF_REDOX_POTENTIAL_AND_PARTIAL_PRESSURE.1.aspx
>. Accessed: Feb. 18, 2018.
https://journals.lww.com/soilsci/Citatio...
). With a lack of oxygen, oxidation processes are predominantly executed by mandatory and facultative anaerobic microorganisms, which reduce both organic (fermentation) and inorganic (anaerobic respiration) oxidized compounds (SOUSA et al., 2015SOUSA, R. O. et al. Flooded soils (REDOX reactions). In: Fundamentals of soil chemistry. Porto Alegre: Evangraf. 2015.). Although, the process of decomposition of SOM is not limited by the flooding, it is impaired, mainly due to lower energy efficiency of microorganisms under anaerobic or hypoxic conditions (REICHARDT et al., 2001REICHARDT, W. T. et al. Microbial population shifts in experimental rice systems. Applied Soil Ecology. v.17, p.151-163; 2001. Available from: <Available from: https://www.sciencedirect.com/science/article/abs/pii/S0929139301001226
>. Accessed: Mar. 18, 2018. doi: 10.1016/S0929-1393(01)00122-6.
https://www.sciencedirect.com/science/ar...
). The SOM decomposition through anaerobic respiration, together with the fermentation processes, is metabolically less efficient and result in partial decomposition of the organic substrate (DUCHAUFOUR, 1998DUCHAUFOUR, P. Handbook of Pedology. Rotterdam, The Netherlands. 1998.).
The analysis of soil microorganism’s metabolic activity through microbial respiration is one of the most utilized forms of indirect evaluation of soil microbial activity. An alternative approach to assess activity is to measure the hydrolysis of fluorescein diacetate (FDA) (KNEDSEN, 2007). The FDA hydrolysis is carried out by several enzymes (lipases, proteases and esterases) present in the microorganisms and, for this reason, has been a simple, sensitive, and rapid method for determining the enzymatic activity; and consequently, the microbial activity in the soil (SCHNUNER & ROSSWALL, 1982). However, most of the studies are restricted to dry soil conditions, disregarding its anaerobic condition, as well as the impact of water saturation on microbial activity. According to FURTAK et al. (2020FURTAK, K. et al. Prevalence of unclassified bacteria in the soil bacterial community from floodplain meadows (fluvisols) under simulated flood conditions revealed by a metataxonomic approaches. Catena. v.188, p.104-448; 2020. Available from: <Available from: https://www.sciencedirect.com/science/article/pii/S0341816219305909
>. Accessed: Sep. 09, 2018. doi: 10.1016/j.catena.2019.104448.
https://www.sciencedirect.com/science/ar...
), not only do the proportions of individual bacteria change, but new species also appear in the soil, while some groups of microorganisms die out after flooding the soil.
From the earliest studies suggesting the methodology of microbial activity (ANDERSON, 1982ANDERSON, J. P. E. Soil Respiration. In: Methods of soil analysis. 2nd edition. Madison: America Society of Agronomy, 1982.; JENKINSON & POWLSON, 1976JENKINSON, D. S.; POWLSON, D. S. The effects of biocidal treatments on metabolism in soil. V. A method for measuring soil biomass. Soil Biology & Biochemistry. v.8, p.209-213; 1976. Available from: <Available from: https://www.sciencedirect.com/science/article/abs/pii/0038071776900055
>. Accessed: Sep. 12, 2018. doi: 10.1016/0038-0717(76)90005-5.
https://www.sciencedirect.com/science/ar...
), to recent studies (SILVA et al., 2007SILVA, E. E. et al. Determination of basal respiration and soil metabolic quotient (qCO2). Seropédica, Embrapa Agrobiologia, 2007. (Comunicado Técnico, 99).), the recommendation is to conduct the assessments with ideal soil moisture content ranging from 60-70% field capacity (FC). Nonetheless, the studies that prove the necessity of utilizing this soil moisture content and the use of this technique with saturated soil conditions are scarce. However, the evaluation of the microbial and enzymatic activity of the lowland soils, which are often flooded by paddy fields, may not represent actual results of these evaluations in this cropping condition. Thus, it is necessary to evaluate the impact of different levels of soil moisture, including flooding soil condition, in the use of these techniques, for a better understanding of the dynamics of the main nutrients associated with SOM mineralization. Thus, the objective of this study was to evaluate the microbial and enzymatic activity of a lowland soil at different soil moisture contents.
MATERIALS AND METHODS:
Site description and historical characterization of the experimental area
The soil used in the current study was collected at Corticeiras farm, located in the Cristal County, Rio Grande do Sul State, Brazil (31º37’13”S, 52º35’20”W, 28 m asl). The regional climate is warm humid summer climate, classified as Cfa, according to Köeppen. The local annual average temperature is 18.3 ºC, and the annual mean rainfall is 1522 mm. The soil is poorly drained classified as Albaqualf (SOIL SURVEY STAFF, 2010), with sandy clay loam texture (24, 23, and 53% of clay, silt and sand, respectively). The experimental area has been cultivated with flooded rice (Oryza sativa L.) followed by fallow since 1960’s. Soil samples were taken for chemical characterization in March 2013. Soil acidity was corrected through lime incorporation (three heavy disks) at rate of 4.5 Mg ha-1 (total neutralization relative power of 70%) to increase 0-20 cm soil layer to pH 6.0, according to CQFS RS/SC (2004).
For the soil chemical characterization, in October 2015 the soil was sampled up to 10 cm soil layer. The pH in water, SOM content (wet combustion), available phosphorus (P) and potassium (K) extracted by Mehlich-1, exchangeable Calcium (Ca) and Magnesium (Mg) extracted by 1.0 mol L-1 KCl, cation exchange capacity at pH 7.0 (CECpH7), and base saturation were analyzed. All analyses were performed following the methodology described by TEDESCO et al. (1995TEDESCO, M. J. et al. Análises de solo, plantas e outros materiais. Porto Alegre: Departamento de Solos, UFRGS. 1995. 174p. (Boletim técnico n. 5).). Results showed a pH in water 5.8; 1.7% of SOM; 4.6 and 1.4 cmolc dm-3 of exchangeable Ca and Mg, respectively; 8.5 and 73.3 mg kg-1 of available P and K, respectively; 10.0 cmolc kg-1 of CECpH7; and 62.3% of base saturation.
Experimental design and treatments
The experimental design was completely randomized with four replications and four treatments. Treatments consisted of four different soil moisture contents: i) traditional method, with 60% of FC (60%FC); ii) soil kept in the FC (100%FC); iii) flooded soil with a 2 cm water layer above soil surface, simulating an paddy field condition and iv) soil kept at 60%FC with late flooding after 29 days the incubation outset, simulating natural conditions of paddy fields, where the rice is sowing in dry soil condition and soil is flooded after a 30 day period.
In September 2017, the soil was collected at depth of 0-20 cm, stored in an expansive polystyrene closed box, in order to keep the temperature and moisture from the time the samples were collected. The soil samples were transported to the laboratory where the soil was disaggregated and sieved in a 2 mm mash, according to Embrapa’s methodology (SILVA et al., 2007SILVA, E. E. et al. Determination of basal respiration and soil metabolic quotient (qCO2). Seropédica, Embrapa Agrobiologia, 2007. (Comunicado Técnico, 99).). An average soil bulk density value of 1.36±0.21 kg dm−3 was determined for the 0-10 cm soil layer, according to TEIXEIRA et al. (2017TEIXEIRA, P. C. et al. Manual de métodos de análise de solo. 3.ed. Brasília, DF. Embrapa, 2017. 574p.). The FC evaluation was performed on a tension table, with the soil sieved in a 2 mm mash; and subsequently, set in volumetric rings. The soil was saturated and pressurized with 10 kPa on the tension table. The soil’s moisture in the FC was established after the balance was reported (REINERT & REICHERT, 2006REINERT, D. J.; REICHERT, J. M. Sand column to measure soil water retention: prototypes and testing. Ciência Rural. v.36, p.1931-1935; 2006. Available from: <Available from: http://www.scielo.br/scielo.php?pid=S0103-84782006000600044&script=sci_abstract
>. Accessed: Jan. 12, 2018. doi: 10.1590/S0103-84782006000600044.
http://www.scielo.br/scielo.php?pid=S010...
) and the soil moisture values found were 0.171 and 0.285 g g-1 at 60 and 100% FC, respectively.
Experiment conduction and performed analyzes
An amount of 100 g of soil with 60% FC moisture was utilized for each treatment, adding water for moisture correction. Then, the soil and a plastic cup containing a 20 mL of NaOH (0,5 mol L-1) solution, were placed in glass container hermetically closed. The soil containers were stored in an incubator, with a temperature varying from 24 to 26 °C, from which they were only removed at the titration of the CO2 sequestering solution plus 1 mL of BaCl2 (35%) with HCl (0.5 mol L-1), as described by SILVA et al. (2007SILVA, E. E. et al. Determination of basal respiration and soil metabolic quotient (qCO2). Seropédica, Embrapa Agrobiologia, 2007. (Comunicado Técnico, 99).). The CO2 assessment in the soil samples for each treatment was evaluated on the days 1, 2, 3, 8, 11, 15, 18, 22, 25, 29, 32, 50 and 64. The results were calculated according to STOTSKY (1965).STOTSKY, G. Microbial respiration. In: Methods of soil analysis: chemical and microbiological properties. Madison: America Society of Agronomy ; 1965.
Regarding the cumulative C-CO2 data, the equation was adjusted using a first-order chemical kinetics model. The software SigmaPlot 12.5 was used to obtain the adjustment parameters of C0 and k, according Fiori et al. (2011FIORI, A. A. et al. Degradability of chelant agent EDTA and EDDS after application on soil. Bragantia. v.70, p.424-431; 2011. Available from: <Available from: http://www.scielo.br/scielo.php?script=sci_arttext&pid=S0006-87052011000200025
>. Accessed: Jun. 08, 2018. doi: 10.1590/S0006-87052011000200025.
http://www.scielo.br/scielo.php?script=s...
). For the half-life (t1/2) carbon degradation calculation, i.e., the time required for 50% of the soil organic carbon (OC) to be released as CO2, the CO2 degradation rate constant (k) was used as described by LATHAM (1974LATHAM, J. L. Elementary reaction kinetics. São Paulo: E. Blücher, 1974. 112p.). After analysis of the microbial activity, the same samples were removed from the flasks and submitted to enzymatic activity, by hydrolysis of FDA. The FDA is a colorless compound which is composed of a fluorescein bound to two acetate radicals. This compound then binds to the enzymes of the microorganisms, such as proteases, lipases and esterases. The reaction product releases fluorescein which is visible and colored (STUBBERFIELD & SHAW, 1990STUBBERFIELD, L. C. F.; SHAW, P. J. A. A comparison of tetrazolium reduction and FDA hydrolysis with other measures of microbial activity. Journal of Microbiological Methods. v.12, p.151-162; 1990. Available from: <Available from: https://www.sciencedirect.com/science/article/pii/0167701290900263
>. Accessed: Feb. 12, 2018. doi: 10.1016/0167-7012(90)90026-3.
https://www.sciencedirect.com/science/ar...
).
A calibration curve was created using standard fluorescein solutions of increasing concentrations in the range of 0 to 5 micrograms per ml. From each glass container, 4 g of soil was collected and added to the centrifuge tube along with 30 ml of phosphate buffer (containing the salts K2HPO4 and KH2PO4) solution at pH 7.6 and 0.4 ml of the FDA solution. The centrifuge contents were stirred for 20 min in the centrifuge. The centrifuge contents were removed from the stirrer, and 0.4 ml of chloroform was mixed to quench the reaction. After this process, the samples were centrifuged at 5,000 rpm for 3 minutes, filtered through a paper filter and the fluorescein determination was performed by spectrophotometry at the wavelength of 490 nm (ADAM & DUNCAN, 2001ADAM, G.; DUNCAN, H. Development of a sensitive and rapid method for the measurement of total microbial activity using fluorescein diacetate (FDA) in a range of soils. Soil Biology & Biochemistry. v.33, p.943-951, 2001. Available from: <Available from: https://www.sciencedirect.com/science/article/abs/pii/S0038071700002443
>. Accessed: Aug. 18, 2018. doi: 10.1016/S0038-0717(00)00244-3.
https://www.sciencedirect.com/science/ar...
).
A soil sample of 0.05 g was used to determine the total soil OC in each treatment in the final incubation phase. The soil OC content was determined by dry combustion in elemental analyzer (Flash EA1112, Thermo Electron Corporation - limit of detection = 0.01%), with methodology proposed by TEDESCO et al. (1995TEDESCO, M. J. et al. Análises de solo, plantas e outros materiais. Porto Alegre: Departamento de Solos, UFRGS. 1995. 174p. (Boletim técnico n. 5).).
Results were submitted to the Shapiro-Wilk test to verify the normality of the data (constant variance, independence and normality of the errors) and to the Levenne’s test, to verify the homogeneity of variances, both being considered assumptions of the analysis of variance (ANOVA). The data was submitted to ANOVA at a significance level of 5%. When significant (P<0.05), the Tukey’s test was used to compare means (P<0.05). Statistical analyses were performed with Sisvar statistical software (FERREIRA, 2011FERREIRA, D. F. Sisvar: a computer statistical analysis system. Ciência e agrotecnologia. v.35, p.1039-1042; 2011. Available from: <Available from: http://www.scielo.br/scielo.php?script=sci_arttext&pid=S1413-70542011000600001
>. Accessed: Mai. 07, 2019. doi: 10.1590/S1413-70542011000600001.
http://www.scielo.br/scielo.php?script=s...
). The adjustment of the degradation kinetics curves and the graphs were plotted from the SigmaPlot® 12.5 program (Systat software, Inc.).
RESULTS:
The soil microbial activity and the mineralization rates of SOM responded to different soil moisture contents at 2, 3, 15, 18, 29, 32, 50, and 64 days after incubation (Figure 1). The moisture contents for the 60%FC and 60%FC + Flooded treatments were similar for the first 22 days. These treatments had similar amounts of CO2 emitted. Of all moisture treatments, the greatest emission of C-CO2 was observed in the 100%FC treatment, with the greatest amount of C-CO2 released until the 32nd day after incubation (Figure 1).

Daily amount of carbon released as CO2 for each evaluation after the incubation of a lowland soil with different moisture contents during the incubation period. The moisture contents were: (i) 60% of field capacity (60%FC); (ii) 100% of field capacity (100%FC); (iii) flooded soil (Flooded); and (iv) evaluations of soil at 60% of the field capacity, and at 22 days after the incubation period with flooded soil (60%CC + Flooded). Vertical bars represent the least significant difference (LSD), according to the Tukey test. (*): Significant difference between at least two treatments (P<0.05).
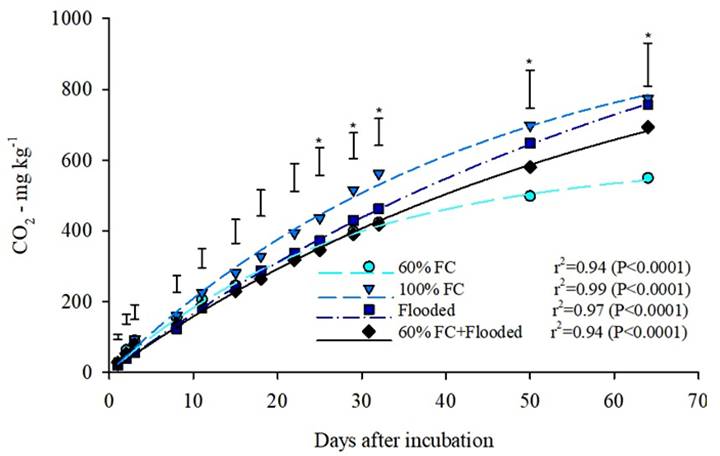
Differences were observed between the 60%FC and 100%FC treatments, with CO2 emissions being 41% higher in the 100%FC than the 60%FC treatment (Figure 2). The 100%FC showed a total of 774 mg CO2 kg soil-1. This value is 2% higher than the Flooded treatment and 12% higher than the 60%FC + Flooded treatment. The curves behavior demonstrated the potential of the mineralizable OC influenced by the moisture content. At 64 days, the 60%FC treatment indicated a tendency of stagnation, whereas, the 100%FC and Flooded treatments, tend to increase their release of CO2 gradually (Figure 2).

Accumulated carbon in a period of 64 days, released from a lowland soil as CO2, with different soil moisture contents during the incubation period. The moisture contents were: (i) 60% of field capacity (60%FC); (ii) 100% of field capacity (100%FC); (iii) flooded soil (Flooded); and (iv) evaluations of soil at 60% of the field capacity, and at 22 days after the incubation period with flooded soil (60%CC + Flooded). Vertical bars represent the least significant difference (LSD), according to the Tukey test. (*): Significant difference between at least two treatments (P<0.05).
The parameters evaluated from the equation composed with the values of released CO2 reiterate the difference among the treatments (Table 1). The 60%FC treatment had the lowest potentially mineralizable C (C0) value. The 60%FC treatment also differed from the others in the rate of degradation of OC (K). This treatment demonstrated a greater rate of degradation in comparison with the other treatments. The half-life (t1/2) of the OC in the flooded treatments (Flooded and 60%FC + Flooded) was greater than the remaining non-flooded treatments, showing the slower decomposition of OC in flooded environments. Differences among the treatments regarding the amount of CO2 released were not enough to distinguish the total soil OC contents after the incubation period (Figure 3a), because the soil OC results did not differ significantly (P>0.05).

Soil organic carbon content (a) and enzymatic activity measured by the hydrolysis of fluorescein diacetate (FDA) (b) after 64 days of incubation of a lowland soil submitted to different moisture contents. Different letters indicate a significant difference between treatments according to the Tukey test, at a significance level of 5%. ns = not significant.
Differences in the enzymatic activity by FDA hydrolysis (Figure 3b) corroborate the higher CO2 release in the treatments with higher soil moisture content (100%FC, Flooded and 60%FC + Flooded). The Flooded treatment showed the highest enzymatic activity. The 60%FC presented the lowest enzymatic activity (Figure 3b). The values of enzymatic activity obtained in the present experiment showed a highly significant correlation (P<0.001) with those obtained in the microbial activity by evaluation of CO2, with a coefficient of determination of 75%.
DISCUSSION:
A Microbial activity assessment by the evaluation of the SOM mineralization is well-established and widely used technique that has an extensive history of use for aerobic systems (ANDERSON, 2003ANDERSON, T. H. Microbial eco-physiological indicators to assess soil quality. Agriculture, Ecosystems and Environment. v.98, p.285-293; 2003. Available from: <Available from: https://www.sciencedirect.com/science/article/abs/pii/S0167880903000884
>. Accessed: Aug. 08, 2018. doi: 10.1016/S0167-8809(03)00088-4.
https://www.sciencedirect.com/science/ar...
). Soil moisture content is considered a factor of extreme importance in the execution of this technique. It has been the focus of several former studies related to this methodology (KOWALENKO et al., 1978KOWALENKO, C. G.; IVARSON, K. C. Effect of moisture content, temperature and nitrogen fertilization on carbon dioxide evolution from field soils. Soil Biology & Biochemistry. v.10, p.417-423; 1978. Available from: <Available from: https://www.sciencedirect.com/science/article/abs/pii/0038071778900688
>. Accessed: Jun. 08, 2018. doi: 10.1016/0038-0717(78)90068-8.
https://www.sciencedirect.com/science/ar...
; ORCHARD & COOK, 1983ORCHARD, V. A.; COOK, F. Relationship between soil respiration and soil moisture. Soil Biology & Biochemistry. v.15, p.447-453; 1983. Available from: <Available from: https://www.sciencedirect.com/science/article/abs/pii/003807178390010X
>. Accessed: Jan. 20, 2018. doi: 10.1016/0038-0717(83)90010-X.
https://www.sciencedirect.com/science/ar...
), it is a frequent subject of research (LINN & DORAN, 1984LINN, D. M.; DORAN, J. W. Effect of water-filled pore space on carbon dioxide and nitrous oxide production in tilled and nontilled soils. Soil Science Society of America Journal. v.48, p.1267-1272; 1984. Available from: <Available from: https://pubag.nal.usda.gov/catalog/16745
>. Accessed: Jan. 22, 2018. doi: 10.2136/sssaj1984.03615995004800060013x.
https://pubag.nal.usda.gov/catalog/16745...
; JIA et al., 2006JIA. B. et al. Effects of temperature and soil water-content on soil respiration of grazed and ungrazed Leymus chinensis steppes, Inner Mongolia. Journal of Arid Environments. v.67, p.60-76; 2006. Available from: <Available from: https://www.sciencedirect.com/science/article/abs/pii/S0140196306000528
>. Accessed: set. 08, 2018. doi: 10.1016/j.jaridenv.2006.02.002.
https://www.sciencedirect.com/science/ar...
; COOK & ORCHARD, 2008COOK, F. J.; ORCHARD, V. A. Relationships between soil respiration and soil moisture. Soil Biology & Biochemistry. v.40, p.1013-1018; 2008. Available from: <Available from: https://www.sciencedirect.com/science/article/abs/pii/S0038071707004920
>. Accessed: Nov. 07, 2018. doi: 10.1016/j.soilbio.2007.12.012.
https://www.sciencedirect.com/science/ar...
) due to the relation of soil moisture with the microbial activity. ORCHARD & COOK (1983)ORCHARD, V. A.; COOK, F. Relationship between soil respiration and soil moisture. Soil Biology & Biochemistry. v.15, p.447-453; 1983. Available from: <Available from: https://www.sciencedirect.com/science/article/abs/pii/003807178390010X
>. Accessed: Jan. 20, 2018. doi: 10.1016/0038-0717(83)90010-X.
https://www.sciencedirect.com/science/ar...
related the microbial activity with the matric potential of water in the soil and verified a negative linear relation. That is, the lower the potential, the lower the microbial activity in the soil. In soil condition with matric potentials around -10 kPa (consistent with the FC for most tropical soils), the microbial activity can be considered maximum (ORCHARD & COOK, 1983ORCHARD, V. A.; COOK, F. Relationship between soil respiration and soil moisture. Soil Biology & Biochemistry. v.15, p.447-453; 1983. Available from: <Available from: https://www.sciencedirect.com/science/article/abs/pii/003807178390010X
>. Accessed: Jan. 20, 2018. doi: 10.1016/0038-0717(83)90010-X.
https://www.sciencedirect.com/science/ar...
).
The effect of the water content in the soil has been described by several authors. Equations such as linear, logarithmic and quadratic functions of the soil were utilized to explain the effect of the water content in the soil. These equations were expressed through matrix potential, gravimetric and/or volumetric of the water content, filled pore space by water, precipitation indexes, etc. (ORCHARD & COOK, 1983ORCHARD, V. A.; COOK, F. Relationship between soil respiration and soil moisture. Soil Biology & Biochemistry. v.15, p.447-453; 1983. Available from: <Available from: https://www.sciencedirect.com/science/article/abs/pii/003807178390010X
>. Accessed: Jan. 20, 2018. doi: 10.1016/0038-0717(83)90010-X.
https://www.sciencedirect.com/science/ar...
; WILDUNG et al., 1975WILDUNG, R. E. et al. The interdependent effects of soil temperature and water content on soil respiration rate and plant root decomposition in arid grassland soils. Soil Biology & Biochemistry. v.7, p.373-378; 1975. Available from: <Available from: https://www.sciencedirect.com/science/article/abs/pii/0038071775900528
>. Accessed: Feb. 12, 2018. doi: 10.1016/0038-0717(75)90052-8.
https://www.sciencedirect.com/science/ar...
; HOWARD & HOWARD, 1993HOWARD, D. M.; HOWARD, P. J. A. Relationships between CO2 evolution, moisture content and temperature for a range of soil types. Soil Biology & Biochemistry. v.25, p.1546-1537; 1993. Available from: <Available from: https://www.sciencedirect.com/science/article/abs/pii/003807179390008Y
>. Accessed: Dec. 08, 2018. doi: 10.1016/0038-0717(93)90008-Y.
https://www.sciencedirect.com/science/ar...
; DORAN et al., 1991DORAN, J. W.; MIELKE, I. N. Microbial activity as regulated by soil water-filled pore space. In: Ecology of Soil Microorganisms in the Microhabital Environments, 1991.; RAICH & POTTER, 1995RAICH, J. W.; POTTER, C. S. Global patterns of carbon dioxide emissions from soils. Global Biogeochemical Cycles. v.9, p.23-36; 1995. Available from: <Available from: https://agupubs.onlinelibrary.wiley.com/doi/10.1029/94GB02723
>. Accessed: Feb. 18, 2018. doi: 10.1029/94GB02723.
https://agupubs.onlinelibrary.wiley.com/...
; HANSON et al., 1993HANSON, P. J. et al. Seasonal and topographic patterns of forest floor CO2 efflux from an upland oak forest. Tree Physiology. v.13, p.1-15; 1993. Available from: <Available from: https://academic.oup.com/treephys/article-abstract/13/1/1/1654493
>. Accessed: Jan. 10, 2018. doi: 10.1093/treephys/13.1.1.
https://academic.oup.com/treephys/articl...
; OBERBAUER et al., 1992OBERBAUER, S. F. et al. Environmental effects on CO2 efflux from riparian tundra in the northern foothills of the Brooks Range, Alaska, U.S.A. Oecologia. v.92, p.568-577; 1992. Available from: <Available from: https://link.springer.com/article/10.1007/BF00317851
>. Accessed: Feb. 12, 2018. doi: 10.1007/BF00317851.
https://link.springer.com/article/10.100...
; SCHLENTNER & VAN CLEVE, 1985SCHLENTNER, R. E.; VAN CLEVE, K. Relationships between CO2 evolution from soil, substrate temperature, and substrate moisture in four mature forest types in interior Alaska. Canadian Journal of Forest Research. v.15, p.97-106; 1985. Available from: <Available from: https://www.nrcresearchpress.com/doi/10.1139/x85-018#.XoJc1YhKg2w
>. Accessed: Feb. 12, 2018. doi: 10.1139/x85-018.
https://www.nrcresearchpress.com/doi/10....
). Convergently, most of these studies recognized an “optimum” soil water content in which microbial activity is potentiated, with its reduction with values below or above. This is due to the fact that the aerobic microbial activity increases with soil water content until a point is reached where water displaces air and restricts the diffusion and availability of oxygen.
Results reported in this study support these several authors. The soil maintained in FC (100%FC) presented the highest accumulated CO2 (Figure 2) and enzymatic activity greater than the 60%FC treatment (Figure 3b). Enzymatic activity strongly depended on microbial activity because microorganisms produced enzymes depending on resource supply and demand (NANNIPIERI et al., 2012NANNIPIERI, P. et al. Soil enzymology: classical and molecular approaches. Biology and fertility of soils. v.48, p.743-762; 2012. Available from: <Available from: https://link.springer.com/article/10.1007/s00374-012-0723-0
>. Accessed: Aug. 12, 2018. doi: 10.1007/s00374-012-0723-0.
https://link.springer.com/article/10.100...
; WEI et al., 2019aWEI, X. et al. C/P stoichiometry of dying rice root defines the spatial distribution and dynamics of enzyme activities in root-detritusphere. Biology and fertility of soils. v.55, p.251-263; 2019a. Available from: <Available from: https://link.springer.com/article/10.1007/s00374-019-01345-y
>. Accessed: Feb. 02, 2020. doi: 10.1007/s00374-019-01345-y.
https://link.springer.com/article/10.100...
). Especially considering the enzymatic activity measured by the FDA hydrolysis, the soil moisture condition at the time of incubation does not influenced the results (DICK, 2011DICK, R. P. Methods of soil enzymology. Madison, WI: Soil Science Society of America. 2011.). Therefore, the higher enzymatic activity reported in treatments with higher moisture contents (Flooded and 100% FC) results from the greater biological activity in the whole incubation process. Due to the high correlation between microbial activity and the FDA hydrolysis analysis (R2 = 75%), this technique can be used to predict soil microbial activity in response to different management practices (GREEN et al., 2006GREEN, V. S. et al. Assay for fluorescein diacetate hydrolytic activity: Optimization for soil samples. Soil Biology and Biochemistry. v.38, p.693-701; 2006. Available from: <Available from: https://www.sciencedirect.com/science/article/abs/pii/S0038071705002786
>. Accessed: Jul. 26, 2018. doi: 10.1016/j.soilbio.2005.06.020.
https://www.sciencedirect.com/science/ar...
; SILVA et al., 2004SILVA, M. et al. Flurescein diacetate hydrolysis as a bioindicator of microbial activity in soil under reforestation. Ciência Rural. v.34, p.1493-1496; 2004. Available from: <Available from: http://www.scielo.br/scielo.php?pid=S0103-84782004000500025&script=sci_abstract
>. Accessed: Jan. 12, 2018. doi: 10.1590/S0103-84782004000500025.
http://www.scielo.br/scielo.php?pid=S010...
). The use of this analysis is faster and more practical, and besides the evaluation of the OC dynamics, it also indicated the availability of mineral forms of essential nutritional elements of plants, such as NH4
+, H2PO4
-, and SO4
2-.
However, different from the results reported, the main methodologies for evaluating microbial activity (SILVA et al., 2007SILVA, E. E. et al. Determination of basal respiration and soil metabolic quotient (qCO2). Seropédica, Embrapa Agrobiologia, 2007. (Comunicado Técnico, 99).) still recommend maintaining the soil with a moisture content close to 60% of the FC. As verified in the present study data, in lowland soils, with history of frequent paddy fields, maintaining the moisture close to 60% of the FC may limit the microbial activity and cause the results among evaluated treatments to be imprecise.
LINN & DORAN (1984LINN, D. M.; DORAN, J. W. Effect of water-filled pore space on carbon dioxide and nitrous oxide production in tilled and nontilled soils. Soil Science Society of America Journal. v.48, p.1267-1272; 1984. Available from: <Available from: https://pubag.nal.usda.gov/catalog/16745
>. Accessed: Jan. 22, 2018. doi: 10.2136/sssaj1984.03615995004800060013x.
https://pubag.nal.usda.gov/catalog/16745...
) elucidated the main mechanisms involved in this dynamic. The reduction of the O2 diffusion by the porous space in the soil produces the condition of water excess. Contrastingly, there is a restriction of substrates in the water films of drier soils. In aerobic respiration, O2 is required and organic substrates are utilized as energy source for microorganisms. Thus, the ideal soil moisture content of water is close to the FC, where a large part of the macropores are filled by air, facilitating the diffusion of O2 and the micropores are filled with water, facilitating the diffusion of soluble substrates (DAVIDSON et al., 2000DAVIDSON, E. A. et al. Effects of soil water content on soil respiration in forests and cattle pastures of eastern Amazonia. Biogeochemistry. v.48, p.53-69; 2000. Available from: <Available from: https://link.springer.com/article/10.1023/A:1006204113917
>. Accessed: Aug. 18, 2018. doi: 10.1023/A:1006204113917.
https://link.springer.com/article/10.102...
). Although, the results of many studies, involving a wide range of soil types, indicated that a soil water content equivalent to 60% of a soil’s water-holding capacity delineated the point of maximum aerobic microbial activity, possibly in sandy soils, such as the one used in the present study, which have a lower amount of micropores and total porosity, the soil maintained at 100% FC can favor the maximum microbial activity, without presenting a risk of underestimation due to a water deficiency (Figure 2 and 3b).
Rates of decomposition of added organic materials as well as of SOM are considered to be slower under anaerobic than under aerobic conditions (KÖGEL-KNABNER et al., 2010KÖGEL-KNABNER, I. et al. Biogeochemistry of paddy soils. Geoderma. v.157, p.1-14; 2010. Available from: <Available from: https://www.sciencedirect.com/science/article/pii/S0016706110000868
>. Accessed: Sep. 12, 2018. doi: 10.1016/j.geoderma.2010.03.009.
https://www.sciencedirect.com/science/ar...
). It is known that flooding favors the reduction of microbial biomass due to the lower participation of aerobic, gram positive and negative bacteria and mycorrhizal fungi (UNGER et al., 2009UNGER, I. M. et al. Flooding effects on soil microbial communities. Applied Soil Ecology. v.42, p.1-8; 2009. Available from: <Available from: https://www.sciencedirect.com/science/article/abs/pii/S0929139309000079
>. Accessed: Nov. 20, 2018. doi: 10.1016/j.apsoil.2009.01.007.
https://www.sciencedirect.com/science/ar...
). Some authors argue that there is less competitive advantage of microorganisms in flooded soil conditions (HOLLAND & COLEMAN, 1987HOLLAND, E. A.; COLEMAN, D. C. Litter placement effects on microbial and organic matter dynamics in an agroecosystem. Ecology. v.68, p.425-433; 1987. Available from: <Available from: https://www.jstor.org/stable/1939274?seq=1#metadata_info_tab_contents
>. Accessed: Jan. 08, 2018. doi: 10.2307/1939274.
https://www.jstor.org/stable/1939274?seq...
). They reported that the SOM mineralization through anaerobic respiration together with fermentation processes, are metabolically less efficient (DUCHAUFOUR, 1998DUCHAUFOUR, P. Handbook of Pedology. Rotterdam, The Netherlands. 1998.).
Conversely, there are studies showing greater microbial activity of the soil under flooding. Due to the increase in metabolic activity, FURTAK et al. (2020FURTAK, K. et al. Prevalence of unclassified bacteria in the soil bacterial community from floodplain meadows (fluvisols) under simulated flood conditions revealed by a metataxonomic approaches. Catena. v.188, p.104-448; 2020. Available from: <Available from: https://www.sciencedirect.com/science/article/pii/S0341816219305909
>. Accessed: Sep. 09, 2018. doi: 10.1016/j.catena.2019.104448.
https://www.sciencedirect.com/science/ar...
) suggested that in soils flooded with water the structural diversity of the soil microbiome is greater than before the flooding. Likewise, WILSON et al. (2011WILSON, J. S. et al. The effects of short-term flooding on carbon dynamics, microbial community structure and microbial activity in floodplain soil. River Research and Applications. v.27, p.213-225; 2011. Available from: <Available from: https://onlinelibrary.wiley.com/doi/abs/10.1002/rra.1352
>. Accessed: Feb. 12, 2018. doi: 10.1002/rra.1352.
https://onlinelibrary.wiley.com/doi/abs/...
) also reported different results in a study evaluating the short-term effect of flooding on OC dynamics, community structure and microbial activity. It was observed that soil flooding induced significant modifications in the microbial community, potentiating respiration rates and degradation of enzymes, and increasing fractions of labile C in the soil. Accordingly, microbial activity in anaerobic paddy field is enhanced by the input of labile C forms (WEI et al., 2019bWEI, L. et al. Labile carbon matters more than temperature for enzyme activity in paddy soil. Soil Biology & Biochemistry. v.135, p.134-143; 2019b. Available from: <Available from: https://www.sciencedirect.com/science/article/abs/pii/S0038071719301300
>. Accessed: Feb. 02, 2020. doi: 10.1016/j.soilbio.2019.04.016.
https://www.sciencedirect.com/science/ar...
). These results may explain why the flooded treatment presented higher microbial and enzymatic activity than 60% FC (Figures 2 and 3b) in lowland soil with a history of flooding for paddy fields.
The importance of plants in the system has been increasingly verified, being able to alter and select the microbial community (SCHENK et al., 2012SCHENK, P. M. et al. Unraveling plant-microbe interactions: Can multi-species transcriptomics help? Trends Biotechnology. v.30, p.177-184; 2012. Available from: <Available from: https://www.sciencedirect.com/science/article/abs/pii/S0167779911001922
>. Accessed: Feb. 18, 2018. doi: 10.1016/j.tibtech.2011.11.002.
https://www.sciencedirect.com/science/ar...
). Therefore, studies in paddy fields where historically there is an annual cultivation of this crop with the same input of residues, and same flooded condition are substantially significant, since this management history may have selected and increased the number of organisms capable of performing anaerobic activity on the soil surface. This may be a key factor in the study of the dynamics of microbial communities and their relationships with anthropogenic actions. In order to quantify the effect of soil moisture and to better understand its relationship with SOM mineralization and the processes involved in the soil/plant interface, more studies should be carried out in flooded environments, especially considering the cultivation history.
CONCLUSION:
Lowland soils under hydromorphic conditions, with a history of flooding for paddy fields, maintained in the field capacity or under flood conditions, presented greater microbial and enzymatic activity of the soil when compared to a soil moisture condition of 60% of field capacity. The moisture content conventionally recommended in the respirometry methodology (60% of the field capacity), limits the microbial activity of a lowland soil with a history of flooding for paddy fields, when compared to higher soil moisture contents.
The soil respiration technique can be utilized to evaluate the microbial activity in flooded soil conditions, and it can be a relevant tool to perform experiments simulating more actual conditions of paddy fields. However, further studies should be conducted to understand the effect of the cultivation history on the microbial community and activity of these environments.
ACKNOWLEDGEMENTS
This research was carried out with support financed by Fundação Agrisus (Project no. PA 2337/18). We thank this foundation, which always supports research aimed at sustainable intensification of Brazilian agricultural production; Conselho Nacional de Desenvolvimento Científico e Tecnológico (CNPq); and Coordenação de Aperfeiçoamento de Pessoal de Nível Superior (CAPES) for scholarship support; the staff of Corticeiras Farm for field support; and Tainá Bartmann for support in translating and correcting English.
REFERENCES
- ADAM, G.; DUNCAN, H. Development of a sensitive and rapid method for the measurement of total microbial activity using fluorescein diacetate (FDA) in a range of soils. Soil Biology & Biochemistry. v.33, p.943-951, 2001. Available from: <Available from: https://www.sciencedirect.com/science/article/abs/pii/S0038071700002443 >. Accessed: Aug. 18, 2018. doi: 10.1016/S0038-0717(00)00244-3.
» https://doi.org/10.1016/S0038-0717(00)00244-3.» https://www.sciencedirect.com/science/article/abs/pii/S0038071700002443 - ANDERSON, J. P. E. Soil Respiration. In: Methods of soil analysis. 2nd edition. Madison: America Society of Agronomy, 1982.
- ANDERSON, T. H. Microbial eco-physiological indicators to assess soil quality. Agriculture, Ecosystems and Environment. v.98, p.285-293; 2003. Available from: <Available from: https://www.sciencedirect.com/science/article/abs/pii/S0167880903000884 >. Accessed: Aug. 08, 2018. doi: 10.1016/S0167-8809(03)00088-4.
» https://doi.org/10.1016/S0167-8809(03)00088-4.» https://www.sciencedirect.com/science/article/abs/pii/S0167880903000884 - BRINKMAN, R.; BLOKHUIS, W. A. Classification of the soils. In: Wetlands and Rice Production in Sub Saharan Africa. International Institute of Tropical Agriculture, Ibadan, Nigeria, 1986.
- COOK, F. J.; ORCHARD, V. A. Relationships between soil respiration and soil moisture. Soil Biology & Biochemistry. v.40, p.1013-1018; 2008. Available from: <Available from: https://www.sciencedirect.com/science/article/abs/pii/S0038071707004920 >. Accessed: Nov. 07, 2018. doi: 10.1016/j.soilbio.2007.12.012.
» https://doi.org/10.1016/j.soilbio.2007.12.012.» https://www.sciencedirect.com/science/article/abs/pii/S0038071707004920 - DAVIDSON, E. A. et al. Effects of soil water content on soil respiration in forests and cattle pastures of eastern Amazonia. Biogeochemistry. v.48, p.53-69; 2000. Available from: <Available from: https://link.springer.com/article/10.1023/A:1006204113917 >. Accessed: Aug. 18, 2018. doi: 10.1023/A:1006204113917.
» https://doi.org/10.1023/A:1006204113917.» https://link.springer.com/article/10.1023/A:1006204113917 - DICK, R. P. Methods of soil enzymology. Madison, WI: Soil Science Society of America. 2011.
- DORAN, J. W.; MIELKE, I. N. Microbial activity as regulated by soil water-filled pore space. In: Ecology of Soil Microorganisms in the Microhabital Environments, 1991.
- DUCHAUFOUR, P. Handbook of Pedology. Rotterdam, The Netherlands. 1998.
- FERREIRA, D. F. Sisvar: a computer statistical analysis system. Ciência e agrotecnologia. v.35, p.1039-1042; 2011. Available from: <Available from: http://www.scielo.br/scielo.php?script=sci_arttext&pid=S1413-70542011000600001 >. Accessed: Mai. 07, 2019. doi: 10.1590/S1413-70542011000600001.
» https://doi.org/10.1590/S1413-70542011000600001.» http://www.scielo.br/scielo.php?script=sci_arttext&pid=S1413-70542011000600001 - FIORI, A. A. et al. Degradability of chelant agent EDTA and EDDS after application on soil. Bragantia. v.70, p.424-431; 2011. Available from: <Available from: http://www.scielo.br/scielo.php?script=sci_arttext&pid=S0006-87052011000200025 >. Accessed: Jun. 08, 2018. doi: 10.1590/S0006-87052011000200025.
» https://doi.org/10.1590/S0006-87052011000200025» http://www.scielo.br/scielo.php?script=sci_arttext&pid=S0006-87052011000200025 - FURTAK, K. et al. Prevalence of unclassified bacteria in the soil bacterial community from floodplain meadows (fluvisols) under simulated flood conditions revealed by a metataxonomic approaches. Catena. v.188, p.104-448; 2020. Available from: <Available from: https://www.sciencedirect.com/science/article/pii/S0341816219305909 >. Accessed: Sep. 09, 2018. doi: 10.1016/j.catena.2019.104448.
» https://doi.org/10.1016/j.catena.2019.104448.» https://www.sciencedirect.com/science/article/pii/S0341816219305909 - GREEN, V. S. et al. Assay for fluorescein diacetate hydrolytic activity: Optimization for soil samples. Soil Biology and Biochemistry. v.38, p.693-701; 2006. Available from: <Available from: https://www.sciencedirect.com/science/article/abs/pii/S0038071705002786 >. Accessed: Jul. 26, 2018. doi: 10.1016/j.soilbio.2005.06.020.
» https://doi.org/10.1016/j.soilbio.2005.06.020.» https://www.sciencedirect.com/science/article/abs/pii/S0038071705002786 - HANSON, P. J. et al. Seasonal and topographic patterns of forest floor CO2 efflux from an upland oak forest. Tree Physiology. v.13, p.1-15; 1993. Available from: <Available from: https://academic.oup.com/treephys/article-abstract/13/1/1/1654493 >. Accessed: Jan. 10, 2018. doi: 10.1093/treephys/13.1.1.
» https://doi.org/10.1093/treephys/13.1.1.» https://academic.oup.com/treephys/article-abstract/13/1/1/1654493 - HOLLAND, E. A.; COLEMAN, D. C. Litter placement effects on microbial and organic matter dynamics in an agroecosystem. Ecology. v.68, p.425-433; 1987. Available from: <Available from: https://www.jstor.org/stable/1939274?seq=1#metadata_info_tab_contents >. Accessed: Jan. 08, 2018. doi: 10.2307/1939274.
» https://doi.org/10.2307/1939274.» https://www.jstor.org/stable/1939274?seq=1#metadata_info_tab_contents - HOWARD, D. M.; HOWARD, P. J. A. Relationships between CO2 evolution, moisture content and temperature for a range of soil types. Soil Biology & Biochemistry. v.25, p.1546-1537; 1993. Available from: <Available from: https://www.sciencedirect.com/science/article/abs/pii/003807179390008Y >. Accessed: Dec. 08, 2018. doi: 10.1016/0038-0717(93)90008-Y.
» https://doi.org/10.1016/0038-0717(93)90008-Y.» https://www.sciencedirect.com/science/article/abs/pii/003807179390008Y - JENKINSON, D. S.; POWLSON, D. S. The effects of biocidal treatments on metabolism in soil. V. A method for measuring soil biomass. Soil Biology & Biochemistry. v.8, p.209-213; 1976. Available from: <Available from: https://www.sciencedirect.com/science/article/abs/pii/0038071776900055 >. Accessed: Sep. 12, 2018. doi: 10.1016/0038-0717(76)90005-5.
» https://doi.org/10.1016/0038-0717(76)90005-5.» https://www.sciencedirect.com/science/article/abs/pii/0038071776900055 - JIA. B. et al. Effects of temperature and soil water-content on soil respiration of grazed and ungrazed Leymus chinensis steppes, Inner Mongolia. Journal of Arid Environments. v.67, p.60-76; 2006. Available from: <Available from: https://www.sciencedirect.com/science/article/abs/pii/S0140196306000528 >. Accessed: set. 08, 2018. doi: 10.1016/j.jaridenv.2006.02.002.
» https://doi.org/10.1016/j.jaridenv.2006.02.002.» https://www.sciencedirect.com/science/article/abs/pii/S0140196306000528 - KNUDSEN, G. R. Quantifying the Metabolic Activity of Soil- and Plant-Associated Microbes. In: Manual of Environmental Microbiology, Third Edition. 2007.
- KÖGEL-KNABNER, I. et al. Biogeochemistry of paddy soils. Geoderma. v.157, p.1-14; 2010. Available from: <Available from: https://www.sciencedirect.com/science/article/pii/S0016706110000868 >. Accessed: Sep. 12, 2018. doi: 10.1016/j.geoderma.2010.03.009.
» https://doi.org/10.1016/j.geoderma.2010.03.009.» https://www.sciencedirect.com/science/article/pii/S0016706110000868 - KOWALENKO, C. G.; IVARSON, K. C. Effect of moisture content, temperature and nitrogen fertilization on carbon dioxide evolution from field soils. Soil Biology & Biochemistry. v.10, p.417-423; 1978. Available from: <Available from: https://www.sciencedirect.com/science/article/abs/pii/0038071778900688 >. Accessed: Jun. 08, 2018. doi: 10.1016/0038-0717(78)90068-8.
» https://doi.org/10.1016/0038-0717(78)90068-8.» https://www.sciencedirect.com/science/article/abs/pii/0038071778900688 - LATHAM, J. L. Elementary reaction kinetics. São Paulo: E. Blücher, 1974. 112p.
- LEFREUVRE, J. C.; BOUCHARD, V. Wetlands and biodiversity. In “Encyclopedia of Soil Science”. 2002.
- LINN, D. M.; DORAN, J. W. Effect of water-filled pore space on carbon dioxide and nitrous oxide production in tilled and nontilled soils. Soil Science Society of America Journal. v.48, p.1267-1272; 1984. Available from: <Available from: https://pubag.nal.usda.gov/catalog/16745 >. Accessed: Jan. 22, 2018. doi: 10.2136/sssaj1984.03615995004800060013x.
» https://doi.org/10.2136/sssaj1984.03615995004800060013x.» https://pubag.nal.usda.gov/catalog/16745 - NANNIPIERI, P. et al. Soil enzymology: classical and molecular approaches. Biology and fertility of soils. v.48, p.743-762; 2012. Available from: <Available from: https://link.springer.com/article/10.1007/s00374-012-0723-0 >. Accessed: Aug. 12, 2018. doi: 10.1007/s00374-012-0723-0.
» https://doi.org/10.1007/s00374-012-0723-0.» https://link.springer.com/article/10.1007/s00374-012-0723-0 - OBERBAUER, S. F. et al. Environmental effects on CO2 efflux from riparian tundra in the northern foothills of the Brooks Range, Alaska, U.S.A. Oecologia. v.92, p.568-577; 1992. Available from: <Available from: https://link.springer.com/article/10.1007/BF00317851 >. Accessed: Feb. 12, 2018. doi: 10.1007/BF00317851.
» https://doi.org/10.1007/BF00317851.» https://link.springer.com/article/10.1007/BF00317851 - ORCHARD, V. A.; COOK, F. Relationship between soil respiration and soil moisture. Soil Biology & Biochemistry. v.15, p.447-453; 1983. Available from: <Available from: https://www.sciencedirect.com/science/article/abs/pii/003807178390010X >. Accessed: Jan. 20, 2018. doi: 10.1016/0038-0717(83)90010-X.
» https://doi.org/10.1016/0038-0717(83)90010-X.» https://www.sciencedirect.com/science/article/abs/pii/003807178390010X - PINTO, L.F.S. et al. Lowland soils in southern Brazil cultivated with irrigated rice. In: Irrigated Rice in Southern Brazil. Brasília: Embrapa, 2004.
- PONNAMPERUMA, F. N. et al. Influence of redox potential and partial pressure of carbon dioxide on pH values and the suspension effect of flooded soils. Soil Science. v.101, p.421-431; 1966. Available from: <Available from: https://journals.lww.com/soilsci/Citation/1966/06000/INFLUENCE_OF_REDOX_POTENTIAL_AND_PARTIAL_PRESSURE.1.aspx >. Accessed: Feb. 18, 2018.
» https://journals.lww.com/soilsci/Citation/1966/06000/INFLUENCE_OF_REDOX_POTENTIAL_AND_PARTIAL_PRESSURE.1.aspx - RAICH, J. W.; POTTER, C. S. Global patterns of carbon dioxide emissions from soils. Global Biogeochemical Cycles. v.9, p.23-36; 1995. Available from: <Available from: https://agupubs.onlinelibrary.wiley.com/doi/10.1029/94GB02723 >. Accessed: Feb. 18, 2018. doi: 10.1029/94GB02723.
» https://doi.org/10.1029/94GB02723.» https://agupubs.onlinelibrary.wiley.com/doi/10.1029/94GB02723 - REICHARDT, W. T. et al. Microbial population shifts in experimental rice systems. Applied Soil Ecology. v.17, p.151-163; 2001. Available from: <Available from: https://www.sciencedirect.com/science/article/abs/pii/S0929139301001226 >. Accessed: Mar. 18, 2018. doi: 10.1016/S0929-1393(01)00122-6.
» https://doi.org/10.1016/S0929-1393(01)00122-6.» https://www.sciencedirect.com/science/article/abs/pii/S0929139301001226 - REINERT, D. J.; REICHERT, J. M. Sand column to measure soil water retention: prototypes and testing. Ciência Rural. v.36, p.1931-1935; 2006. Available from: <Available from: http://www.scielo.br/scielo.php?pid=S0103-84782006000600044&script=sci_abstract >. Accessed: Jan. 12, 2018. doi: 10.1590/S0103-84782006000600044.
» https://doi.org/10.1590/S0103-84782006000600044.» http://www.scielo.br/scielo.php?pid=S0103-84782006000600044&script=sci_abstract - SCHENK, P. M. et al. Unraveling plant-microbe interactions: Can multi-species transcriptomics help? Trends Biotechnology. v.30, p.177-184; 2012. Available from: <Available from: https://www.sciencedirect.com/science/article/abs/pii/S0167779911001922 >. Accessed: Feb. 18, 2018. doi: 10.1016/j.tibtech.2011.11.002.
» https://doi.org/10.1016/j.tibtech.2011.11.002.» https://www.sciencedirect.com/science/article/abs/pii/S0167779911001922 - SCHLENTNER, R. E.; VAN CLEVE, K. Relationships between CO2 evolution from soil, substrate temperature, and substrate moisture in four mature forest types in interior Alaska. Canadian Journal of Forest Research. v.15, p.97-106; 1985. Available from: <Available from: https://www.nrcresearchpress.com/doi/10.1139/x85-018#.XoJc1YhKg2w >. Accessed: Feb. 12, 2018. doi: 10.1139/x85-018.
» https://doi.org/10.1139/x85-018.» https://www.nrcresearchpress.com/doi/10.1139/x85-018#.XoJc1YhKg2w - SILVA, E. E. et al. Determination of basal respiration and soil metabolic quotient (qCO2). Seropédica, Embrapa Agrobiologia, 2007. (Comunicado Técnico, 99).
- SILVA, M. et al. Flurescein diacetate hydrolysis as a bioindicator of microbial activity in soil under reforestation. Ciência Rural. v.34, p.1493-1496; 2004. Available from: <Available from: http://www.scielo.br/scielo.php?pid=S0103-84782004000500025&script=sci_abstract >. Accessed: Jan. 12, 2018. doi: 10.1590/S0103-84782004000500025.
» https://doi.org/10.1590/S0103-84782004000500025.» http://www.scielo.br/scielo.php?pid=S0103-84782004000500025&script=sci_abstract - SOSBAI. Irrigated Rice: Technical recommendations of the research for the Southern Brazil. 31 ed., Pelotas: SOSBAI, 2016. 200p.
- SOUSA, R. O. et al. Flooded soils (REDOX reactions). In: Fundamentals of soil chemistry. Porto Alegre: Evangraf. 2015.
- STOTSKY, G. Microbial respiration. In: Methods of soil analysis: chemical and microbiological properties. Madison: America Society of Agronomy ; 1965.
- STUBBERFIELD, L. C. F.; SHAW, P. J. A. A comparison of tetrazolium reduction and FDA hydrolysis with other measures of microbial activity. Journal of Microbiological Methods. v.12, p.151-162; 1990. Available from: <Available from: https://www.sciencedirect.com/science/article/pii/0167701290900263 >. Accessed: Feb. 12, 2018. doi: 10.1016/0167-7012(90)90026-3.
» https://doi.org/10.1016/0167-7012(90)90026-3.» https://www.sciencedirect.com/science/article/pii/0167701290900263 - TEDESCO, M. J. et al. Análises de solo, plantas e outros materiais. Porto Alegre: Departamento de Solos, UFRGS. 1995. 174p. (Boletim técnico n. 5).
- TEIXEIRA, P. C. et al. Manual de métodos de análise de solo. 3.ed. Brasília, DF. Embrapa, 2017. 574p.
- UNGER, I. M. et al. Flooding effects on soil microbial communities. Applied Soil Ecology. v.42, p.1-8; 2009. Available from: <Available from: https://www.sciencedirect.com/science/article/abs/pii/S0929139309000079 >. Accessed: Nov. 20, 2018. doi: 10.1016/j.apsoil.2009.01.007.
» https://doi.org/10.1016/j.apsoil.2009.01.007.» https://www.sciencedirect.com/science/article/abs/pii/S0929139309000079 - WEI, L. et al. Labile carbon matters more than temperature for enzyme activity in paddy soil. Soil Biology & Biochemistry. v.135, p.134-143; 2019b. Available from: <Available from: https://www.sciencedirect.com/science/article/abs/pii/S0038071719301300 >. Accessed: Feb. 02, 2020. doi: 10.1016/j.soilbio.2019.04.016.
» https://doi.org/10.1016/j.soilbio.2019.04.016.» https://www.sciencedirect.com/science/article/abs/pii/S0038071719301300 - WEI, X. et al. C/P stoichiometry of dying rice root defines the spatial distribution and dynamics of enzyme activities in root-detritusphere. Biology and fertility of soils. v.55, p.251-263; 2019a. Available from: <Available from: https://link.springer.com/article/10.1007/s00374-019-01345-y >. Accessed: Feb. 02, 2020. doi: 10.1007/s00374-019-01345-y.
» https://doi.org/10.1007/s00374-019-01345-y.» https://link.springer.com/article/10.1007/s00374-019-01345-y - WILDUNG, R. E. et al. The interdependent effects of soil temperature and water content on soil respiration rate and plant root decomposition in arid grassland soils. Soil Biology & Biochemistry. v.7, p.373-378; 1975. Available from: <Available from: https://www.sciencedirect.com/science/article/abs/pii/0038071775900528 >. Accessed: Feb. 12, 2018. doi: 10.1016/0038-0717(75)90052-8.
» https://doi.org/10.1016/0038-0717(75)90052-8.» https://www.sciencedirect.com/science/article/abs/pii/0038071775900528 - WILSON, J. S. et al. The effects of short-term flooding on carbon dynamics, microbial community structure and microbial activity in floodplain soil. River Research and Applications. v.27, p.213-225; 2011. Available from: <Available from: https://onlinelibrary.wiley.com/doi/abs/10.1002/rra.1352 >. Accessed: Feb. 12, 2018. doi: 10.1002/rra.1352.
» https://doi.org/10.1002/rra.1352.» https://onlinelibrary.wiley.com/doi/abs/10.1002/rra.1352
-
CR-2019-0831.R1
Publication Dates
-
Publication in this collection
11 May 2020 -
Date of issue
2020
History
-
Received
26 Oct 2019 -
Accepted
11 Mar 2020 -
Reviewed
14 Apr 2020