ABSTRACT:
Based on the apple acreage and output data of 23 provinces in China, the LMDI decomposition method and the barycenter analysis model were used to systematically analyze the spatiotemporal characteristics of apple production in China from 1978 to 2016. The results showed that the apple acreage and output continued to increase, and the apple production layout has moved to south-westward; Shaanxi, Shandong, Henan, Shanxi, Gansu, Hebei, Liaoning, and Xinjiang were the main contributors to the apple output increase in China; yield contributed more to apple output increase, the increase of yield was a significant contributing factor to the apple output growth in 17 provinces, whereas the expansion of apple acreage was a significant contributing factor in the other 6 provinces; the barycenter of apple acreage and output respectively moved to the southwest by 506.63 kilometers and 574.12 kilometers, and the barycenter of apple production gradually shifted to the Loess Plateau. To stabilize the effective supply of apple and maintain industrial security, the policymakers should attach importance to the fundamental role of technological progress in the development of the apple industry, and bring into play the technological progress, economic, social, and environmental effects of apple industry agglomeration by optimizing the apple production layout and strengthening policy guidance and regulatory measures.
Key words:
apple; production layout; evolutionary characteristics; LMDI decomposition; barycenter model; China.
RESUMO:
Com base nos dados de área cultivada e produção de maçã de 23 províncias na China, o método de decomposição do LMDI e o modelo de análise de barcenter foram utilizados para analisar sistematicamente as características espaço-temporais da produção de maçã na China entre 1978 e 2016. Os resultados mostraram que a área cultivada de maçã e a produção continuou a aumentar, e o layout da produção da maçã mudou para o Sudoeste; Shaanxi, Shandong, Henan, Shanxi, Gansu, Hebei, Liaoning e Xinjiang foram os principais contribuintes para o aumento da produção de maçãs na China; o rendimento contribuiu mais para o aumento da produção de maçã, o aumento do rendimento foi fator de contribuição significativo para o crescimento da produção de maçã em 17 províncias, enquanto a expansão da área cultivada de maçã foi fator de contribuição significativo nas outras 6 províncias; o baricentro da área cultivada e a produção de maçãs se deslocaram para o Sudoeste em 506,63 quilômetros e 574,12 quilômetros respectivamente. O baricentro da produção de maçãs mudou gradualmente para o platô de Loess. Para estabilizar o fornecimento efetivo de maçã e manter a segurança industrial, os formuladores de políticas devem atribuir importância ao papel fundamental do progresso tecnológico no desenvolvimento da indústria da maçã e colocar em jogo o progresso tecnológico, os efeitos econômicos, sociais e ambientais da indústria da maçã aglomeração, otimizando o layout da produção da maçã e fortalecendo a orientação política e as medidas regulatórias.
Palavras-chave:
maçã; layout de produção; características evolucionárias; decomposição de LMDI; modelo de baricentro; China
INTRODUCTION:
With the advancement of agricultural market-oriented reforms, the trend of product substitution and integration, and industry substitution and integration within China’s major agricultural regions and between is obvious (YU et al., 2011YU J. et al. The temporal and spatial evaluation on China’s agricultural policy output since 1978. Journal of Geographical Sciences, v.21, n.3, p.475-488, 2011. Available from: <Available from: https://link.springer.com/article/10.1007/s11442-011-0858-1 >. Accessed: Jan. 19, 2018. doi: 10.1007/s11442-011-0858-1.
https://link.springer.com/article/10.100...
). In this process, the comparative income has driven the rapid development of the apple industry with high-value attributes. The main sign of this is that the area and output of apples increased since the rural reform. According to the statistics of the National Bureau of Statistics of China (NBSC), China’s area under apple production and output increased by 2.42 times and 18.29 times from 1978 to 2016 (NBSC, 1985-2017National Bureau of Statistics of China (NBSC). China Rural Statistical Yearbook. China Statistics Press: Beijing, China, 1985-2017. Available from: <Available from: https://navi.cnki.net/knavi/YearbookDetail?pcode=CYFD&pykm=YMCTJ >. Accessed: Jan. 19, 2018. ISBN: 978-7-5037-9033-1.
https://navi.cnki.net/knavi/YearbookDeta...
). Specifically, China’s apple production has experienced four stages of steady development (1978-1984), rapid growth (1985-1996), rapid decline (1997-2003), and slow growth (2004-2015). In 2016, the apple acreage began to decline slowly, but China remains the largest apple producer and consumer in the world (LIU et al., 2012LIU T. et al. Analysis of the influencing factor and layout of major apple production in China. Issues in Agricultural Economy, v.33, n.10, 36-42, 2012. Available from: <Available from: https://kns.cnki.net/KCMS/detail/detail.aspx?FileName=NJWT201210007&DbName=CJFQ2012 >. Accessed: Jan. 19, 2014. doi: 10.13246/j.cnki.iae.2012.10.007.
https://kns.cnki.net/KCMS/detail/detail....
; YUAN et al., 2017YUAN, B. et al. Spatial pattern evolution and its driving factors for apple industry in China: Based on micro perspective of farmers’ decision making. Journal of Arid Land Resources and Environment, v.31, n.6, p.32-37, 2017. Available from: <Available from: https://kns.cnki.net/KCMS/detail/detail.aspx?FileName=GHZH201706006&DbName=CJFQ2017 >. Accessed: Jan. 19, 2018. doi: 10.13448/j.cnki.jalre.2017.175.
https://kns.cnki.net/KCMS/detail/detail....
; MA, 2016MA, W. Linking apple farmers to markets: Determinants and impacts of marketing contracts in China. China Agricultural Economic Review, v.8, n.1, p.2-21, 2016. Available from: <Available from: http://www.emeraldinsight.com/doi/full-xml/10.1108/CAER-04-2015-0035 >. Accessed: Jan. 19, 2017. doi: 10.1108/CAER-04-2015-0035.
http://www.emeraldinsight.com/doi/full-x...
; INOUYE et al., 2019INOUYE A. et al. Fresh Deciduous Fruit Annual-China. USDA Foreign Agricultural Service Report. 2019. Available from: <Available from: https://www.fas.usda.gov/data/china-fresh-deciduous-fruit-annual-3 >. Accessed: Jan. 19, 2020.
https://www.fas.usda.gov/data/china-fres...
). The United States Department of Agriculture (USDA) estimated that China’s fresh apple output and consumption accounted for 52.84% and 54.12% of the world total in 2016, respectively (USDA, 2019USDA Foreign Agricultural Service. Fresh Apples, Grapes, and Pears: World Markets and Trade. Washington, D.C. 2019. Available from: <Available from: https://downloads.usda.library.cornell.edu/usda-esmis/files/1z40ks800/pc289z933/3484zz05r/fruit.pdf >. Accessed: Jan. 19, 2020.
https://downloads.usda.library.cornell.e...
).
However, with the increase in income and living standards of urban and rural residents, consumers are increasingly focusing on the quality and safety of agricultural products, dietary health, and nutritional balance, resulting in the accelerated upgrading of the apple market demand structure, and the existing apple production and supply model is difficult to adapt to changes in market demand in the new period. The development of the apple industry is faced with the imbalance between the supply and the quality structure (ZHANG et al., 2019ZHANG, Q. et al. Spatiotemporal pattern of fruit output increase in China from 1978 to 2016 and the contribution factors. Journal of Arid Land Resources and Environment, v.33, n.10, p.65-71, 2019. Available from: <Available from: http://kns.cnki.net/kcms/detail/detail.aspx?FileName=GHZH201910011&DbName=CJFQ2019 >. Accessed: Jan. 19, 2020. doi: 10.13448/j.cnki.jalre.2019.289.
http://kns.cnki.net/kcms/detail/detail.a...
), it is mainly manifested by the disconnection between the source of production and the market demand, the oversupply of middle and low grade apples and the shortage of high-quality apples, and the high-quality and low-priced imported apples impacting the domestic market. In some major apple producing areas, especially in non-suitable producing areas, the problem of low apple prices damaging farmers’s interests frequently occurs. In essence, the root cause of the above phenomenon is that apple production layout is unreasonable, the specificity of apple assets strengthens the “locking effect” of apple production in non-suitable and sub-suitable areas, the high sunk cost of apple production hinders the optimization of apple production layout, and has an extrusion effect on other suitable industries in the region, which further reduces the efficiency of regional resource allocation, resulting in outstanding problems in the uncoordinated and uneven distribution of apple production regions. The pressure of structural reform on the supply side of the apple industry highlights the necessity and urgency of optimizing the layout of apple production.
The development of China’s apple industry has entered a new historical stage, and the relationship between apple supply and demand has undergone major changes. Apple production must adapt to market demand. Changes in the layout of China’s apple production not only affect the situation of domestic apple production and sales, but also the pattern of international apple production and sales pattern. In particular, the apple industry is also the major agricultural industry in the main producing areas and the main source of farmers’ income (MARA, 2007Ministry of Agriculture and Rural Affairs of the People’s Republic of China (MARA). China Apple Industry Development Report: 1995-2005. China Agricultural Press: Beijing, China. 2007. Available from: <Available from: https://spu.jd.com/1079722397.html >. Accessed: Jan. 19, 2015. ISBN: 9787109116269.
https://spu.jd.com/1079722397.html...
).
Therefore, the government and academia have paid close attention to the changes in the layout of apple production and its possible impacts. To guide the regional development and spatial layout of the apple industry, the Ministry of Agriculture and Rural Affairs (MARA) of the People’s Republic of China promulgated The Advantageous Regional Layout Plan for Apple (2003-2007) in 2003, The Advantageous Regional Development Plan for Apple (2008-2015) in 2009 and The Regional Layout Plan for Special Agricultural Products (2013-2020) in 2014. LIU et al. (2012LIU T. et al. Analysis of the influencing factor and layout of major apple production in China. Issues in Agricultural Economy, v.33, n.10, 36-42, 2012. Available from: <Available from: https://kns.cnki.net/KCMS/detail/detail.aspx?FileName=NJWT201210007&DbName=CJFQ2012 >. Accessed: Jan. 19, 2014. doi: 10.13246/j.cnki.iae.2012.10.007.
https://kns.cnki.net/KCMS/detail/detail....
) found that China’s apple production has gradually shifted to the two dominant areas of the Bohai Bay and the Loess Plateau, and has shown the characteristics of “north-westward expansion” in the region; FENG et al. (2015FENG X. et al. Total factor productivity of apple industry in China considering non-point source pollution and its spatial concentration analysis. Transactions of the Chinese Society of Agricultural Engineering (Transactions of the CSAE), v.31, n.18, p.204-211, 2015. Available from: <Available from: http://d.wanfangdata.com.cn/periodical/nygcxb201518029 >. Accessed: Apr. 19, 2018. doi: 10.11975/j.issn.1002-6819.2015.18.029.
http://d.wanfangdata.com.cn/periodical/n...
) included non-point source pollution into apple total factor productivity, through the analysis of the global and local spatial autocorrelation of apple total factor productivity, they found that China’s apple total factor productivity showed a significant positive spatial correlation both in the global and local scales; ZHANG et al. (2017ZHANG, F. et al. Spatial agglomeration analysis of production efficiency in China’s main apple production area based on SBM and Malmquist index. Journal of Agrotechnical Economics, n.5, p.57-66, 2017. Available from: <Available from: http://kns.cnki.net/kcms/detail/detail.aspx?FileName=NYJS201705006&DbName=CJFQ2017 >. Accessed: Jan. 19, 2018. doi: 10.13246/j.cnki.jae.2017.05.006.
http://kns.cnki.net/kcms/detail/detail.a...
) used the Slacks-based Measure (SBM) model and the Malmquist index to find that the production efficiency of China’s main apple production areas had a spatial agglomeration effect; YUAN et al. (2017YUAN, B. et al. Spatial pattern evolution and its driving factors for apple industry in China: Based on micro perspective of farmers’ decision making. Journal of Arid Land Resources and Environment, v.31, n.6, p.32-37, 2017. Available from: <Available from: https://kns.cnki.net/KCMS/detail/detail.aspx?FileName=GHZH201706006&DbName=CJFQ2017 >. Accessed: Jan. 19, 2018. doi: 10.13448/j.cnki.jalre.2017.175.
https://kns.cnki.net/KCMS/detail/detail....
) studied the evolution and driving mechanism of China’s apple industry from the micro perspective of farmers’ decision-making, and found that the pattern of China’s apple industry is showing a “westward” trend; ZHANG et al. (2018) ZHANG, C. et al. Analysis on the layout of China’s apple production transition. Economic Geography , v.38, n.8, p.141-151, 2018. Available from: <Available from: http://kns.cnki.net/kcms/detail/detail.aspx?FileName=JJDL201808018&DbName=DKFX2018 >. Accessed: Jan. 19, 2019. doi: 10.15957/j.cnki.jjdl.2018.08.01.
http://kns.cnki.net/kcms/detail/detail.a...
studied the changes in China’s apple production regions and found that the barycenter of apple production in China is moving westward obviously, but the characteristic of “northward expansion” is not apparent.
In summary, the existing studies focus on analyzing the characteristics of the development and spatial distribution of apple production in China at a certain stage, that is, focus on the spatial changes of China’s apple production in the short term. However, due to the large differences in the economic environment and policy support for the apple industry development in each stage, it is difficult to reveal the characteristics of the spatial distribution of apple production nationwide and its evolution regularity since 1978. Moreover, due to the comparative gains in apple production across industries and regions, the changes in the external environment, the regional changes in apple production layout are complex and irreversible (YANG et al., 2011YANG W. et al. Studies on the spatial distribution changing of China’s rice production and its influencing factors. Economic Geography , v.31, n.12, p.2086-2093, 2011. Available from: <Available from: https://kns.cnki.net/KCMS/detail/detail.aspx?FileName=JJDL201112025&DbName=CJFQ2011 >. Accessed: Jan. 19, 2019. doi: 10.15957/j.cnki.jjdl.2011.12.025.
https://kns.cnki.net/KCMS/detail/detail....
). Therefore, identifying and grasping the evolution characteristics of the apple production layout has become an important issue in optimizing the layout of apple industry and coordinating the relationship between apple production and sales, that is, in the context of a significant shift in the relationship between apple supply and demand, how to promote the supply-side structural reform of the apple industry requires an accurate grasp of the evolution pattern of apple production layout, an innovative analysis of the mechanism and methods of the evolution rule of apple production layout, and the promotion of government ability to predict and make changes in production layout. For these reasons, this paper studied the characteristics of apple production in China since 1978, from the perspective of the apple production area and yield changes at the national and provincial scales. First, this study analyzed the time series characteristics of apple production in China. Second, this study used the statistical analysis method of spatial barycenter and provincial data to comprehensively analyze the spatial distribution characteristics of apple production in China, to make up for the shortcomings of existing studies in terms of space-time scale and methods.
MATERIALS AND METHODS:
Data Sources
Data on apple acreage and output at the national and provincial scales were derived from China Rural Statistical Yearbook (1985-2017) (NBSC, 1985-2017National Bureau of Statistics of China (NBSC). China Rural Statistical Yearbook. China Statistics Press: Beijing, China, 1985-2017. Available from: <Available from: https://navi.cnki.net/knavi/YearbookDetail?pcode=CYFD&pykm=YMCTJ >. Accessed: Jan. 19, 2018. ISBN: 978-7-5037-9033-1.
https://navi.cnki.net/knavi/YearbookDeta...
) and New China Agricultural Statistics for 60 Years (NBSC, 2009National Bureau of Statistics of China (NBSC). New China Agricultural Statistics for 60 Years. China Statistics Press: Beijing, China. 2009. Available from: <Available from: https://navi.cnki.net/knavi/YearbookDetail?pcode=CYFD&pykm=YXZGE >. Accessed: Jan. 19, 2012. ISBN: 7-5037-3402-7/F.1286.
https://navi.cnki.net/knavi/YearbookDeta...
). The dataset used in the present study covered 23 apple-producing provinces, cities, and autonomous regions (including Shandong, Hebei, Liaoning, Tianjin, Beijing in the Bohai Bay production area, Shaanxi, Gansu, Shanxi, Ningxia, Qinghai in the Loess Plateau production area, Henan, Anhui, Jiangsu in the Yellow River old road production area, Sichuan, Chongqing, Yunnan, Guizhou, Tibet in the southwest cold and highland production area, and Inner Mongolia, Heilongjiang, Jilin, Hubei, and Xinjiang in special production area) of China Mainland (hereinafter China for convenience) for thirty-nine consecutive years (1978-2016), with a total of 858 observations (Figure 1). In 1997, Chongqing became a direct-controlled municipality, therefore, its statistics have been calculated since 1997. The geometric centers of the administrative region of each province are considered as their barycenter. The coordinate data and the vector data of the map were obtained from the National Geomatics Center of China (NGCC, http://www.ngcc.cn/ngcc/). Limited by statistical data, the fruits discussed in this study are garden fruits, including apples, oranges, pears, grapes, and bananas.

LMDI decomposition method
The contribution rate of increasing output is measured by the proportion of the increase of apple output in a certain region to the total increase of apple output in that year. The calculation method is as follows:
(1)
(2)
where Ci and ΔCi denote the apple output contribution rate and the increased output contribution rate of province , i and Pi denote the apple output and increased output in provinces i, k denotes the number of apple producing provinces, k=1,L 23.
Changes in apple output are mainly the result of a combination of changes in acreage and yield. To compare the contribution of acreage and yield changes to the increase of apple output, this study adopted the Logarithmic Mean Division Index (LMDI) method (ANG et al, 2007ANG B. et al. Handling zero values in the logarithmic mean divisia index decomposition approach. Energy Policy, v.35, n.1, p.238-246, 2007. Available from: <Available from: http://www.sciencedirect.com/science/article/pii/S0301421505002995 >. Accessed: Mar. 18, 2020. doi: 10.1016/j.enpol.2005.11.001.
http://www.sciencedirect.com/science/art...
), because some studies have shown that the LMDI method is superior to the AMDI method in terms of theoretical basis, applicability, simplicity, and interpretability of results (DING et al., 2017DING W. et al. Analysis on growth pattern and trend of fruit industry in China: take citrus for example. World agriculture, 12, p.148-155, 2017. Available from: <Available from: https://kns.cnki.net/KCMS/detail/detail.aspx?FileName=SJNY201712024&DbName=CJFQ2017 >. Accessed: Mar. 19, 2018. doi: 10.13856/j.cn11-1097/s.2017.12.023.
https://kns.cnki.net/KCMS/detail/detail....
; WANG et al., 2018WANG J. et al. Decomposition of influencing factors and its spatial-temporal characteristics of vegetable production: A case study of China. Information Processing in Agriculture, v.5, n.4, p.477-489, 2018. Available from: <Available from: https://www.sciencedirect.com/science/article/pii/S2214317317300896 >. Accessed: Jan. 19, 2019. doi: 10.1016/j.inpa.2018.06.004.
https://www.sciencedirect.com/science/ar...
). Apple output increase can be decomposed into the sum of the output increase contributed by acreage expansion (referred to as “acreage contribution”) and the output increase contributed by yield increase (referred to as “yield contribution”) (ZHANG et al., 2019ZHANG, Q. et al. Spatiotemporal pattern of fruit output increase in China from 1978 to 2016 and the contribution factors. Journal of Arid Land Resources and Environment, v.33, n.10, p.65-71, 2019. Available from: <Available from: http://kns.cnki.net/kcms/detail/detail.aspx?FileName=GHZH201910011&DbName=CJFQ2019 >. Accessed: Jan. 19, 2020. doi: 10.13448/j.cnki.jalre.2019.289.
http://kns.cnki.net/kcms/detail/detail.a...
). Therefore, the increase of apple output in a certain region can be calculated by the following methods:
(3)
where ΔPa and ΔPy denote the increase of apple output in a certain region contributed by the acreage expansion and yield increase. The specific output contribution can be obtained by decomposing and :
(4)
(5)
where  and Pt denote the apple output of a region at the beginning and end of the period, ab and at denote the apple acreage of a region at the beginning and end of the period, and denote the apple yield of a region at the beginning and end of the period.
The contribution ratio of apple acreage and yield to apple output increase can be calculated:
(6)
(7)
where Ca and Cy denote the contribution rate of apple acreage expansion and yield increase to apple output increase in a region, and . This study divided Ca and Cy into more significant [50% < max (Ca,Cy) ≤ 60%], significant [60% < max (Ca,Cy) ≤ 80%] and extremely significant [max (Ca,Cy) > 80%] three levels (FENG et al., 2016FENG Z. et al. Study on the spatiotemporal patterns and contribution factors of China’s grain output increase during 2003-2013. Journal of Natural Resources, v.31, n.6, p.895-907, 2016. Available from: <Available from: https://kns.cnki.net/KCMS/detail/detail.aspx?FileName=ZRZX201606001&DbName=CJFQ2016 >. Accessed: Nov. 19, 2017. ISBN/ISSN: 1000-3037.
https://kns.cnki.net/KCMS/detail/detail....
).
Barycenter analysis model
The barycenter can accurately represent the spatial distribution characteristics of the barycenter of factors (LIN et al., 2014LIN S. et al. The dynamic evolvement procedure of population and economic gravity center in Hunan from 1990s. Economic Geography , v.34, n.10, p.31-38, 2014. Available from: <Available from: https://kns.cnki.net/KCMS/detail/detail.aspx?FileName=JJDL201410005&DbName=CJFQ2014 >. Accessed: Jan. 19, 2015. doi: 10.15957/j.cnki.jjdl.2014.10.035.
https://kns.cnki.net/KCMS/detail/detail....
), resources (SUN et al., 2018SUN, C. et al. Temporal and spatial evolution of green efficiency of water resources in China and its convergence analysis. Progress in Geography, v.37, n.7, p.901-911, 2018. Available from: <Available from: https://kns.cnki.net/KCMS/detail/detail.aspx?FileName=DLKJ201807004&DbName=CJFQ2018 >. Accessed: Jan. 19, 2019. ISBN/ISSN: 1007-6301.
https://kns.cnki.net/KCMS/detail/detail....
), industry (NIE et al., 2015NIE L. et al. The evolution analysis of the grain production concentration in China. Research of Agricultural Modernization, v.36, n.3, p.380-386, 2015. Available from: <Available from: https://kns.cnki.net/KCMS/detail/detail.aspx?FileName=NXDH201503010&DbName=CJFQ2015 >. Accessed: Jan. 19, 2016. doi:10.13872/j.1000-0275.2015.0044.
https://kns.cnki.net/KCMS/detail/detail....
; ZHANG et al., 2018ZHANG, Y. et al. Analysis on the change of peanut production distribution in China. Journal of Agrotechnical Economics, n.9, p.112-122, 2018. Available from: <Available from: http://kns.cnki.net/kcms/detail/detail.aspx?FileName=NYJS201809010&DbName=DKFX2018 >. Accessed: Jan. 19, 2019. doi: 10.13246/j.cnki.jae.2018.09.010.
http://kns.cnki.net/kcms/detail/detail.a...
; LIU et al., 2018LIU H. et al. An empirical study on spatial-temporal dynamics and influencing factors of tea production in China. Sustainability, v.10, n.9, e.3037, 2018. Available from: <Available from: http://www.mdpi.com/2071-1050/10/9/3037 >. Accessed: Jan. 19, 2019. doi: 10.3390/su10093037.
http://www.mdpi.com/2071-1050/10/9/3037...
, LI et al., 2017LI, E. et al. Analyzing agricultural agglomeration in China. Sustainability, v.9, n.2, e.313, 2017. Available from: <Available from: http://www.mdpi.com/2071-1050/9/2/313 >. Accessed: Jan. 19, 2018. doi: 10.3390/su9020313.
http://www.mdpi.com/2071-1050/9/2/313...
) and economic development (MENG et al., 2017MENG, G. et al. The shift route and future expectations of economic development center of gravity in Tianjin. Economic Geography , v.37, n.5, p.87-93, 2017. Available from: <Available from: https://kns.cnki.net/KCMS/detail/detail.aspx?FileName=JJDL201705012&DbName=CJFQ2017 >. Accessed: Jan. 19, 2018. doi: 10.15957/j.cnki.jjdl.2017.05.012.
https://kns.cnki.net/KCMS/detail/detail....
; XU et al., 2014XU, G. et al. Evolvement analysis of the economic gravity center and economic development gravity center in the regions of South China Sea during 1991-2011. Resources Science, v.36, n.4, p.682-690, 2014. Available from: <Available from: https://kns.cnki.net/KCMS/detail/detail.aspx?FileName=ZRZY201404003&DbName=CJFQ2014 >. Accessed: Jan. 19, 2018. ISBN/ISSN: 1007-7588.
https://kns.cnki.net/KCMS/detail/detail....
). This study used the barycenter theory and method to analyze the evolution characteristics of the barycenter of apple production, and reveal the movement of the regional equilibrium point of the apple acreage and the changing pattern of the regional distribution of the apple industry. Assuming that the provincial areas are the homogeneous plane, and the geometric center point coordinates of the provincial administrative region are selected as their geographic barycenter coordinates, thus, the barycenter of apple production refers to the moment equilibrium point of the apple acreage or output in the provincial region distribution in a certain period. The specific calculation method is as follows:
(8)
where and denote the longitude and latitude values of the geographic location where the barycenter of China’s apple production is located in the t th year, Xi and Yi denote the longitude and latitude values of the geometric center point of the province i; M it denotes the apple acreage or output of the province i in the t th year, and N denotes the number of apple producing provinces.
The moving distance of the barycenter of China’s apple production can be calculated:
(9)
where Dt-T denotes the moving distance of the barycenter of China’s apple production from the th year to the t th year to the T th year, and denote the latitude and longitude coordinates of the barycenter of China’s apple production from the t th year to the T th year, E is a plane conversion coefficient, which denotes the value corresponding to the transformation of geographic coordinates into a plane distance, the value is usually 111.13 kilometers (ZHANG et al., 2018ZHANG, Y. et al. Analysis on the change of peanut production distribution in China. Journal of Agrotechnical Economics, n.9, p.112-122, 2018. Available from: <Available from: http://kns.cnki.net/kcms/detail/detail.aspx?FileName=NYJS201809010&DbName=DKFX2018 >. Accessed: Jan. 19, 2019. doi: 10.13246/j.cnki.jae.2018.09.010.
http://kns.cnki.net/kcms/detail/detail.a...
; XIAO et al., 2018XIAO, Z. et al. Spatio-temporal variation and the driving forces of tea production in China over the last 30 years. Journal of Geographical Sciences, v.28, n.3, 275-290, 2018. Available from: <Available from: https://link.springer.com/article/10.1007/s11442-018-1472-2 >. Accessed: Jan. 19, 2019. doi: 10.1007/s11442-018-1472-2.
https://link.springer.com/article/10.100...
).
RESULTS AND DISCUSSION:
From 1978 to 2016, the apple acreage in China increased from 0.68 million ha to 2.32 million ha, an increase of 1.65 million ha, with an average annual growth rate of 3.29%; apple output increased from 2.28 million tons to 43.83 million tons, an increase of 41.70 million tons, with an average annual growth rate of 8.10%.
From the perspective of absolute volume change, the changes in apple acreage since 1978 has experienced four stages of the stable period (1978-1984), the rapid increase period (1985-1996), the rapid decline period (1997-2003), and the slow increase period (2004-2015) (LIU et al., 2012LIU T. et al. Analysis of the influencing factor and layout of major apple production in China. Issues in Agricultural Economy, v.33, n.10, 36-42, 2012. Available from: <Available from: https://kns.cnki.net/KCMS/detail/detail.aspx?FileName=NJWT201210007&DbName=CJFQ2012 >. Accessed: Jan. 19, 2014. doi: 10.13246/j.cnki.iae.2012.10.007.
https://kns.cnki.net/KCMS/detail/detail....
; ZHANG et al., 2018ZHANG, Y. et al. Analysis on the change of peanut production distribution in China. Journal of Agrotechnical Economics, n.9, p.112-122, 2018. Available from: <Available from: http://kns.cnki.net/kcms/detail/detail.aspx?FileName=NYJS201809010&DbName=DKFX2018 >. Accessed: Jan. 19, 2019. doi: 10.13246/j.cnki.jae.2018.09.010.
http://kns.cnki.net/kcms/detail/detail.a...
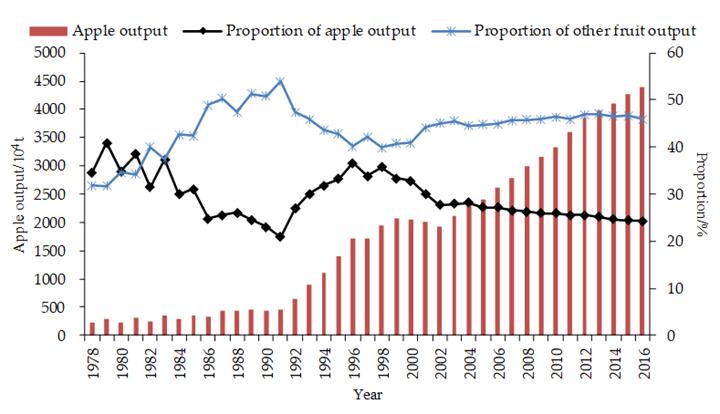
). In 2016, the apple acreage decreased slightly, from 2.33 million ha in 2015 to 2.32 million ha in 2016, a decrease of 0.19% (Figure 2). The changes in apple output during the thirty-nine years can be divided into four phases: the stable period (1978-1991), the rapid growth period I (1992-1996), the buffer period (1997-2002), and the rapid growth period II (2003-2016) (Figure 3). Factors, such as technology progress, and varieties improvement, boosted apple yield and led to the asynchronous changes between apple acreage and output.


From the perspective of relative volume change, affected by the comparative returns of other fruits and the structural adjustment of the fruit industry, the proportion of apple acreage and output to the total fruit acreage and output generally declined. Constrained by arable land resources and market demand, there is a clear substitution relationship between apple and other fruit (ROURKE, 2019ROURKE D. O. World Apple Review-2018. Belrose, Inc.: Washington, USA. 2019. Available from: <Available from: https://www.e-belrose.com/product/world-apple-review-2018-annual >. Accessed: Jan. 19, 2020. SKU: AR2018.
https://www.e-belrose.com/product/world-...
). The main reason is that since the rural reform, China’s fruit industry took the lead in entering market-oriented reforms. The daily consumption of fruit by residents, such as apples, oranges, pears, grapes, and bananas, has developed rapidly (ZHU et al., 2013ZHU J. et al. Analysis on China’s nine-year consecutive grain production growth: contribution and future potential of inter-crop structural adjustment. Issues in Agricultural Economy, v.34, n.11, p.36-43, 2013. Available from: <Available from: http://kns.cnki.net/kcms/detail/detail.aspx?FileName=NJWT201311006&DbName=CJFQ2013 >. Accessed: Jan. 19, 2019. doi: 10.13246/j.cnki.iae.2013.11.012.
http://kns.cnki.net/kcms/detail/detail.a...
). The relative price of apples in suitable production areas was relatively high and had spillover effects, coupled with policy support for industrial poverty alleviation, rational differences among farmers, and other factors, which induce the expansion of apple acreage in non-suitable and sub-suitable areas. The proportion of apple acreage and output in non-suitable and sub-suitable areas has risen, but the quality is relatively poor, leading to the decline in the overall development quality of China’s apple industry, and the amplification of the natural and market risks of apple production, which in turn led to frequent fluctuations in the apple market. Besides, the development of alternative fruits, such as oranges, pears, grapes, and bananas, the comparative advantage of apples has been affected, resulting in the proportion of apples in the total fruit acreage fell from 40.98% in 1978 to 17.90% in 2016, and the proportion of apple output in total fruit output decreased from 34.63% in 1978 to 24.22% in 2016.
From 1978 to 2016, the change in apple acreage contributed 17.2997 million tons of increased apple output, accounting for 41.58% of the total increased apple output nationwide. The change in apple yield contributed 24.3073 million tons of increased apple output, accounting for 58.42% of the total increased apple output nationwide (Table 1). Therefore, the contribution rate of apple yield change to the increase of apple output was higher than that of apple acreage change. Specifically, the contribution rate of apple acreage and yield change from 1978 to 1992 fluctuated greatly due to the difference in the trend and direction of apple acreage and yield change (ZHU et al., 2013ZHU J. et al. Analysis on China’s nine-year consecutive grain production growth: contribution and future potential of inter-crop structural adjustment. Issues in Agricultural Economy, v.34, n.11, p.36-43, 2013. Available from: <Available from: http://kns.cnki.net/kcms/detail/detail.aspx?FileName=NJWT201311006&DbName=CJFQ2013 >. Accessed: Jan. 19, 2019. doi: 10.13246/j.cnki.iae.2013.11.012.
http://kns.cnki.net/kcms/detail/detail.a...
), that is, the contribution rate of apple acreage and yield was positive or negative. From 1986 to 1991, the increase in apple output nationwide was mainly driven by rapid acreage increase, the apple acreage nationwide increased from 1.17 million ha to 1.66 million ha during this period, with an average annual growth rate of 7.20%. Whereas the contribution of technological progress to apple output increase was not obvious, that is, the acreage contribution rate was greater than 1, while the yield contribution rate was negative (LIU, 2005LIU, Y. Apple Industry in China. China Agricultural University, PhD dissertation: Beijing, China. 2005. Available from: <Available from: https://kns.cnki.net/kcms/detail/detail.aspx?FileName=2005084993.nh&DbName=CDFD2005 >. Accessed: Jan. 29, 2015.
https://kns.cnki.net/kcms/detail/detail....
). On the other hand, driven by factors, such as variety improvement, cultivation technology innovation, orchard equipment and infrastructure upgrades, and improvement of fruit farmers’ quality, the contribution rate of yield changes has been increasing year by year since 1994. After 1998, some traditional producing areas accelerated the improvement of old and low-efficiency orchards, and apple production entered a phase of shifting from quantity to quality-efficient, the apple acreage tended to be stable and reasonable, the contribution of technological progress in apple output was prominent. As a result, the yield contribution rate has continued to be higher than the acreage contribution rate since 2002. Generally, the apple yield increased from 3,351.17 kg/ha to 18,883.72 kg/ha during thirty-nine years, an increase of 4.63 times, indicating that technological progress actuating yield improvement is the main driving force for increased apple output in China.
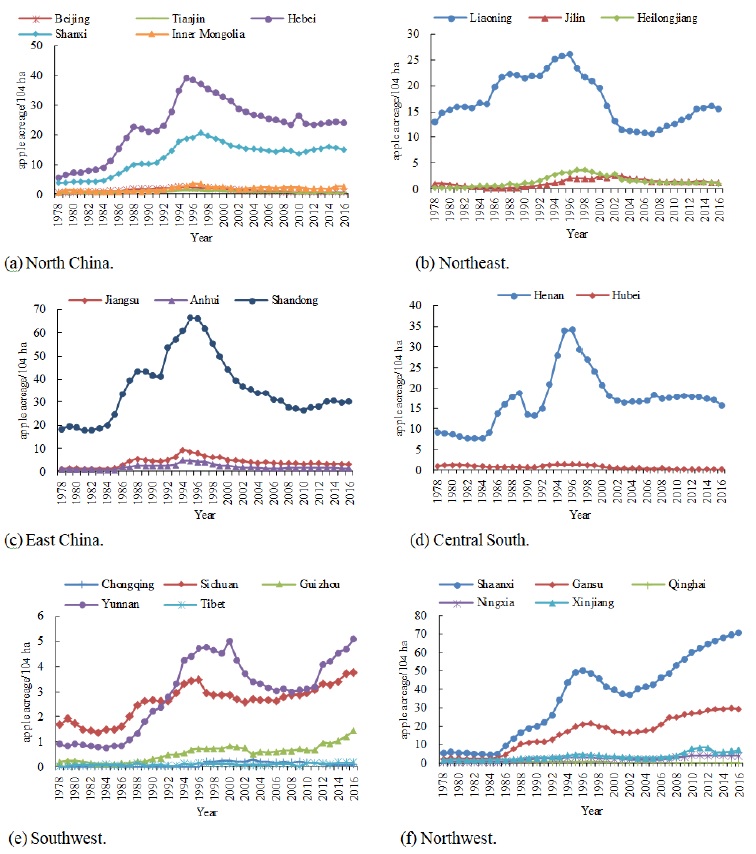
From the analysis of apple acreage changes, apple acreage in Hubei, Chongqing, and Qinghai decreased slightly from 1978 to 2016, and apple acreage in other provinces increased in varying degrees. Especially, Hebei and Shanxi in North China, Liaoning in the Northeast, Shandong in East China, Henan in Central South, Sichuan and Yunnan in the Southwest, and Shaanxi and Gansu in the Northwest saw larger increases in apple acreage. Beijing and Tianjin in North China, Heilongjiang and Jilin in the Northeast, Anhui in Eastern China, and Chongqing and Tibet in the Southwest have remained stable in apple acreage. From the analysis of the spatial pattern of apple production, Hebei and Shanxi in North China, Liaoning in the Northeast, Shandong in East China, Henan in Central South, Sichuan and Yunnan in the Southwest, and Shaanxi in the Northwest are the main apple producing provinces in their respective regions (Figure 4).

From the analysis of the apple output increased volume, due to the expansion of acreage and increase in yield, the output of 23 apple-producing provinces increased to varying degrees, but the apple production areas are mainly distributed in the Loess Plateau and the Bohai Bay advantaged areas (BAI et al., 2015BAI X. et al. Empirical studies on the climate change and variation of regional apple production structure in China. Economic Geography, v.35, n.6, p.130-137, 2015. Available from: <Available from: https://kns.cnki.net/KCMS/detail/detail.aspx?FileName=JJDL201506018&DbName=CJFQ2015 >. Accessed: Mar. 19, 2020. doi: 10.15957/j.cnki.jjdl.2015.06.018.
https://kns.cnki.net/KCMS/detail/detail....
). Among them, Shaanxi’s apple output increase ranked first nationwide, its apple output increased by 10.91 million tons, accounting for 26.22% of the total increase in apple production nationwide. Shandong’s apple output increased by 8.93 million tons, accounting for 21.46 % of the total increase in apple production nationwide. Shaanxi and Shandong are the main provinces for apple output increase in the two advantage areas (XU et al., 2015XU Y et al. 2015. Analysis on the pattern change and influence factors of apple production in China. Information Engineering Research Inst: Newark, USA. ISBN: 2160-1070-978-1-61275-070-5.). In addition, other provinces that increased apple output by more than 1 million tons include Henan, Shanxi, Gansu, Hebei, Liaoning, and Xinjiang (Table 2).
From the analysis of the apple output increased extent, Shaanxi had the largest increase extent in apple output during thirty-nine years, with an increase in apple output of 10,996.59%, which is 6.01 times the nationwide average increase (1,828.76%) in apple output (Table 2). Gansu, Ningxia, and Heilongjiang were the provinces that increased their apple output by more than 5,000%. Among the 23 apple-producing provinces, the apple output increase extent of 13 provinces was higher than the national average (that is, the super-growth type), that of 10 provinces below the national average (that is, the lagging-growth type). Apple output in Sichuan, Yunnan, Shaanxi, and Gansu increased by more than 30 years.
From 1978 to 2016, apple production in 20 provinces achieved a “double increase” in output and acreage. Except for Beijing and Tibet, there are 21 provinces with increased apple yield. In terms of the contribution rate of acreage and yield to apple output increase, there are 17 provinces (in turn, Chongqing, Hubei, Qinghai, Tianjin, Jilin, Anhui, Liaoning, Henan, Shandong, Sichuan, Jiangsu, Shanxi, Inner Mongolia, Hebei, Heilongjiang, Xinjiang, and Yunnan) that had relatively higher yield contribution rates. Particularly, the yield contribution of Chongqing, Hubei, and Qinghai exceeded 120%. Moreover, there are 6 provinces (in turn, Tibet, Beijing, Gansu, Ningxia, Guizhou, and Shaanxi) that have relatively higher acreage contribution rates. Especially, the acreage contribution rate of Tibet and Beijing was greater than 100% (Table 2). Overall, due to the technological progress, management innovation, and scale operation, the increase in apple yield was the main driving force for apple output increase nationwide.
From the analysis of regional distribution, the provinces that have the most significant yield contribution to apple output increase mainly distributed in the northern region. The provinces that have a significant yield contribution mainly distributed in the eastern region, namely Shandong and Jiangsu. The provinces that have an extremely significant contribution mainly distributed in the central region and the northeast. The provinces with significant apple acreage contribution mainly distributed in the northwest and Guizhou in the southwest, the provinces with extremely significant apple acreage contribution were Xinjiang in the northwest and Beijing in North China.
From the analysis of spatial position changes, the apple acreage barycenter changed between 110.56°E-115.61°E and 36.58°N-37.53°N from 1978 to 2016. Based on the analysis of the movement trajectory, the apple acreage barycenter changed from 115.23°E and 37.01°N (located in Julu County of Hebei province) in 1978 to 110.69°E and 36.59°N (located in Yonghe County of Shanxi province) in 2016 (Table 3). Therefore, the apple acreage barycenter generally moved to the southwest and is expected to move to Yanchuan County of Shaanxi province. It is worth noting that the distance moved by the apple acreage barycenter in the east-west direction was greater than the distance moved in the north-south direction, which indicates that the apple acreage in the east-western direction has changed more (ZHANG et al., 2018ZHANG, Y. et al. Analysis on the change of peanut production distribution in China. Journal of Agrotechnical Economics, n.9, p.112-122, 2018. Available from: <Available from: http://kns.cnki.net/kcms/detail/detail.aspx?FileName=NYJS201809010&DbName=DKFX2018 >. Accessed: Jan. 19, 2019. doi: 10.13246/j.cnki.jae.2018.09.010.
http://kns.cnki.net/kcms/detail/detail.a...
), that is, the apple acreage increased in the Loess Plateau is greater than other producing areas. From the perspective of moving distance, the apple acreage barycenter moved 506.63 kilometers to the southwest from 1978 to 2016, indicating that the apple acreage barycenter gradually shifted from the Bohai Bay to the Loess Plateau. The main reason is that the Loess Plateau belongs to the apple eugenic region, and the Loess Plateau production area is richer in land resources than the Bohai Bay production area, according to the statistics of NBSC, the volume of agricultural lands in the Loess Plateau was 96.0486 million ha in 2016, which is 2.53 times that in the Bohai Bay (NBSC, 2017National Bureau of Statistics of China (NBSC). Chinese Agricultural Statistics. China Statistics Press: Beijing, China, 2017. Available from: <Available from: https://navi.cnki.net/knavi/YearbookDetail?pcode=CYFD&pykm=YZGNT >. Accessed: Jan. 19, 2018. ISBN: 978-7-109-25511-1.
https://navi.cnki.net/knavi/YearbookDeta...
). Therefore, the shift of the apple acreage barycenter to the Loess Plateau is in line with the national apple industry layout plan and industrial strategy.
From the perspective of space, the apple output barycenter changed between 111.91°E-117.23°E and 36.32°N-37.84°N from 1978 to 2016. From the perspective of the movement trajectory, the apple output barycenter changed from 116.91°E and 37.83°N (located in Nanpi County of Hebei Province) in 1978 to 111.91°E and 36.54°N (located in Lingshi County of Shanxi Province) in 2016, that is, the apple output barycenter generally moved to the southwest (Table 4). From the perspective of moving distance, the apple output barycenter moved 574.12 kilometers to the southwest from 1978 to 2016, indicating that the apple output barycenter gradually shifted from the Bohai Bay to the Loess Plateau. The main reason is that apple output and quality are greatly affected by natural conditions, the Loess Plateau is the production center of the high-quality apple, and its resource endowment for developing the apple industry is superior to the Bohai Bay. Therefore, the shift of the apple output barycenter to the Loess Plateau fitted the advantages of resource endowment.
CONCLUSION:
In this study, the LMDI decomposition method, GIS technology and the apple acreage, output and yield data at the national and provincial scales from 1978 to 2016 were used to comprehensively analyze the characteristics of apple output increase, regional distribution, and barycenter movement in China. The findings were presented as follows:
(1) From 1978 to 2016, the apple acreage and output in China increased by 1.64 million ha and 41.61 million tons, but the proportion of apple acreage in total fruit acreage decreased from 40.98% in 1978 to 17.90% in 2016, the proportion of apple output accounted for fruit total output dropped from 34.63% in 1978 to 24.22% in 2016. This showed that the contribution of technological progress to China’s apple output growth ranked first, that is, technological progress driving higher yield leads to a slower decline in the proportion of apple output than a decrease in the proportion of apple acreage.
(2) Analysis at both the national and provincial scales showed that the expansion of apple acreage and the increase in yield were the main driving factors for increasing apple output in China. The contribution of yield was greater than the acreage contribution, indicating that variety improvement, cultivation technology innovation, orchard equipment and infrastructure upgrade, technological advancements, the improvement of fruit farmers’ quality were the main reasons for the apple output increase in China.
(3) From 1978 to 2016, apple output in 23 apple-producing provinces showed varying degrees of growth. Among them, the apple output increase in 8 provinces exceeded 1 million tons, accounted for 92.67% of the total increase in apple output nationwide. There were 13 provinces with a super-growth increase in apple output, and 10 provinces with a lagging-growth increase, 4 provinces have increased apple output for more than 30 years. It showed that the combination of government policy guidance and market selection incentives promoted the apple production distribution to predominant areas and special production areas, the regional concentration of the apple industry increased, and the regional scale economies of the apple industry were significant.
(4) China’s apple production barycenter has gradually shifted to and concentrated on the Loess Plateau and the Bohai Bay predominant areas since 1978, of which Shaanxi and Shandong were the two major provinces for apple production. The barycenter of apple production showed the characteristics of “moving westward and expanding southward”. The barycenter of apple acreage and output moved 506.63 kilometers and 574.12 kilometers to the southwest and shifted to the Loess Plateau. This evolutionary trend was in line with the national apple industry layout plan and industry policy objective, and laid the foundation for the effective use of agricultural resources advantages in the eugenic and special production areas.
This study only discussed the evolutionary characteristics of apple production spatial distribution in China from 1978 to 2016 using the LMDI decomposition method and barycenter analysis model, thus providing some insights concerning where practice and research may evolve in the future. The impact mechanism of apple production spatial distribution must be elucidated for further analysis, and it is necessary to adopt some spatial econometric techniques to analyze the driving factors affecting the changes in China’s apple production layout in future research.
REFERENCES
- ANG B. et al. Handling zero values in the logarithmic mean divisia index decomposition approach. Energy Policy, v.35, n.1, p.238-246, 2007. Available from: <Available from: http://www.sciencedirect.com/science/article/pii/S0301421505002995 >. Accessed: Mar. 18, 2020. doi: 10.1016/j.enpol.2005.11.001.
» https://doi.org/10.1016/j.enpol.2005.11.001.» http://www.sciencedirect.com/science/article/pii/S0301421505002995 - BAI X. et al. Empirical studies on the climate change and variation of regional apple production structure in China. Economic Geography, v.35, n.6, p.130-137, 2015. Available from: <Available from: https://kns.cnki.net/KCMS/detail/detail.aspx?FileName=JJDL201506018&DbName=CJFQ2015 >. Accessed: Mar. 19, 2020. doi: 10.15957/j.cnki.jjdl.2015.06.018.
» https://doi.org/10.15957/j.cnki.jjdl.2015.06.018.» https://kns.cnki.net/KCMS/detail/detail.aspx?FileName=JJDL201506018&DbName=CJFQ2015 - DING W. et al. Analysis on growth pattern and trend of fruit industry in China: take citrus for example. World agriculture, 12, p.148-155, 2017. Available from: <Available from: https://kns.cnki.net/KCMS/detail/detail.aspx?FileName=SJNY201712024&DbName=CJFQ2017 >. Accessed: Mar. 19, 2018. doi: 10.13856/j.cn11-1097/s.2017.12.023.
» https://doi.org/10.13856/j.cn11-1097/s.2017.12.023.» https://kns.cnki.net/KCMS/detail/detail.aspx?FileName=SJNY201712024&DbName=CJFQ2017 - FENG X. et al. Total factor productivity of apple industry in China considering non-point source pollution and its spatial concentration analysis. Transactions of the Chinese Society of Agricultural Engineering (Transactions of the CSAE), v.31, n.18, p.204-211, 2015. Available from: <Available from: http://d.wanfangdata.com.cn/periodical/nygcxb201518029 >. Accessed: Apr. 19, 2018. doi: 10.11975/j.issn.1002-6819.2015.18.029.
» https://doi.org/10.11975/j.issn.1002-6819.2015.18.029.» http://d.wanfangdata.com.cn/periodical/nygcxb201518029 - FENG Z. et al. Study on the spatiotemporal patterns and contribution factors of China’s grain output increase during 2003-2013. Journal of Natural Resources, v.31, n.6, p.895-907, 2016. Available from: <Available from: https://kns.cnki.net/KCMS/detail/detail.aspx?FileName=ZRZX201606001&DbName=CJFQ2016 >. Accessed: Nov. 19, 2017. ISBN/ISSN: 1000-3037.
» https://kns.cnki.net/KCMS/detail/detail.aspx?FileName=ZRZX201606001&DbName=CJFQ2016 - INOUYE A. et al. Fresh Deciduous Fruit Annual-China. USDA Foreign Agricultural Service Report. 2019. Available from: <Available from: https://www.fas.usda.gov/data/china-fresh-deciduous-fruit-annual-3 >. Accessed: Jan. 19, 2020.
» https://www.fas.usda.gov/data/china-fresh-deciduous-fruit-annual-3 - LI, E. et al. Analyzing agricultural agglomeration in China. Sustainability, v.9, n.2, e.313, 2017. Available from: <Available from: http://www.mdpi.com/2071-1050/9/2/313 >. Accessed: Jan. 19, 2018. doi: 10.3390/su9020313.
» https://doi.org/10.3390/su9020313.» http://www.mdpi.com/2071-1050/9/2/313 - LIN S. et al. The dynamic evolvement procedure of population and economic gravity center in Hunan from 1990s. Economic Geography , v.34, n.10, p.31-38, 2014. Available from: <Available from: https://kns.cnki.net/KCMS/detail/detail.aspx?FileName=JJDL201410005&DbName=CJFQ2014 >. Accessed: Jan. 19, 2015. doi: 10.15957/j.cnki.jjdl.2014.10.035.
» https://doi.org/10.15957/j.cnki.jjdl.2014.10.035.» https://kns.cnki.net/KCMS/detail/detail.aspx?FileName=JJDL201410005&DbName=CJFQ2014 - LIU H. et al. An empirical study on spatial-temporal dynamics and influencing factors of tea production in China. Sustainability, v.10, n.9, e.3037, 2018. Available from: <Available from: http://www.mdpi.com/2071-1050/10/9/3037 >. Accessed: Jan. 19, 2019. doi: 10.3390/su10093037.
» https://doi.org/10.3390/su10093037.» http://www.mdpi.com/2071-1050/10/9/3037 - LIU T. et al. Analysis of the influencing factor and layout of major apple production in China. Issues in Agricultural Economy, v.33, n.10, 36-42, 2012. Available from: <Available from: https://kns.cnki.net/KCMS/detail/detail.aspx?FileName=NJWT201210007&DbName=CJFQ2012 >. Accessed: Jan. 19, 2014. doi: 10.13246/j.cnki.iae.2012.10.007.
» https://doi.org/10.13246/j.cnki.iae.2012.10.007.» https://kns.cnki.net/KCMS/detail/detail.aspx?FileName=NJWT201210007&DbName=CJFQ2012 - LIU, Y. Apple Industry in China. China Agricultural University, PhD dissertation: Beijing, China. 2005. Available from: <Available from: https://kns.cnki.net/kcms/detail/detail.aspx?FileName=2005084993.nh&DbName=CDFD2005 >. Accessed: Jan. 29, 2015.
» https://kns.cnki.net/kcms/detail/detail.aspx?FileName=2005084993.nh&DbName=CDFD2005 - MA, W. Linking apple farmers to markets: Determinants and impacts of marketing contracts in China. China Agricultural Economic Review, v.8, n.1, p.2-21, 2016. Available from: <Available from: http://www.emeraldinsight.com/doi/full-xml/10.1108/CAER-04-2015-0035 >. Accessed: Jan. 19, 2017. doi: 10.1108/CAER-04-2015-0035.
» https://doi.org/10.1108/CAER-04-2015-0035.» http://www.emeraldinsight.com/doi/full-xml/10.1108/CAER-04-2015-0035 - MENG, G. et al. The shift route and future expectations of economic development center of gravity in Tianjin. Economic Geography , v.37, n.5, p.87-93, 2017. Available from: <Available from: https://kns.cnki.net/KCMS/detail/detail.aspx?FileName=JJDL201705012&DbName=CJFQ2017 >. Accessed: Jan. 19, 2018. doi: 10.15957/j.cnki.jjdl.2017.05.012.
» https://doi.org/10.15957/j.cnki.jjdl.2017.05.012.» https://kns.cnki.net/KCMS/detail/detail.aspx?FileName=JJDL201705012&DbName=CJFQ2017 - Ministry of Agriculture and Rural Affairs of the People’s Republic of China (MARA). China Apple Industry Development Report: 1995-2005. China Agricultural Press: Beijing, China. 2007. Available from: <Available from: https://spu.jd.com/1079722397.html >. Accessed: Jan. 19, 2015. ISBN: 9787109116269.
» https://spu.jd.com/1079722397.html - National Bureau of Statistics of China (NBSC). New China Agricultural Statistics for 60 Years. China Statistics Press: Beijing, China. 2009. Available from: <Available from: https://navi.cnki.net/knavi/YearbookDetail?pcode=CYFD&pykm=YXZGE >. Accessed: Jan. 19, 2012. ISBN: 7-5037-3402-7/F.1286.
» https://navi.cnki.net/knavi/YearbookDetail?pcode=CYFD&pykm=YXZGE - National Bureau of Statistics of China (NBSC). Chinese Agricultural Statistics. China Statistics Press: Beijing, China, 2017. Available from: <Available from: https://navi.cnki.net/knavi/YearbookDetail?pcode=CYFD&pykm=YZGNT >. Accessed: Jan. 19, 2018. ISBN: 978-7-109-25511-1.
» https://navi.cnki.net/knavi/YearbookDetail?pcode=CYFD&pykm=YZGNT - National Bureau of Statistics of China (NBSC). China Rural Statistical Yearbook. China Statistics Press: Beijing, China, 1985-2017. Available from: <Available from: https://navi.cnki.net/knavi/YearbookDetail?pcode=CYFD&pykm=YMCTJ >. Accessed: Jan. 19, 2018. ISBN: 978-7-5037-9033-1.
» https://navi.cnki.net/knavi/YearbookDetail?pcode=CYFD&pykm=YMCTJ - NIE L. et al. The evolution analysis of the grain production concentration in China. Research of Agricultural Modernization, v.36, n.3, p.380-386, 2015. Available from: <Available from: https://kns.cnki.net/KCMS/detail/detail.aspx?FileName=NXDH201503010&DbName=CJFQ2015 >. Accessed: Jan. 19, 2016. doi:10.13872/j.1000-0275.2015.0044.
» https://kns.cnki.net/KCMS/detail/detail.aspx?FileName=NXDH201503010&DbName=CJFQ2015 - ROURKE D. O. World Apple Review-2018. Belrose, Inc.: Washington, USA. 2019. Available from: <Available from: https://www.e-belrose.com/product/world-apple-review-2018-annual >. Accessed: Jan. 19, 2020. SKU: AR2018.
» https://www.e-belrose.com/product/world-apple-review-2018-annual - SUN, C. et al. Temporal and spatial evolution of green efficiency of water resources in China and its convergence analysis. Progress in Geography, v.37, n.7, p.901-911, 2018. Available from: <Available from: https://kns.cnki.net/KCMS/detail/detail.aspx?FileName=DLKJ201807004&DbName=CJFQ2018 >. Accessed: Jan. 19, 2019. ISBN/ISSN: 1007-6301.
» https://kns.cnki.net/KCMS/detail/detail.aspx?FileName=DLKJ201807004&DbName=CJFQ2018 - USDA Foreign Agricultural Service. Fresh Apples, Grapes, and Pears: World Markets and Trade. Washington, D.C. 2019. Available from: <Available from: https://downloads.usda.library.cornell.edu/usda-esmis/files/1z40ks800/pc289z933/3484zz05r/fruit.pdf >. Accessed: Jan. 19, 2020.
» https://downloads.usda.library.cornell.edu/usda-esmis/files/1z40ks800/pc289z933/3484zz05r/fruit.pdf - WANG J. et al. Decomposition of influencing factors and its spatial-temporal characteristics of vegetable production: A case study of China. Information Processing in Agriculture, v.5, n.4, p.477-489, 2018. Available from: <Available from: https://www.sciencedirect.com/science/article/pii/S2214317317300896 >. Accessed: Jan. 19, 2019. doi: 10.1016/j.inpa.2018.06.004.
» https://doi.org/10.1016/j.inpa.2018.06.004.» https://www.sciencedirect.com/science/article/pii/S2214317317300896 - XIAO, Z. et al. Spatio-temporal variation and the driving forces of tea production in China over the last 30 years. Journal of Geographical Sciences, v.28, n.3, 275-290, 2018. Available from: <Available from: https://link.springer.com/article/10.1007/s11442-018-1472-2 >. Accessed: Jan. 19, 2019. doi: 10.1007/s11442-018-1472-2.
» https://doi.org/10.1007/s11442-018-1472-2.» https://link.springer.com/article/10.1007/s11442-018-1472-2 - XU, G. et al. Evolvement analysis of the economic gravity center and economic development gravity center in the regions of South China Sea during 1991-2011. Resources Science, v.36, n.4, p.682-690, 2014. Available from: <Available from: https://kns.cnki.net/KCMS/detail/detail.aspx?FileName=ZRZY201404003&DbName=CJFQ2014 >. Accessed: Jan. 19, 2018. ISBN/ISSN: 1007-7588.
» https://kns.cnki.net/KCMS/detail/detail.aspx?FileName=ZRZY201404003&DbName=CJFQ2014 - XU Y et al. 2015. Analysis on the pattern change and influence factors of apple production in China. Information Engineering Research Inst: Newark, USA. ISBN: 2160-1070-978-1-61275-070-5.
- YANG W. et al. Studies on the spatial distribution changing of China’s rice production and its influencing factors. Economic Geography , v.31, n.12, p.2086-2093, 2011. Available from: <Available from: https://kns.cnki.net/KCMS/detail/detail.aspx?FileName=JJDL201112025&DbName=CJFQ2011 >. Accessed: Jan. 19, 2019. doi: 10.15957/j.cnki.jjdl.2011.12.025.
» https://doi.org/10.15957/j.cnki.jjdl.2011.12.025.» https://kns.cnki.net/KCMS/detail/detail.aspx?FileName=JJDL201112025&DbName=CJFQ2011 - YU J. et al. The temporal and spatial evaluation on China’s agricultural policy output since 1978. Journal of Geographical Sciences, v.21, n.3, p.475-488, 2011. Available from: <Available from: https://link.springer.com/article/10.1007/s11442-011-0858-1 >. Accessed: Jan. 19, 2018. doi: 10.1007/s11442-011-0858-1.
» https://doi.org/10.1007/s11442-011-0858-1.» https://link.springer.com/article/10.1007/s11442-011-0858-1 - YUAN, B. et al. Spatial pattern evolution and its driving factors for apple industry in China: Based on micro perspective of farmers’ decision making. Journal of Arid Land Resources and Environment, v.31, n.6, p.32-37, 2017. Available from: <Available from: https://kns.cnki.net/KCMS/detail/detail.aspx?FileName=GHZH201706006&DbName=CJFQ2017 >. Accessed: Jan. 19, 2018. doi: 10.13448/j.cnki.jalre.2017.175.
» https://doi.org/10.13448/j.cnki.jalre.2017.175.» https://kns.cnki.net/KCMS/detail/detail.aspx?FileName=GHZH201706006&DbName=CJFQ2017 - ZHANG, C. et al. Analysis on the layout of China’s apple production transition. Economic Geography , v.38, n.8, p.141-151, 2018. Available from: <Available from: http://kns.cnki.net/kcms/detail/detail.aspx?FileName=JJDL201808018&DbName=DKFX2018 >. Accessed: Jan. 19, 2019. doi: 10.15957/j.cnki.jjdl.2018.08.01.
» https://doi.org/10.15957/j.cnki.jjdl.2018.08.01.» http://kns.cnki.net/kcms/detail/detail.aspx?FileName=JJDL201808018&DbName=DKFX2018 - ZHANG, F. et al. Spatial agglomeration analysis of production efficiency in China’s main apple production area based on SBM and Malmquist index. Journal of Agrotechnical Economics, n.5, p.57-66, 2017. Available from: <Available from: http://kns.cnki.net/kcms/detail/detail.aspx?FileName=NYJS201705006&DbName=CJFQ2017 >. Accessed: Jan. 19, 2018. doi: 10.13246/j.cnki.jae.2017.05.006.
» https://doi.org/10.13246/j.cnki.jae.2017.05.006.» http://kns.cnki.net/kcms/detail/detail.aspx?FileName=NYJS201705006&DbName=CJFQ2017 - ZHANG, Q. et al. Spatiotemporal pattern of fruit output increase in China from 1978 to 2016 and the contribution factors. Journal of Arid Land Resources and Environment, v.33, n.10, p.65-71, 2019. Available from: <Available from: http://kns.cnki.net/kcms/detail/detail.aspx?FileName=GHZH201910011&DbName=CJFQ2019 >. Accessed: Jan. 19, 2020. doi: 10.13448/j.cnki.jalre.2019.289.
» https://doi.org/10.13448/j.cnki.jalre.2019.289.» http://kns.cnki.net/kcms/detail/detail.aspx?FileName=GHZH201910011&DbName=CJFQ2019 - ZHANG, Y. et al. Analysis on the change of peanut production distribution in China. Journal of Agrotechnical Economics, n.9, p.112-122, 2018. Available from: <Available from: http://kns.cnki.net/kcms/detail/detail.aspx?FileName=NYJS201809010&DbName=DKFX2018 >. Accessed: Jan. 19, 2019. doi: 10.13246/j.cnki.jae.2018.09.010.
» https://doi.org/10.13246/j.cnki.jae.2018.09.010.» http://kns.cnki.net/kcms/detail/detail.aspx?FileName=NYJS201809010&DbName=DKFX2018 - ZHU J. et al. Analysis on China’s nine-year consecutive grain production growth: contribution and future potential of inter-crop structural adjustment. Issues in Agricultural Economy, v.34, n.11, p.36-43, 2013. Available from: <Available from: http://kns.cnki.net/kcms/detail/detail.aspx?FileName=NJWT201311006&DbName=CJFQ2013 >. Accessed: Jan. 19, 2019. doi: 10.13246/j.cnki.iae.2013.11.012.
» https://doi.org/10.13246/j.cnki.iae.2013.11.012.» http://kns.cnki.net/kcms/detail/detail.aspx?FileName=NJWT201311006&DbName=CJFQ2013
-
CR-2020-0688.R1
Publication Dates
-
Publication in this collection
31 Mar 2021 -
Date of issue
2021
History
-
Received
23 July 2020 -
Accepted
16 Nov 2020 -
Reviewed
31 Dec 2020