ABSTRACT:
This study was conducted to establish the pattern and the spatial associations of the Amazon commercial tree groups. In a region extending across 2,000 ha in the Tapajós National Forest (FNT), Pará, a forest census was conducted. The census included commercial trees of perimeter at breast height (PBH), equal to or greater than 158 cm and the Cartesian coordinates of their bearings. Using Ripley’s K function, the spatial pattern was discerned, with 5 m radius being assumed, and maximum distances varying up to 1,500 m. Then, with 99.8% probability for both, 500 Monte Carlo simulations were performed for the univariate K function, and 500 toroidal simulations were done for the bivariate function.The commercial tree groups, which revealed an aggregated spatial pattern in a minimum of approximately 50% of the analysis distance were namely, Astronium lecointei, Bagassa guianensis, Couratari guianensis, Manilkara huberi, Mezilaurus itauba, and Vochysia maxima. In Brazil, the commercial tree groups, based on the commercialization criteria for tropical trees show random and aggregated spatial patterns with associations of spatial independence.
Key words:
Ripley’s K; Amazon; spatialization of forest species
RESUMO:
O objetivo do trabalho foi determinar o padrão espacial e a associação espacial de grupos de árvores comerciais da Amazônia.Realizou-se um censo florestal em uma área de 2.000 ha localizada na Floresta Nacional do Tapajós (FNT), Pará. No censo coletou-se a circunferência à altura do peito (CAP), igualou superior a 158 cm e as coordenadas cartesianas das árvores comerciais. Para determinar o padrão espacial foi utilizada a função K de Ripley assumindo um raio de 5 m, variando a uma distância máxima de 1.500 m. Para a função K univariada foram realizadas 500 simulações Monte Carlo e para a função bivariada foram realizadas 500 simulações toroidais, ambas com 99,8% de probabilidade. Os grupos de árvores comerciais que possuíram padrão espacial agregado em no mínimo 50% da distância de análise foram Astronium lecointei, Bagassa guianensis, Couratari guianensis, Manilkara huberi, Mezilaurus itauba, Vochysia maxima. Grupos de árvores comerciais, segundo critério de comercialização para árvores tropicais no Brasil, seguem um padrão espacial aleatório e agregado e possuem associações espaciais de independência espacial.
Palavras-chave:
K de Ripley; Amazônia; espacialização de espécies florestais
INTRODUCTION:
The spatial distribution of species is an effective tool that helps deduce the spatial dependence of species and their patterns of distribution, supplying crucial subsidies for sustainable forest management methods (PEREIRA et al., 2006PEREIRA, A. A.; NETTO, S. P.; CARVALHO, L. M. T. Analysis of the spatial distribution of Jequitibá Rosa in a seasonal sub-montane forest. Rev. Academica, v.4, n.2, p.21-34, 2006. Available from: <Available from: https://periodicos.pucpr.br/index.php/cienciaanimal/article/view/9321/8967 >. Accessed: Aug. 10, 2018. doi: 10.7213/cienciaanimal.v4i2.9321.
https://periodicos.pucpr.br/index.php/ci...
). Several biomes, and forest formations continue to be researched in many such studies.
In northern Roraima, in the Amazon, the Alexacanaracunensis population growing in a seasonal semi-deciduous submontane forest displayed a regular pattern (OLIVEIRA et al., 2018OLIVEIRA, R. L.; et al.,Population structure and spatial distribution of Alexacanaracunensis in a seasonal semi-deciduous sub-montane forest in northern Roraima, Brazilian Amazon. Electronic Magazine Casa de Makunaima, v.1, n.2, p.100-109.2018 Available from: <Available from: https://periodicos.uerr.edu.br/index.php/casa_de_makunaima/article/view/462 >. Accessed: Aug. 18, 2018. doi: 10.24979/makunaima.v1i2.462.
https://periodicos.uerr.edu.br/index.php...
), while in Floresta de Várzea, the Carapa spp. Adult trees were found in an aggregated spatial distribution pattern (ABREU et al., 2014ABREU, J. C.; et al., Structure and spatial distribution of andirobeiras (Carapa spp.) In lowland forest in the Amazon estuary. Ciência Florestal, v.24, n.4, p.1009-1019, 2014. Available from: <Available from: https://www.scielo.br/scielo.php?script=sci_arttext&pid=S1980-50982014000401009 >. Accessed: Mar. 20, 2019. doi: 10.1590/1980-509820142404020.
https://www.scielo.br/scielo.php?script=...
). The Cabraleacanjerana, observed in a deciduous Seasonal Forest, shows an aggregated type of dispersion (ZIMMERMANN et al., 2014ZIMMERMANN, A. P. L.; LIRA, D. F. S.; FLEIG, F. D. Spatial structure and distribution of natural regeneration of canjerana in seasonal deciduous forest. Brazilian forest research, v.34, n.80, p.369-373, 2014. Availablefrom: <Availablefrom: https://pfb.cnpf.embrapa.br/pfb/index.php/pfb/article/view/586 >. Accessed: Jun. 25, 2018. doi: 10.4336/2014.pfb.34.80.586.
https://pfb.cnpf.embrapa.br/pfb/index.ph...
).In fact, NASCIMENTO et al., (2001) and SILVESTRE et al., (2012SILVESTRE, R.; et al., Structural analysis and spatial distribution in remnants of mixed rain forest, Guarapuava (PR). Ambience, v.8, n.2, p.259-274, 2012. Available from: <Available from: https://revistas.unicentro.br/index.php/ambiencia/article/view/1114 >. Accessed: Jun. 25, 2018. doi: 10.5777/ambiencia.2012.02.03.
https://revistas.unicentro.br/index.php/...
) in their examination of the whole community in a Mixed Ombrophilous Forest, identified a prominent aggregated distribution. In the Pantanal, the trees revealed a grouped spatial distribution in a semi deciduous forest (LEHN et al., 2008LEHN, C. R.; et al. Structure and spatial distribution of Trichiliaelegans A. Juss. (Meliaceae) in a semi-deciduousforest in the Nhecolândia Pantanal, Mato Grosso do Sul, Brazil. Revista Biologia Neotropical, v.5, n.2, p.1-9, 2008. Available from: <Available from: https://www.revistas.ufg.br/index.php/RBN/article/view/9810 >. Accessed: Aug. 10, 2018. doi: 10.5216/rbn.v5i2.9810.
https://www.revistas.ufg.br/index.php/RB...
). In a small portion of the cerrado, limited in the southwest of Goiás, an aggregated spatial distribution pattern was noted (BERNASOL & LIMA-RIBEIRO, 2010BERNASOL, W. P.; LIMA-RIBEIRO, M. S. Spatial and diametric structure of arboreal species and their conditions in a cerrado fragment restricted in the southwest of Goiás. Hoehnea, v.37, n.2, p.181-198, 2010. Available from: <Available from: https://www.scielo.br/scielo.php?script=sci_arttext&pid=S2236-89062010000200001&lng=pt&tlng=pt >. Accessed: Jan. 15, 2019. doi: 10.1590/S2236-89062010000200001.
https://www.scielo.br/scielo.php?script=...
). However, for the commercial species groups, there continues to be a lack of data on sustainable forest management.
In managed forests in the Amazon, the commercial trees refer to the ones with a diameter at breast height (DBH) ≥ 50 cm (BRASIL, 2006BRAZIL. Normative Instruction 05, of December 11, 2006. Provides for technical procedures for the elaboration, presentation, execution and technical evaluation of Sustainable Forest Management Plans-PMFS in primitive forests and their forms of succession in the Legal Amazon, and other measures. Federal Official Gazette, Brasília, DF, December 13. 2006. Section 1, p.155.). Commercial trees set the guidelines for complete harvest planning and the silvicultural activities that must follow. Therefore, specific and precise information for these tree groups is crucial to direct the activity levels, in order to guarantee the ecosystem-sustaining mechanisms because a disordered exploitation of forest resources,not based on any scientific rationale in terms of the spatial distribution pattern, can have unfavorable repercussions on a given plant community (SILVESTRE et al., 2012SILVESTRE, R.; et al., Structural analysis and spatial distribution in remnants of mixed rain forest, Guarapuava (PR). Ambience, v.8, n.2, p.259-274, 2012. Available from: <Available from: https://revistas.unicentro.br/index.php/ambiencia/article/view/1114 >. Accessed: Jun. 25, 2018. doi: 10.5777/ambiencia.2012.02.03.
https://revistas.unicentro.br/index.php/...
).
Commercial trees are not necessarily grouped into specific ecological groups, based on their characteristic features. However, the superior traits of emergence, wood density and growth rate, which are common norms for the identification of an exploited species, can be caused simply as reactions to the unique conditions prevalent in specific habitat. Therefore, thorough knowledge of the habitat conditions will establish the limits within which a particular species can survive (HUTCHINSON, 1957HUTCHINSON, M. F. Concluding remarks. Cold Spring Harbor Symposium on Quantitative Biology, v.22, p.415-427, 1957. Available from: <Available from: http://symposium.cshlp.org/content/22/415 >. Accessed: Mar. 18, 2019. doi: 10.1101 / SQB.1957.022.01.039.
http://symposium.cshlp.org/content/22/41...
); this enables us to hypothesize the presence of spatial associations, which exist between the species selected on the basis of these superior traits.
Most often; however, the data on which decisions are made for these tree groups are not based either on their grouping or spatial associations. This has been the cause for the errors in ascertaining the sampling method, volumetric estimates, post-exploration activities, monitoring, a few specific silvicultural activities, as well as in other forest management-relatedactivities.
According to HIGUCHI et al., (2011HIGUCHI, P. et al. Spatial associations between individuals of different species of Miconia spp. Ruiz &pav. (Melastomataceae). Revista Árvore, vol.35, n.3, p.381-389, 2011. Available from: <Available from: http://www.scielo.br/scielo.php?pid=S0100-67622011000300002&script=sci_abstract&tlng=pt >. Accessed: Mar. 18, 2019. doi: 10.1590 / S0100-67622011000300002.
http://www.scielo.br/scielo.php?pid=S010...
) accurate information regarding the spatial pattern and associations are essential to establish proper conservation strategies within the limits of sustainable management. The spatial pattern indicates the geographical distribution of a tree group, which can assume environmental homogeneity or aggregation in the most conducive regions of the habitat (FIGUEIRA, 1998FIGUEIRA, J. E. C. Dynamics of Paepalanthuspolyanthus (Eriocaulaceae) in the Serra do Cipó, MG. 1998. 119f. Dissertation (Master in Ecology) - Course in Ecology, Federal University of Campinas.) or the negative relationships between individuals (FOWLER, 1986FOWLER, N. The role of competition in plant communities in arid and semiarid regions. Annual Review of Ecology and Systematics, v.17, p.89-110, 1986. Available from: <Available from: https://www.annualreviews.org/doi/abs/10.1146/annurev.es.17.110186.000513 >. Accessed: Mar. 02, 2019. doi: 10.1146 / annurev.es.17.110186.000513.
https://www.annualreviews.org/doi/abs/10...
).
In the case of adult trees, their spatial pattern is often a reflection of the recruitment pattern and the effect of the mortality factors, which may show differences in intensity among the various locations (CRAWLEY, 1986CRAWLEY, M. J. Plant Ecology. Oxford: Blackwell Scientific Publications, 1986. 186p.), but within the same population, in terms of classsizes. These differences are affected by the abiotic variables namely, relief, light and nutrient availability, as well as by biotic factors, namely, seed dispersal, and intraspecific and interspecific competition (CAPRETZ, 2004CAPRETZ, R. L. Analysis of spatial patterns of trees in four forest formations in the state of São Paulo, through second-order analysis, such as the Ripley K function. 2004. 79f. Dissertation (Master in Agrosystems Ecology) - Postgraduate Course in Agrosystems Ecology, Escola Superior de AgriculturaLuiz de Queiroz.). These determining factors must be understood, as they are basic to a clear appreciation of the spatial pattern of a particular forest population.
Spatial associations reveal the manner in which different tree groups relate to each other, assuming their demands for the same habitat, habitat partition and competitive exclusion of the population (HIGUCHI et al., 2011HIGUCHI, P. et al. Spatial associations between individuals of different species of Miconia spp. Ruiz &pav. (Melastomataceae). Revista Árvore, vol.35, n.3, p.381-389, 2011. Available from: <Available from: http://www.scielo.br/scielo.php?pid=S0100-67622011000300002&script=sci_abstract&tlng=pt >. Accessed: Mar. 18, 2019. doi: 10.1590 / S0100-67622011000300002.
http://www.scielo.br/scielo.php?pid=S010...
). Sound knowledge of these factors is vital, as these can influence growth, mortality, and certain ecological characteristics introduced through forest management, such as thinning, harvesting and enrichment (CHEN & BRADSHAW, 1999CHEN, J; BRADSHAW, G. A. Forest structure in space: a case study of an old growth spruce-fir forest in Changbaishan Natural Reserve, PR China. Forest Ecology and Management, v.120, p.219-233, 1999. Available from: <Available from: https://www.sciencedirect.com/science/article/abs/pii/S037811279800543X >. Accessed: Jan. 15, 2019. doi: 10.1016/S0378-1127 (98) 00543-X.
https://www.sciencedirect.com/science/ar...
).
Hence, this study examined the spatial pattern and associations of the commercial tree groups in the Amazon.
MATERIALS AND METHODS:
Study area
This study was conducted in the forest management area of the Cooperativa Mista Flona do Tapajós (COOMFLONA). COMFLONA is situated in the Tapajós National Forest (FNT), in the Belterra municipality, in the state of Pará, Brazil, extending across an area of 527,319 ha, lying between the geographical coordinates of 2º 45’ and 4º 10’ “S” and 54º 45’ and 55º 30’ “W” (ICMBio, 2019ICMBio. Tapajós National Forest - Management Plan : Volume I - Diagnosis. 2019. Online. Available from: <Available from: https://www.icmbio.gov.br/portal/unidadesdeconservacao/biomas-brasileiros/amazonia/unidades-de-conservacao-amazonia/1963-flona-do-tapajos >. Accessed: Mar. 01, 2020.
https://www.icmbio.gov.br/portal/unidade...
) (Figure 1).

Location map of the Annual Production Units (UPA) 08 and 09 in the Tapajós National Forest, Belterra, Pará.
The FNT is situated in the Dense Rainforestregion, with the characteristic large-sized trees, ranging in height from 25 to 50 m (IBGE, 1990IBGE. Project zoning the potential of natural resources in the Legal Amazon. Rio de Janeiro: IBGE, 1990. 212p.). Based on the Köppen classification, the Ami type of climate prevails in this region, with annual accumulated precipitation of 1,983 mm/year and annual average temperature of 25.5 °C. The soil is clayey in texture and of the Dystrophic Yellow Latosol type, showing a smooth and gently wavy relief (ESPÍRITO-SANTO, 2003ESPÍRITO-SANTO, F. D. B. Characterization and mapping of vegetation in the region of the National Forest of Tapajós through optical data, radar and forest inventories. 2003. 277f. Dissertation (Master in Remote Sensing) - Postgraduate Course in Remote Sensing, National Institute for Space Research, São José dos Campos.).
Data collection
In this study, we used the forestry census data from two FNT Annual Production Units, extending across a total of 2,000 ha. During the census, the data collected in the study area for the commercial tree group species, included the perimeter at breast height (PBH), equal to or greater than 158 cm. To classify a tree as a commercial variety, the criteria employed in the FNT are based on IN 05/2006 (BRASIL, 2006BRAZIL. Normative Instruction 05, of December 11, 2006. Provides for technical procedures for the elaboration, presentation, execution and technical evaluation of Sustainable Forest Management Plans-PMFS in primitive forests and their forms of succession in the Legal Amazon, and other measures. Federal Official Gazette, Brasília, DF, December 13. 2006. Section 1, p.155.) as well as the parameters determined by the cooperative.For the tree to be considered a commercial variety, it must necessarily have at chest height, a diameter (DBH) ≥ 50 cm, without a split or conical shaft, but with a straight or slightly tortuous shaft. Besides the dendrometer data, the Cartesian coordinates of the trees sampled were recorded (GARCIA et al., 2015GARCIA, J.S. et al. Community forest management practices. Santarém: Federal University of Western Pará, 2015. 44p.).
Data analysis
The tree groups measured
In the forest census, the group of commercial trees measured included, Apuleia moralis Spruce ex Benth., Astronium lecointei Ducke, Bagassa guianensis Aubl. Couratari guianensis Aubl. Hymenaea parvifolia Huber, Hymenolobium petraeum Ducke, Lecythis Pisonis Cambess., Manilkara huberi (Ducke) Chevalier, Mezilaurus itauba (Meisn.) Taub. Ex Mez and Vochysia maxima Ducke.
Ripley K univariate
An analysis was done of the spatial pattern of the ten species that were measured, limiting the analysis to only those trees that were deemed commercially, using Ripley’s K function. Ripley’s K function ranks high among the most accurate statistical techniques to determine spatial patterns and associations. Normally, the K function is dependent upon counting and distance. It analyzes the pattern and spatial relationships based on the real coordinates (x, y) of the trees and in the analysis, it employs this data for the distances between the trees (ANJOS et al., 2004ANJOS, A. et al. Analysis of the spatial distribution pattern of the araucaria (Araucariaaugustifolia) in some areas of the state of Paraná, using Ripley’s K function. Scientia Forestalis, n.66, p.38-45, 2004. Available from: <Available from: https://www.ipef.br/publicacoes/scientia/nr66.asp >. Accessed: Feb. 20, 2017.
https://www.ipef.br/publicacoes/scientia...
; WIEGAND & MOLONEY, 2004WIEGAND, T.; MOLONEY, K. A. Rings, circles, and null-models for point pattern analysis in ecology. Oikos, v.104, n.2, p.209-229, 2004. Available from: <Available from: https://onlinelibrary.wiley.com/doi/abs/10.1111/j.0030-1299.2004.12497.x >. Accessed: Jun. 25, 2018. doi: 10.1111 / j.0030-1299.2004.12497.x.
https://onlinelibrary.wiley.com/doi/abs/...
).
Ripley’s univariate K (RIPLEY, 1977RIPLEY, B. D. Modeling spatial patterns. Journal of the Royal Statistical Society, v.39, n.2, p.172-212, 1977. Available from: <Available from: https://doi.org/10.1111/j.2517-6161.1977.tb01615.x >. Accessed: Aug. 10, 2018. doi: 10.1111/j.2517-6161.1977.tb01615.x.
https://doi.org/10.1111/j.2517-6161.1977...
) uses, in the analysis procedure, a circle of radius s centered on each point (tree) and a count of the number of neighbors within the circle (KUULUVAINEN & ROUVINEN, 2000KUULUVAINEN, T.; ROUVINEN, S. Post-fire understorey regeneration in boreal Pinus sylvestris forest sites with different fire histories. Journal of Vegetation Science, v.11, n.11, p.801-812, 2000. Available from: <Available from: https://onlinelibrary.wiley.com/doi/abs/10.2307/3236550 >. Accessed: Aug. 10, 2018. doi: 10.2307 / 3236550.
https://onlinelibrary.wiley.com/doi/abs/...
). With this process, the average number of trees around each different tree is evaluated according to a certain distance. In this manner, the value of s = 5 m was assumed for all analyses performed in the study, with the radius varying up to a maximum distance of 1,500 m.
In this study, 500 simulations (m) were performed, with 99.8% probability ((1 / (1 + m)) x 100%) in the Complete Spatial Randomness model, using the Monte Carlo tests, and the different values of K were determined. The trust envelopes were constructed using the lowest and highest K values. In the analysis, the isotropic border correction was employed to correct the likelihood of having trees on the edge of the study area that would not have formed some complete circles (RIPLEY, 1977RIPLEY, B. D. Modeling spatial patterns. Journal of the Royal Statistical Society, v.39, n.2, p.172-212, 1977. Available from: <Available from: https://doi.org/10.1111/j.2517-6161.1977.tb01615.x >. Accessed: Aug. 10, 2018. doi: 10.1111/j.2517-6161.1977.tb01615.x.
https://doi.org/10.1111/j.2517-6161.1977...
).
The K function was then calculated for the actual data, by comparing the pattern observed with the confidence envelopes constructed. To make this analysis easier, the values of the function of were transformed into (RIPLEY, 1979RIPLEY, B. D. Tests of randomness for spatial patterns. Journal of the Royal Statistic Society, v.41, n.3, p.368-374, 1979. Available from: <Available from: https://doi.org/10.1051/ps/2012027 >. Accessed: Aug. 15, 2018. doi: 10.1051/ps/2012027.
https://doi.org/10.1051/ps/2012027...
), and distributed graphically, so that the abscissa and ordinate axes; respectively, indicated the accumulated distances and transformed values of the K function.
, s >0.
where, is the transformed function.
According to the trust envelopes defined by two graphically dotted lines, if the values of observed fall within the envelopes constructed, the spatial pattern is termed randomly. The spatial pattern is termed aggregated if the function exceeds the upper limit, andregular when it falls below this limit (WIEGAND & MOLONEY, 2004WIEGAND, T.; MOLONEY, K. A. Rings, circles, and null-models for point pattern analysis in ecology. Oikos, v.104, n.2, p.209-229, 2004. Available from: <Available from: https://onlinelibrary.wiley.com/doi/abs/10.1111/j.0030-1299.2004.12497.x >. Accessed: Jun. 25, 2018. doi: 10.1111 / j.0030-1299.2004.12497.x.
https://onlinelibrary.wiley.com/doi/abs/...
).
K by Ripley Bivariate
Ripley’s bivariate K function was used (RIPLEY, 1981RIPLEY, B.D. Spatial statistics. New York: WileyIEEE, 1981. 252p.) to analyze the spatial relationships between commercial tree groups together, but belonging to different species. It enables the assessment of the independence present between the tree groups, produced via different processes (BAROT et al., 1999BAROT, S. et al. Demography of savanna palm tree: predictions from comprehensive spatial pattern analyzes. Ecology, v.80, n.6, p.1987-2005, 1999. Available from: <Available from: https://www.jstor.org/stable/176673 >. Accessed: Jan. 15, 2019. doi: 10.2307 / 176673.
https://www.jstor.org/stable/176673...
). The association relationships obtained through an analysis of the commercial tree groups having a spatial pattern equal to or higher than 50% of the analysis distance of the univariate K function in an aggregated distribution were in relation to the other groups.
To estimate the bivariate Ripley’s K function (DIXON, 2002DIXON, P. M. Ripley’s K function. In: ABDEL H. Encyclopedia of Environmetrics. Chichester: El-Shaarawi/John Wiley & Sons, 2002. v.3, p.1796-1803.), Ripley’s estimator was employed similar to the manner it was used in the univariate case. The complete spatial independence between species was analyzed using 500 toroidal simulations (BAROT et al., 1999BAROT, S. et al. Demography of savanna palm tree: predictions from comprehensive spatial pattern analyzes. Ecology, v.80, n.6, p.1987-2005, 1999. Available from: <Available from: https://www.jstor.org/stable/176673 >. Accessed: Jan. 15, 2019. doi: 10.2307 / 176673.
https://www.jstor.org/stable/176673...
), to produce reliable envelopes, with the probability of 99.8%.
When the function values exceeded the upper limit, it was indicative of a positive association (attraction); when the values dropped to less than the lower limit it indicated a negative association (repulsion) and when the values fell within the trust envelopes it revealed total spatial independence.
To process the Ripley’s K function, data processing and analysis were conducted employing the R Core Team (2017) R CORE TEAM (2017). A: A Language and environment for statistical computing. R Foundation for Statistical Computing, Vienna, Austria. Available from: <Available from: https://cran.r-project.org/ >. Accessed: Mar. 18, 2018.
https://cran.r-project.org/...
3.4.2 software, using the RStudio platform and the Splancs package (ROWLINGSON & DIGGLE, 1993ROWLINGSON, B.; DIGGLE, P. Splancs: spatial point pattern analysis code in s-plus. Computers and Geosciences, v.19, n.5, p.627-655, 1993. Available from: <Available from: https://doi.org/10.1016/0098-3004(93)90099-Q >. Accessed: Jun. 25, 2018. doi: 10.1016/0098-3004(93)90099-Q.
https://doi.org/10.1016/0098-3004(93)900...
).
RESULTS AND DISCUSSION:
Treegroups measured
Among the 10 species examined in this study, a total of 7,858 commercial trees were measured. While 23.13% of them possessed a straight shaft, 76.87% revealed a slightly tortuous shaft. The DBH showed a mean of 74.37 cm, and the average standard deviation was 21.11 cm.
Ripley K univariate
The tree group densities per hectare included 0.10 of A. moralis, 0.13 of A. lecointei, 0.12 of B. guianensis, 1.20 of C. guianensis, 0.19 of H. parvifolia, 0.06 of H. petraeum, 0.24 of L. pisonis, 0.45 of M. huberi, 0.25 of M. itauba and 1.21 of V. maxima. The low density of the trees according to species was observed, because of the basis on which the trees were classified as commercial. When forest management in the tropical regions is considered, low tree densities (ALVES & MIRANDA, 2008ALVES, J. C. Z. O.; MIRANDA, I. S. Analysis of the structure of tree communities in an Amazonian Terra Firme forest applied to forest management. Acta Amazonica, v.38, n.4, p.657- 666, 2008. Available from: <Available from: https://doi.org/10.1590/S0044-59672008000400008 >. Accessed: Mar. 20, 2019. doi: 10.1590/S0044-59672008000400008.
https://doi.org/10.1590/S0044-5967200800...
; CONDÉ & TONINI, 2013CONDÉ, T. M.; TONINI, H. Phytosociology of a dense ombrophilous Forest in the Northern Amazon, Roraima, Brazil. Acta Amazonica , v.43, n.3, p.247-260, 2013. Available from: <Available from: https://doi.org/10.1590/S0044-59672013000300002 >. Accessed: Feb. 01, 2019. doi: 10.1590/S0044-59672013000300002.
https://doi.org/10.1590/S0044-5967201300...
) necessitate prudent planning and execution of the forest activities, particularly in the event of long-term planning, such as in the future cutting cycles considering production, as it takes considerable time for the trees to achieve the minimum cut diameter and desired wood quality. It must be remembered that commercial trees are the ones possessing traits superior to other trees, for instance, in terms of diameter and shaft quality.
On visual inspection, the commercial tree groups indicate low density, with greater number of trees per hectare for V. maxima and C. guianensis, whose density is more than one tree (Figure 2). The commercial tree groups revealed low density in some locations and occur as clusters in other areas, showing higher density. This confirmed the necessity for planning specific management strategies, like conserving a particular number of trees belonging to the same species in different locations, in the area under management. This could reduce the effects on species that reveal greater specialization in certain habitats, like those with an aggregated spatial pattern (ALVES & MIRANDA, 2008ALVES, J. C. Z. O.; MIRANDA, I. S. Analysis of the structure of tree communities in an Amazonian Terra Firme forest applied to forest management. Acta Amazonica, v.38, n.4, p.657- 666, 2008. Available from: <Available from: https://doi.org/10.1590/S0044-59672008000400008 >. Accessed: Mar. 20, 2019. doi: 10.1590/S0044-59672008000400008.
https://doi.org/10.1590/S0044-5967200800...
).

Location of the commercial trees of the species investigated in the 2,000-ha area, in the Tapajós National Forest, Belterra, Pará.
Most of the commercial tree groups listed in figure 3 show spatial patterns, which vary between aggregated and random, and only one group displays a pattern without any variations. Such variations may be connected to how this particular group is established, in different environments. Considering the fact, that in different environments, [five orders of soil and fourteen phytophysiognomies, as was observed in the FNT, (IBGE, 2012IBGE. Technical Manual of the Brazilian vegetation. 2nd edition revised and expanded. Rio de Janeiro: [s.n.], 2012. 271p.)], there is a heterogeneity of the resources available, as well as competition for the nutrient and water resources.

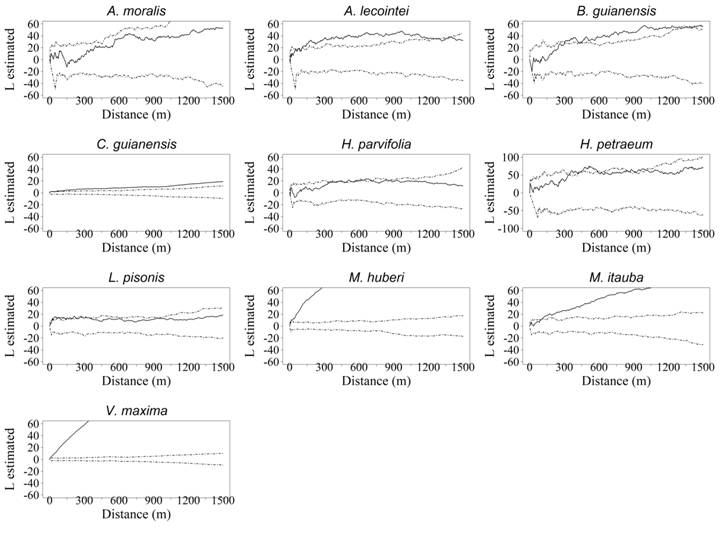
Spatial pattern obtained utilizing the univariate K function for the commercial species from the Tapajós National Forest, Belterra, Pará. The continuous line represents the univariate Ripley K function, while the dotted lines indicate the confidence intervals of the CAE simulations, with probability of 99.8%.
Knowledge regarding the spatial pattern can be considered step one, in the examination of the variables that ascertain the spatial configuration and that promote the natural distribution of the species (DALMASO et al., 2012DALMASO, C. A. et al. Analysis of the spatial patterns of Ocoteaodorifera (Vell.) Rohwer in the national forest of Irati, PR in a GIS environment. Ambience, v.8, special issue, p.559-570, 2012. Available from: <Available from: https://revistas.unicentro.br/index.php/ambiencia/article/view/1913/1773 >. Accessed: Aug. 05, 2019. doi: 10.5777/ambiencia.2012.04.10.
https://revistas.unicentro.br/index.php/...
). For most of the commercial tree groups studied, the spatial pattern may show variations induced by environmental gradients, namely luminosity (BRENES-ARGUEDAS et al., 2010BRENES-ARGUEDAS, T. et al. Do differences in understory light contribute to species distributions along a tropical rainfall gradient? Acta Oecologia, v.166, n.2, p.443-456, 2010. Available from: <Available from: https://link.springer.com/article/10.1007/s00442-010-1832-9 >. Accessed: Jun. 25, 2018. doi: 10.1007 / s00442-010-1832-9.
https://link.springer.com/article/10.100...
), precipitation (ESPÍRITO-SANTO, 2003ESPÍRITO-SANTO, F. D. B. Characterization and mapping of vegetation in the region of the National Forest of Tapajós through optical data, radar and forest inventories. 2003. 277f. Dissertation (Master in Remote Sensing) - Postgraduate Course in Remote Sensing, National Institute for Space Research, São José dos Campos.) and inter- and intra-specific relationships (IBAMA, 2004IBAMA. Tapajós National Forest - Management Plan. Brasília: IBAMA, 2004. 580p.).
Such variations in the pattern exhibited by the same tree groups suggest that they can be established in various environments and their populations will display this combination of patterns (DIXON, 2002DIXON, P. M. Ripley’s K function. In: ABDEL H. Encyclopedia of Environmetrics. Chichester: El-Shaarawi/John Wiley & Sons, 2002. v.3, p.1796-1803.). In forest management, commercial tree groups showing these spatial pattern variations (between random and aggregated) are beneficial because they imply a low degree of specialization during their establishment. For groups displaying this trait, the intensity of disturbances can prove to be crucial to their colonization, making it mandatory to monitor these different environments.
According to ARMESTO et al., (1986ARMESTO, J. J. et al. A comparison of spatial patterns of trees in some tropical and temperate forests. Biotropica, v.18, n.1, p.1-11. 1986. Available from: <Available from: https://www.jstor.org/stable/2388354 >. Accessed: Jan. 15, 2019. doi: 10.2307 / 2388354.
https://www.jstor.org/stable/2388354...
) the regular pattern is rare in tropical forests, an observation also noted in the FNT. No tree group investigated revealed this spatial pattern. Therefore, regular distribution is observed only when a high degree of competition exists between the trees or when spatial repulsion is evident, encouraging spacing by maintaining the minimum distance between the trees at a constant (ODUM & BARRETT, 2008ODUM, E. P.; BARRETT, G. W. Fundamentals of Ecology. São Paulo: Cengage Learning , 2008. 612p.); these factors were absent among the tree groups examined in the area of this study.
Most tree groups of interest that showed variations in their spatial patterns exhibited a random spatial pattern in the initial distance of a few meters. The trees in the tropical forests; however, more frequently displayed the aggregated spatial pattern (HUBBELL, 1979HUBBELL, S. P. Tree Dispersion, Abundance, and Diversity in a Tropical Dry Forest. Science, v.203, n.4387, p.1299-1309, 1979. Available from: <Available from: https://science.sciencemag.org/content/203/4387/1299/tab-pdf >. Accessed: Mar. 18, 2019. doi: 10.1126 / science.203.4387.1299.
https://science.sciencemag.org/content/2...
). This occurred because of the high capacity for seed dispersal, habitat availability and conducive microclimatic conditions (CAPRETZ, 2004CAPRETZ, R. L. Analysis of spatial patterns of trees in four forest formations in the state of São Paulo, through second-order analysis, such as the Ripley K function. 2004. 79f. Dissertation (Master in Agrosystems Ecology) - Postgraduate Course in Agrosystems Ecology, Escola Superior de AgriculturaLuiz de Queiroz.). The commercial tree groups, including the species A. lecointei, B. guianensis, C. guianensis, M. huberi, M. itauba and V. maxima revealed the aggregated pattern, when the value was equal to or greater than 50% of the distance analyzed. This spatial pattern can suggested that the commercial tree groups have limited dispersion in relation with the propagule source, or that they are demanding under particular micro-environmental conditions (BRUZINGA et al., 2013BRUZINGA, J. S. et al. Spatial distribution of adult Pequi individuals. Scientia Forestalis, v.42, n.98, p.249-256, 2013. Available from: <Available from: http://www.ipef.br/publicacoes/scientia/ >. Accessed: Feb. 25, 2019.
http://www.ipef.br/publicacoes/scientia/...
).
The success of the establishment of these trees in the FNT can be hampered by some variables. Only C. guianensis veered away from this hypothesis because it achieved a density of 1.20 trees per hectare, in which event, its aggregated pattern does not involve any difficulty in its getting established. This is likely indicative of the dense aggregations, which raises the demand for resources, thus triggering an escalation in the intraspecific competition, which in turn causes density-dependent mortality (CRAWLEY, 1986CRAWLEY, M. J. Plant Ecology. Oxford: Blackwell Scientific Publications, 1986. 186p.).
Most commercial tree groups showing an aggregated pattern in a minimum of 50% of the area under study exhibit zoochoric dispersion, indicative of a likely limitation in seed dispersal. A. lecointei seeds were dispersed anemochorically, those of while B. guianensis were dispersed zoochorically (AMARAL et al., 2009AMARAL, D. D. et al. Checklist of tree flora from forest remnants in the metropolitan region of Belém and historical value of fragments, Pará, Brazil. Bulletin of the Museu Paraense Emílio Goeldi, v.4, n.3, p.231-289, 2009. Availablefrom: <Availablefrom: http://scielo.iec.gov.br/scielo.php?script=sci_arttext&pid=S1981-81142009000300002 >. Accessed: Mar. 22, 2019.
http://scielo.iec.gov.br/scielo.php?scri...
), as was C. Guianensis, M. huberi, and M. itauba; in the case of V. maxima, the seed dispersal is anemochoric, but during the green stage of the fruits, bird-attacks are common (SILVA, 2006SILVA, S. Trees of the Amazon: Brazil. São Paulo: Empresa das Artes, 2006. 243p.).
The commercial tree groups showing an aggregated pattern report a record of harvested volume, much higher than any other group analyzed in this study, probably because of the effortlessness for displacement in the field, as one tree will be close to another, the intensity with which they are explored. These are some factors that intensify the requirement for specific research to encourage the forest management of this tree group, with the focus on future cutting cycles and their conservation.
Ripley K bivariate
Specific spatial patterns occurring in forests are in accordance with the spatial dependence on the forest variables like density (CONDÉ et al., 2016CONDÉ, T. M. et al. Spatial pattern of timber species in the Amazon using the Cartesian and spatial coordinate methods. Brazilian forest research, v.36, n.86, p.115-125, 2016. Available from: <Available from: https://doi.org/10.4336/2016.pfb.36.86.1111 >. Accessed: Jan. 15, 2019. doi: 10.4336/2016.pfb.36.86.1111.
https://doi.org/10.4336/2016.pfb.36.86.1...
). Spatial associations are normally the reasons on which the tree groupings of certain species are based (PERRY & DIXON, 2002PERRY, J. N.; DIXON, P. M. A new method to measure spatial association forecological count data. Ecoscience, v.9, n.2, p.133-141, 2002. Available from: <Available from: https://doi.org/10.1080/11956860.2002.11682699 >. Accessed: Aug. 10, 2018. doi: 10.1080/11956860.2002.11682699.
https://doi.org/10.1080/11956860.2002.11...
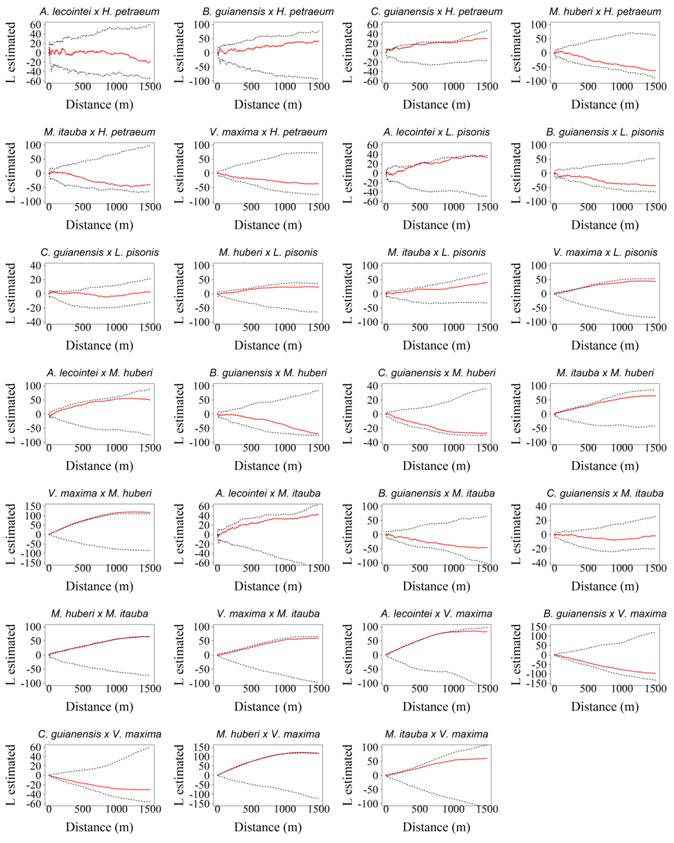
). Hence, the commercial tree groups, which exhibited an aggregated spatial pattern in a minimum of 50% of the distance analyzed (A. lecointei, B. guianensis, C. guianensis, M. huberi, M. itauba, and V. maxima) achieved the associations analyzed in relation with the other tree groups. The spatial associations of the commercial tree groups are displayed below, in which it can be noted that function values exceeding the upper limit implied a positive association (attraction), while values below the lower limit suggested negative association (repulsion) and values, which fell within the trust envelopes were indicative of total spatial independence (Figures 4 and 5).

- Spatial association obtained with the bivariate K function for the commercial species from the Tapajós National Forest, Belterra, Pará. The continuous line represents the bivariate Ripley K function, while the dotted lines indicate the confidence intervals of the CIE simulations, with probability of 98.9%.

Spatial association obtained with the bivariate K function for the commercial species from the Tapajós National Forest, Belterra, Pará. The continuous line represents the bivariate Ripley K function, while the dotted lines indicate the confidence intervals of the CIE simulations, with probability of 98.9%.
The commercial tree groups of A. lecointei showed variations ranging from a positive association to spatial independence, the trees of interest being, L. pisonis, V. maxima and C. guianensis. The commercial tree groups of B. guianensis showed variations ranging from a positive association to spatial independence only for C. guianensis. This commercial tree group of C. guianensis showed variations ranging from a positive association to spatial independence with the trees of interest of H. petraeum and A. lecointei. The commercial tree group of M. huberi showed variations ranging from a positive association to spatial independence with the trees of interest of M. itauba and V. maxima. The commercial tree groups of M. itauba showed variations ranging from a positive association to spatial independence with the tree of interest, V. maxima, and previously, with the tree of interest of B. guianensis, the variations were evident from a negative association to spatial independence. The commercial tree groups of V. maxima showed variations ranging from a positive association to spatial independence with the trees of interest of A. lecointei, and M. huberi with the trees of interest by M. itauba.
Usually, the associations identified were most frequently seen with the commercial tree groups that showed an aggregated pattern, at a distance value greater than 50%, using the univariate function. Among the 12 positive and 1 negative associations, only 2 positive ones were with the commercial tree groups having the random pattern as the predominant one. The associations were observed between the trees of interest of species, A. lecointei with L. pisonis and C. guianensis with H. petraeum.
It is likely that most of the associations were evident between the tree groups, which exhibited a predominantly aggregated pattern because of the preferential environmental traits these groups possessed, namely, identical dispersers for the different tree groups examined.
Among the 54 possible associations, 41 showed spatial independence. Most tree groups analyzed were found throughout the study area, which implied that there was no space for establishing commercial tree groups that compete, for instance, for the same number of nutrients and light intensity.
Most of the associations observed were due to attraction, suggesting that no competition existed between the trees. The positive result was because these are tree groups of high commercial interest and strongly exploited in the area. However, the absence of competition may be due, most likely, to the abundant resources available, which implies urgent caution for conserving the current ecosystem. Interspecific competition is either completely absent or occurs at a low rate because of the abundance of resources (PIANKA, 1994PIANKA, E. R. Evolutionary ecology. New York: Harper Collins College Publishers, 1994. 486p.). Another explanation could be that only two species or tree groups coexist in the same space, in which the niche of one species is not occupied with the niche of the other one, and they are not competing for the same resources (MACARTHUR & LEVINS, 1967MACARTHUR, R. H.; LEVINS, R. The limiting similarity, convergence and divergence of coexisting species. American Naturalist, v.101, n.921, p.377-385, 1967. Available from: <https://doi.org/10.1086/282505>. Accessed: Aug. 10, 2018. doi: 10.1086 / 282505.
https://doi.org/10.1086/282505...
; ABRAMS, 1983ABRAMS, P. The theory of limiting similarity. Annual Review of Ecology and Systematics, v.14, p.359-376, 1983. Available from: <Available from: https://doi.org/10.1146/annurev.es.14.110183.002043 >. Accessed: Mar. 20, 2019. doi: 10.1146 / annurev.es.14.110183.002043.
https://doi.org/10.1146/annurev.es.14.11...
).
Regarding the negative association observed between the trees of interest for M. itauba with those of B. guianensis, repulsion probably arises due to the competition for the same ecological niche. The commercial tree groups, which use identical resources cannot coexist in the same space, and thus the tree group that has greater efficiency in using the resources excludes the other. Or the most probable hypothesis is that the tree groups possess only ecological requirements that differ from each other. The trees of interest of M. itauba are categorized as shade-tolerant, while the trees of interest of the pioneer group B. guianensis (OLIVEIRA, 2005OLIVEIRA, L. C. Effect of logging and different thinning intensities on the dynamics of vegetation in an area of 136ha in the Tapajós National Forest. 2005. 183f. Thesis (Doctorate in Forest Resources) - Postgraduate Course in Forest Resources, Escola Superior de Agricultura Luiz de Queiroz, Piracicaba.), in this respect have different needs.
Irrespective of the limiting factor, it is evident that the commercial tree group of B. guianensis is not found to the same density level, in the same areas as the trees of interest as are the trees of M. itauba (Figure 2). This repulsion relationship could rank among the causes for the low density of the commercial trees of this species, in the area under study.
CONCLUSION:
The commercial tree groups, based on the commercialization criteria for tropical trees in Brazil reveal a spatial association that swings between the random and aggregated pattern, with neither group revealing the regular pattern. The trees of interest belonging to species A. lecointei, B. guianensis, C. guianensis, M. huberi, M. itauba and V. maxima revealed an aggregated pattern. Most of the space relationships were of the spatial independence type. Normally, no competition was observed between the commercial tree groups analyzed in this study.
ACKNOWLEGDMENTS
The authors are grateful to the Coordenação de Aperfeiçoamento de Pessoal de Nível Superior - Brazil (CAPES) - Financing Code 001, for the support extended until the completion of this study. Universidade Federal dos Vales do Jequitinhonha e Mucuri (UFVJM) also provide support for this work.
REFERENCES
- ABRAMS, P. The theory of limiting similarity. Annual Review of Ecology and Systematics, v.14, p.359-376, 1983. Available from: <Available from: https://doi.org/10.1146/annurev.es.14.110183.002043 >. Accessed: Mar. 20, 2019. doi: 10.1146 / annurev.es.14.110183.002043.
» https://doi.org/10.1146 / annurev.es.14.110183.002043.» https://doi.org/10.1146/annurev.es.14.110183.002043 - ABREU, J. C.; et al., Structure and spatial distribution of andirobeiras (Carapa spp.) In lowland forest in the Amazon estuary. Ciência Florestal, v.24, n.4, p.1009-1019, 2014. Available from: <Available from: https://www.scielo.br/scielo.php?script=sci_arttext&pid=S1980-50982014000401009 >. Accessed: Mar. 20, 2019. doi: 10.1590/1980-509820142404020.
» https://doi.org/10.1590/1980-509820142404020.» https://www.scielo.br/scielo.php?script=sci_arttext&pid=S1980-50982014000401009 - ALVES, J. C. Z. O.; MIRANDA, I. S. Analysis of the structure of tree communities in an Amazonian Terra Firme forest applied to forest management. Acta Amazonica, v.38, n.4, p.657- 666, 2008. Available from: <Available from: https://doi.org/10.1590/S0044-59672008000400008 >. Accessed: Mar. 20, 2019. doi: 10.1590/S0044-59672008000400008.
» https://doi.org/10.1590/S0044-59672008000400008.» https://doi.org/10.1590/S0044-59672008000400008 - AMARAL, D. D. et al. Checklist of tree flora from forest remnants in the metropolitan region of Belém and historical value of fragments, Pará, Brazil. Bulletin of the Museu Paraense Emílio Goeldi, v.4, n.3, p.231-289, 2009. Availablefrom: <Availablefrom: http://scielo.iec.gov.br/scielo.php?script=sci_arttext&pid=S1981-81142009000300002 >. Accessed: Mar. 22, 2019.
» http://scielo.iec.gov.br/scielo.php?script=sci_arttext&pid=S1981-81142009000300002 - ANJOS, A. et al. Analysis of the spatial distribution pattern of the araucaria (Araucariaaugustifolia) in some areas of the state of Paraná, using Ripley’s K function. Scientia Forestalis, n.66, p.38-45, 2004. Available from: <Available from: https://www.ipef.br/publicacoes/scientia/nr66.asp >. Accessed: Feb. 20, 2017.
» https://www.ipef.br/publicacoes/scientia/nr66.asp - ARMESTO, J. J. et al. A comparison of spatial patterns of trees in some tropical and temperate forests. Biotropica, v.18, n.1, p.1-11. 1986. Available from: <Available from: https://www.jstor.org/stable/2388354 >. Accessed: Jan. 15, 2019. doi: 10.2307 / 2388354.
» https://doi.org/10.2307 / 2388354.» https://www.jstor.org/stable/2388354 - BAROT, S. et al. Demography of savanna palm tree: predictions from comprehensive spatial pattern analyzes. Ecology, v.80, n.6, p.1987-2005, 1999. Available from: <Available from: https://www.jstor.org/stable/176673 >. Accessed: Jan. 15, 2019. doi: 10.2307 / 176673.
» https://doi.org/10.2307 / 176673.» https://www.jstor.org/stable/176673 - BERNASOL, W. P.; LIMA-RIBEIRO, M. S. Spatial and diametric structure of arboreal species and their conditions in a cerrado fragment restricted in the southwest of Goiás. Hoehnea, v.37, n.2, p.181-198, 2010. Available from: <Available from: https://www.scielo.br/scielo.php?script=sci_arttext&pid=S2236-89062010000200001&lng=pt&tlng=pt >. Accessed: Jan. 15, 2019. doi: 10.1590/S2236-89062010000200001.
» https://doi.org/10.1590/S2236-89062010000200001.» https://www.scielo.br/scielo.php?script=sci_arttext&pid=S2236-89062010000200001&lng=pt&tlng=pt - BRAZIL. Normative Instruction 05, of December 11, 2006. Provides for technical procedures for the elaboration, presentation, execution and technical evaluation of Sustainable Forest Management Plans-PMFS in primitive forests and their forms of succession in the Legal Amazon, and other measures. Federal Official Gazette, Brasília, DF, December 13. 2006. Section 1, p.155.
- BRENES-ARGUEDAS, T. et al. Do differences in understory light contribute to species distributions along a tropical rainfall gradient? Acta Oecologia, v.166, n.2, p.443-456, 2010. Available from: <Available from: https://link.springer.com/article/10.1007/s00442-010-1832-9 >. Accessed: Jun. 25, 2018. doi: 10.1007 / s00442-010-1832-9.
» https://doi.org/10.1007 / s00442-010-1832-9.» https://link.springer.com/article/10.1007/s00442-010-1832-9 - BRUZINGA, J. S. et al. Spatial distribution of adult Pequi individuals. Scientia Forestalis, v.42, n.98, p.249-256, 2013. Available from: <Available from: http://www.ipef.br/publicacoes/scientia/ >. Accessed: Feb. 25, 2019.
» http://www.ipef.br/publicacoes/scientia/ - CAPRETZ, R. L. Analysis of spatial patterns of trees in four forest formations in the state of São Paulo, through second-order analysis, such as the Ripley K function. 2004. 79f. Dissertation (Master in Agrosystems Ecology) - Postgraduate Course in Agrosystems Ecology, Escola Superior de AgriculturaLuiz de Queiroz.
- CHEN, J; BRADSHAW, G. A. Forest structure in space: a case study of an old growth spruce-fir forest in Changbaishan Natural Reserve, PR China. Forest Ecology and Management, v.120, p.219-233, 1999. Available from: <Available from: https://www.sciencedirect.com/science/article/abs/pii/S037811279800543X >. Accessed: Jan. 15, 2019. doi: 10.1016/S0378-1127 (98) 00543-X.
» https://doi.org/10.1016/S0378-1127 (98) 00543-X.» https://www.sciencedirect.com/science/article/abs/pii/S037811279800543X - CONDÉ, T. M. et al. Spatial pattern of timber species in the Amazon using the Cartesian and spatial coordinate methods. Brazilian forest research, v.36, n.86, p.115-125, 2016. Available from: <Available from: https://doi.org/10.4336/2016.pfb.36.86.1111 >. Accessed: Jan. 15, 2019. doi: 10.4336/2016.pfb.36.86.1111.
» https://doi.org/10.4336/2016.pfb.36.86.1111.» https://doi.org/10.4336/2016.pfb.36.86.1111 - CONDÉ, T. M.; TONINI, H. Phytosociology of a dense ombrophilous Forest in the Northern Amazon, Roraima, Brazil. Acta Amazonica , v.43, n.3, p.247-260, 2013. Available from: <Available from: https://doi.org/10.1590/S0044-59672013000300002 >. Accessed: Feb. 01, 2019. doi: 10.1590/S0044-59672013000300002.
» https://doi.org/10.1590/S0044-59672013000300002.» https://doi.org/10.1590/S0044-59672013000300002 - CRAWLEY, M. J. Plant Ecology. Oxford: Blackwell Scientific Publications, 1986. 186p.
- DALMASO, C. A. et al. Analysis of the spatial patterns of Ocoteaodorifera (Vell.) Rohwer in the national forest of Irati, PR in a GIS environment. Ambience, v.8, special issue, p.559-570, 2012. Available from: <Available from: https://revistas.unicentro.br/index.php/ambiencia/article/view/1913/1773 >. Accessed: Aug. 05, 2019. doi: 10.5777/ambiencia.2012.04.10.
» https://doi.org/10.5777/ambiencia.2012.04.10.» https://revistas.unicentro.br/index.php/ambiencia/article/view/1913/1773 - DIXON, P. M. Ripley’s K function. In: ABDEL H. Encyclopedia of Environmetrics. Chichester: El-Shaarawi/John Wiley & Sons, 2002. v.3, p.1796-1803.
- ESPÍRITO-SANTO, F. D. B. Characterization and mapping of vegetation in the region of the National Forest of Tapajós through optical data, radar and forest inventories. 2003. 277f. Dissertation (Master in Remote Sensing) - Postgraduate Course in Remote Sensing, National Institute for Space Research, São José dos Campos.
- FIGUEIRA, J. E. C. Dynamics of Paepalanthuspolyanthus (Eriocaulaceae) in the Serra do Cipó, MG. 1998. 119f. Dissertation (Master in Ecology) - Course in Ecology, Federal University of Campinas.
- FOWLER, N. The role of competition in plant communities in arid and semiarid regions. Annual Review of Ecology and Systematics, v.17, p.89-110, 1986. Available from: <Available from: https://www.annualreviews.org/doi/abs/10.1146/annurev.es.17.110186.000513 >. Accessed: Mar. 02, 2019. doi: 10.1146 / annurev.es.17.110186.000513.
» https://doi.org/10.1146 / annurev.es.17.110186.000513.» https://www.annualreviews.org/doi/abs/10.1146/annurev.es.17.110186.000513 - GARCIA, J.S. et al. Community forest management practices. Santarém: Federal University of Western Pará, 2015. 44p.
- HIGUCHI, P. et al. Spatial associations between individuals of different species of Miconia spp. Ruiz &pav. (Melastomataceae). Revista Árvore, vol.35, n.3, p.381-389, 2011. Available from: <Available from: http://www.scielo.br/scielo.php?pid=S0100-67622011000300002&script=sci_abstract&tlng=pt >. Accessed: Mar. 18, 2019. doi: 10.1590 / S0100-67622011000300002.
» http://www.scielo.br/scielo.php?pid=S0100-67622011000300002&script=sci_abstract&tlng=pt - HUBBELL, S. P. Tree Dispersion, Abundance, and Diversity in a Tropical Dry Forest. Science, v.203, n.4387, p.1299-1309, 1979. Available from: <Available from: https://science.sciencemag.org/content/203/4387/1299/tab-pdf >. Accessed: Mar. 18, 2019. doi: 10.1126 / science.203.4387.1299.
» https://science.sciencemag.org/content/203/4387/1299/tab-pdf - HUTCHINSON, M. F. Concluding remarks. Cold Spring Harbor Symposium on Quantitative Biology, v.22, p.415-427, 1957. Available from: <Available from: http://symposium.cshlp.org/content/22/415 >. Accessed: Mar. 18, 2019. doi: 10.1101 / SQB.1957.022.01.039.
» https://doi.org/10.1101 / SQB.1957.022.01.039.» http://symposium.cshlp.org/content/22/415 - IBAMA. Tapajós National Forest - Management Plan. Brasília: IBAMA, 2004. 580p.
- IBGE. Technical Manual of the Brazilian vegetation. 2nd edition revised and expanded. Rio de Janeiro: [s.n.], 2012. 271p.
- IBGE. Project zoning the potential of natural resources in the Legal Amazon. Rio de Janeiro: IBGE, 1990. 212p.
- ICMBio. Tapajós National Forest - Management Plan : Volume I - Diagnosis. 2019. Online. Available from: <Available from: https://www.icmbio.gov.br/portal/unidadesdeconservacao/biomas-brasileiros/amazonia/unidades-de-conservacao-amazonia/1963-flona-do-tapajos >. Accessed: Mar. 01, 2020.
» https://www.icmbio.gov.br/portal/unidadesdeconservacao/biomas-brasileiros/amazonia/unidades-de-conservacao-amazonia/1963-flona-do-tapajos - KUULUVAINEN, T.; ROUVINEN, S. Post-fire understorey regeneration in boreal Pinus sylvestris forest sites with different fire histories. Journal of Vegetation Science, v.11, n.11, p.801-812, 2000. Available from: <Available from: https://onlinelibrary.wiley.com/doi/abs/10.2307/3236550 >. Accessed: Aug. 10, 2018. doi: 10.2307 / 3236550.
» https://doi.org/10.2307 / 3236550.» https://onlinelibrary.wiley.com/doi/abs/10.2307/3236550 - LEHN, C. R.; et al. Structure and spatial distribution of Trichiliaelegans A. Juss. (Meliaceae) in a semi-deciduousforest in the Nhecolândia Pantanal, Mato Grosso do Sul, Brazil. Revista Biologia Neotropical, v.5, n.2, p.1-9, 2008. Available from: <Available from: https://www.revistas.ufg.br/index.php/RBN/article/view/9810 >. Accessed: Aug. 10, 2018. doi: 10.5216/rbn.v5i2.9810.
» https://doi.org/10.5216/rbn.v5i2.9810.» https://www.revistas.ufg.br/index.php/RBN/article/view/9810 - MACARTHUR, R. H.; LEVINS, R. The limiting similarity, convergence and divergence of coexisting species. American Naturalist, v.101, n.921, p.377-385, 1967. Available from: <https://doi.org/10.1086/282505>. Accessed: Aug. 10, 2018. doi: 10.1086 / 282505.
» https://doi.org/10, 2018. doi: 10.1086 / 282505» https://doi.org/10.1086/282505 - ODUM, E. P.; BARRETT, G. W. Fundamentals of Ecology. São Paulo: Cengage Learning , 2008. 612p.
- OLIVEIRA, L. C. Effect of logging and different thinning intensities on the dynamics of vegetation in an area of 136ha in the Tapajós National Forest. 2005. 183f. Thesis (Doctorate in Forest Resources) - Postgraduate Course in Forest Resources, Escola Superior de Agricultura Luiz de Queiroz, Piracicaba.
- OLIVEIRA, R. L.; et al.,Population structure and spatial distribution of Alexacanaracunensis in a seasonal semi-deciduous sub-montane forest in northern Roraima, Brazilian Amazon. Electronic Magazine Casa de Makunaima, v.1, n.2, p.100-109.2018 Available from: <Available from: https://periodicos.uerr.edu.br/index.php/casa_de_makunaima/article/view/462 >. Accessed: Aug. 18, 2018. doi: 10.24979/makunaima.v1i2.462.
» https://doi.org/10.24979/makunaima.v1i2.462.» https://periodicos.uerr.edu.br/index.php/casa_de_makunaima/article/view/462 - PEREIRA, A. A.; NETTO, S. P.; CARVALHO, L. M. T. Analysis of the spatial distribution of Jequitibá Rosa in a seasonal sub-montane forest. Rev. Academica, v.4, n.2, p.21-34, 2006. Available from: <Available from: https://periodicos.pucpr.br/index.php/cienciaanimal/article/view/9321/8967 >. Accessed: Aug. 10, 2018. doi: 10.7213/cienciaanimal.v4i2.9321.
» https://doi.org/10.7213/cienciaanimal.v4i2.9321.» https://periodicos.pucpr.br/index.php/cienciaanimal/article/view/9321/8967 - PERRY, J. N.; DIXON, P. M. A new method to measure spatial association forecological count data. Ecoscience, v.9, n.2, p.133-141, 2002. Available from: <Available from: https://doi.org/10.1080/11956860.2002.11682699 >. Accessed: Aug. 10, 2018. doi: 10.1080/11956860.2002.11682699.
» https://doi.org/10.1080/11956860.2002.11682699.» https://doi.org/10.1080/11956860.2002.11682699 - PIANKA, E. R. Evolutionary ecology. New York: Harper Collins College Publishers, 1994. 486p.
- R CORE TEAM (2017). A: A Language and environment for statistical computing. R Foundation for Statistical Computing, Vienna, Austria. Available from: <Available from: https://cran.r-project.org/ >. Accessed: Mar. 18, 2018.
» https://cran.r-project.org/ - RIPLEY, B. D. Modeling spatial patterns. Journal of the Royal Statistical Society, v.39, n.2, p.172-212, 1977. Available from: <Available from: https://doi.org/10.1111/j.2517-6161.1977.tb01615.x >. Accessed: Aug. 10, 2018. doi: 10.1111/j.2517-6161.1977.tb01615.x.
» https://doi.org/10.1111/j.2517-6161.1977.tb01615.x.» https://doi.org/10.1111/j.2517-6161.1977.tb01615.x - RIPLEY, B.D. Spatial statistics. New York: WileyIEEE, 1981. 252p.
- RIPLEY, B. D. Tests of randomness for spatial patterns. Journal of the Royal Statistic Society, v.41, n.3, p.368-374, 1979. Available from: <Available from: https://doi.org/10.1051/ps/2012027 >. Accessed: Aug. 15, 2018. doi: 10.1051/ps/2012027.
» https://doi.org/10.1051/ps/2012027» https://doi.org/10.1051/ps/2012027 - ROWLINGSON, B.; DIGGLE, P. Splancs: spatial point pattern analysis code in s-plus. Computers and Geosciences, v.19, n.5, p.627-655, 1993. Available from: <Available from: https://doi.org/10.1016/0098-3004(93)90099-Q >. Accessed: Jun. 25, 2018. doi: 10.1016/0098-3004(93)90099-Q.
» https://doi.org/10.1016/0098-3004(93)90099-Q.» https://doi.org/10.1016/0098-3004(93)90099-Q - SILVA, S. Trees of the Amazon: Brazil. São Paulo: Empresa das Artes, 2006. 243p.
- SILVESTRE, R.; et al., Structural analysis and spatial distribution in remnants of mixed rain forest, Guarapuava (PR). Ambience, v.8, n.2, p.259-274, 2012. Available from: <Available from: https://revistas.unicentro.br/index.php/ambiencia/article/view/1114 >. Accessed: Jun. 25, 2018. doi: 10.5777/ambiencia.2012.02.03.
» https://doi.org/10.5777/ambiencia.2012.02.03.» https://revistas.unicentro.br/index.php/ambiencia/article/view/1114 - WIEGAND, T.; MOLONEY, K. A. Rings, circles, and null-models for point pattern analysis in ecology. Oikos, v.104, n.2, p.209-229, 2004. Available from: <Available from: https://onlinelibrary.wiley.com/doi/abs/10.1111/j.0030-1299.2004.12497.x >. Accessed: Jun. 25, 2018. doi: 10.1111 / j.0030-1299.2004.12497.x.
» https://doi.org/10.1111 / j.0030-1299.2004.12497.x.» https://onlinelibrary.wiley.com/doi/abs/10.1111/j.0030-1299.2004.12497.x - ZIMMERMANN, A. P. L.; LIRA, D. F. S.; FLEIG, F. D. Spatial structure and distribution of natural regeneration of canjerana in seasonal deciduous forest. Brazilian forest research, v.34, n.80, p.369-373, 2014. Availablefrom: <Availablefrom: https://pfb.cnpf.embrapa.br/pfb/index.php/pfb/article/view/586 >. Accessed: Jun. 25, 2018. doi: 10.4336/2014.pfb.34.80.586.
» https://doi.org/10.4336/2014.pfb.34.80.586.» https://pfb.cnpf.embrapa.br/pfb/index.php/pfb/article/view/586
-
CR-2020-0367.R2
Publication Dates
-
Publication in this collection
14 May 2021 -
Date of issue
2021
History
-
Received
21 Apr 2020 -
Accepted
13 Nov 2020 -
Reviewed
16 Mar 2021