ABSTRACT:
Understanding the genetic diversity and overcoming genotype-by-environment interaction issues is an essential step in breeding programs that aims to improve the performance of desirable traits. This study estimated genetic diversity and applied genotype + genotype-by-environment (GGE) biplot analyses in cotton genotypes. Twelve genotypes were evaluated for fiber yield, fiber length, fiber strength, and micronaire. Estimation of variance components and genetic parameters was made through restricted maximum likelihood and the prediction of genotypic values was made through best linear unbiased prediction. The modified Tocher and principal component analysis (PCA) methods, were used to quantify genetic diversity among genotypes. GGE biplot was performed to find the best genotypes regarding adaptability and stability. The Tocher technique and PCA allowed for the formation of clusters of similar genotypes based on a multivariate framework. The GGE biplot indicated that the genotypes IMACV 690 and IMA08 WS were highly adaptable and stable for the main traits in cotton. The cross between the genotype IMACV 690 and IMA08 WS is the most recommended to increase the performance of the main traits in cotton crops.
Key words:
fiber quality; genotype-by-environment interaction; Gossypium hirsutum; principal component analyses
RESUMO:
Compreender a diversidade genética e contornar os problemas causados pela interação genótipos por ambientes é uma etapa importante em programas de melhoramento. Este estudo teve como objetivo estimar a diversidade genética e aplicar a metodologia de biplot genótipo + genótipo por ambiente (GGE biplot) em doze genótipos de algodão avaliados quanto ao rendimento da fibra, comprimento da fibra, resistência da fibra e micronaire. A estimativa dos componentes de variância e dos parâmetros genéticos foi feita através do método da máxima verossimilhança restrita e a predição dos valores genotípicos por meio da melhor predição linear não enviesada. Os métodos de Tocher modificado e análise de componentes principais (PCA) foram utilizados para quantificar a diversidade genética entre os genótipos. O método GGE biplot foi conduzido para encontrar os melhores genótipos em relação à adaptabilidade e estabilidade. As técnicas de Tocher e PCA permitiram a formação de clusters de genótipos semelhantes com base em uma estrutura multivariada. O GGE biplot indicou que os genótipos IMACV 690 e IMA08 WS foram altamente adaptáveis e estáveis para as principais características do algodão. O cruzamento dentre os genótipos IMACV 690 e IMA08 WS é o mais recomendado para aumentar o desempenho das principais características na cultura do algodão.
Palavras-chave:
análise de componentes principais; Gossypium hirsutum; interação genótipos por ambientes; qualidade de fibras
INTRODUCTION:
Upland cotton (Gossypium hirsutum L.) is an herbaceous plant native to central America (D’EECKENBRUGGE & LACAPE, 2014D’EECKENBRUGGE, G. C.; LACAPE, J. M. Distribution and differentiation of wild, feral, and cultivated populations of perennial upland cotton (Gossypium hirsutum L.) in Mesoamerica and the Caribbean. PLoS ONE, v.9, n.9, e107458, 2014. Available from: <Available from: https://doi.org/10.1371/journal.pone.0107458 >. Accessed: Nov. 5, 2020. doi: 10.1371/journal.pone.0107458.
https://doi.org/10.1371/journal.pone.010...
). The species provides over 90% of the world’s cotton (QUEIROZ et al., 2017QUEIROZ, D. R. et al. Diallel analysis for agronomic traits in upland cotton in semi-arid zones in Brazil. Genetics and Molecular Research , v.16, n.3, p.1-8, 2017. Available from: <Available from: http://dx.doi.org/10.4238/gmr16039677 >. Accessed: Nov. 6, 2020. doi: 10.4238/gmr16039677.
http://dx.doi.org/10.4238/gmr16039677...
). Its cultivation as an annual crop is widespread the southern to the northern hemisphere, from subtropical regions to temperate latitudes well over 30° (D’EECKENBRUGGE & LACAPE, 2014). Nowadays, the major countries that produce cotton include China, India, the USA, Pakistan, and Brazil (CONAB, 2018CONAB. Acompanhamento da safra brasileira de grãos. Companhia Nacional de Abastecimento, v.5, n.11, 2018. Available from: <Available from: https://www.conab.gov.br/info-agro/safras/graos/boletim-da-safra-de graos/item/download/21709_4d6f8550138ed03890d0bba9f9db1675 >. Accessed: Nov. 5, 2020.
https://www.conab.gov.br/info-agro/safra...
). In Brazil, the Midwest region is mainly responsible for producing cotton, corresponding to over 70% of the total cultivated area (SILVA et al., 2018SILVA, R. A. et al. Phytophagous insects in cotton crop residues during the fallow period in the state of Mato Grosso do Sul, Brazil. Pesquisa Agropecuária Brasileira, v.53, n.8, p.875-884, 2018. Available from: <Available from: https://doi.org/10.1590/s0100-204x2018000800001 >. Accessed: Nov. 6, 2020. doi: 10.1590/s0100-204x2018000800001.
https://doi.org/10.1590/s0100-204x201800...
).
Because extensive areas are cultivated with the same cotton species, the genotypes-by-environments interactions (G×E) are the main impediment related to the development of cultivars fitting environment heterogeneity and technological specificities (LI et al., 2017LI, Y. et al. Genotype by environment interactions in forest tree breeding: review of methodology and perspectives on research and application. Tree Genetics & Genomes, v.13, n.3, p.1-18, 2017. Available from: <Available from: https://doi.org/10.1007/s11295-017-1144-x >. Accessed: Nov. 9, 2020. doi: 10.1007/s11295-017-1144-x.
https://doi.org/10.1007/s11295-017-1144-...
; PEIXOTO et al., 2020PEIXOTO, M. A. et al. Reaction norms based approach applied to optimizing recommendations of cotton genotypes. Agronomy Journal, p.1-11, 2020. Available from: <Available from: https://doi.org/10.1002/agj2.20433 >. Accessed: Nov. 12, 2020. doi: 10.1002/agj2.20433.
https://doi.org/10.1002/agj2.20433...
; VAN EEUWIJK et al., 2016VAN EEUWIJK, F. A. et al. What should students in plant breeding know about the statistical aspects of genotype × environment interactions? Crop Science, v.56, n.5, p.2119-2140, 2016. Available from: <Available from: https://doi.org/10.2135/cropsci2015.06.0375 >. Accessed: Nov. 9, 2020. doi: 10.2135/cropsci2015.06.0375.
https://doi.org/10.2135/cropsci2015.06.0...
). Currently, there are several methods seeking to overcome G×E interaction aiming to provide recommendations of genotypes for a wide experimental network. The genotype + G×E (GGE) biplot method (YAN et al., 2001YAN, W. et al. Two types of GGE biplots for analyzing multi-environment trial data. Crop Science , v.41, n.3, p.656-663, 2001. Available from: <Available from: https://doi.org/10.2135/cropsci2001.413656x >. Accessed: Nov. 4, 2020. doi: 10.2135/cropsci2001.413656x.
https://doi.org/10.2135/cropsci2001.4136...
) is a compelling attempt at dealing with G×E interactions. This method uses a principal component analysis, applied to the effects of genotypes and G×E interaction effects, for the delimitation of mega-environments, identification of testing environments and the recommendation of best genotypes based on adaptability and stability (YAN et al., 2001).
Generally, basic studies of genetic diversity are important in the development of new cultivars in breeding programs, mainly because they guide which new crosses perform to achieve the aims of a specific breeding program. According to HINZE et al. (2016HINZE, L. L. et al. Genetic Diversity of the Two Commercial Tetraploid Cotton Species in the Gossypium Diversity. Journal of Heredity, v.107, n.3, p.274-286, 2016. Available from: <Available from: https://doi.org/10.1093/jhered/esw004 >. Accessed: Sep. 16, 2020. doi: 10.1093/jhered/esw004.
https://doi.org/10.1093/jhered/esw004...
) understanding the genetic diversity of cotton is an essential step for the development of germplasm collection and conservation strategies. In the same way, grouping similar genotypes and selecting the most desirable hybrid combinations, which lead to better exploration of a segregating population, allows for the success of cotton breeding programs. As a result of genetic diversity studies, it is possible to maximize the exploration of heterosis with the probable emergency of transgressive individuals if a diverse base population with a satisfactory agronomic performance is formed (CRUZ, 2012).
Herein, this study aimed to: (i) determine the genetic divergence among 12 cotton cultivars in terms of productivity traits and fiber quality; (ii) identify the most contrasting cultivars as parents for crosses seeking to increase or maintain the variability through breeding; and, (iii) identify cotton genotypes with high adaptability and stability through GGE biplot analysis.
MATERIAL AND METHODS:
Ten trials with upland cotton genotypes were conducted during 2013/2014 and 2014/2015 cropping seasons in the Midwest region of Brazil. The environments were a combination between sites and crop years. The trials consisted of randomized complete block design with 12 cotton cultivars with four replicates each (G1 = TMG41 WS; G2 = TMG43 WS; G3 = IMACV 690; G4 = IMA5675 B2RF; G5 = IMA08 WS; G6 = NUOPAL; G7 = DP555 BGRR; G8 = DELTA OPAL; G9 = BRS286; G10 = BRS335; G11 = BRS368 RF; G12 = BRS369 RF). The experimental unit (plots) consisted of four 5.0 m rows, spaced at 0.90 m from each other, with nine plants per meter in each row. In each plot, 20 bolls were collected at maturity to determine fiber length (FL, mm), fiber strength (FS, gf.tex-1), and micronaire (MIC, µg.inch-1), using a high-volume instrument. Cotton seed yield and fiber percentage were measured, and fiber yield (FY, kg.ha-1) was estimated by multiplying between cotton seed yield and fiber percentage.
Statistical analyses
The statistical model used the restricted maximum likelihood/best linear unbiased prediction (REML/BLUP) (HENDERSON, 1975HENDERSON, C.R. Best linear unbiased estimation and prediction under a selection model. Biometrics, v.31, n.2, p.423-447, 1975. Available from: <Available from: https://doi.org/10.2307/2529430 >. Accessed: Oct. 20, 2020. doi: 10.2307/2529430.
https://doi.org/10.2307/2529430...
; PATTERSON & THOMPSON, 1971PATTERSON, H. D.; THOMPSON, R. Recovery of inter-block information when block sizes are unequal. Biometrika, v.58, n.3, p.545-554, 1971. Available from: <Available from: https://doi.org/10.1093/biomet/58.3.545 >. Accessed: Oct. 20, 2020. doi: 10.1093/biomet/58.3.545.
https://doi.org/10.1093/biomet/58.3.545...
) procedure, determined by the following equation:
where y is the vector of phenotypic data; b is the vector of replication-environment combinations (assumed to be a fixed factor). It comprises the effects of environment and replication within the environment and is added to the overall mean; g is the vector of genotype effects (assumed to be a random factor) ( ), where is the genotypic variance); i is the vector of G×E interaction effect (random factor) ( ), where is the G×E interaction variance); and e is the vector of residuals (random factor) (e~N(0, R), where R represents a matrix of residual variances). Capital letters represent the incidence matrices for b, g, and i, respectively. The significance of the random effects (genotype and GEI) were tested using the likelihood ratio test (LRT) (WILKS, 1938WILKS, S. S. The large-sample distribution of the likelihood ratio for testing composite hypotheses. Annais of Mathematica and Statistica, v.9, p.60-62, 1938, Available from: <Available from: https://www.jstor.org/stable/2957648?seq=1#metadata_info_tab_contents >. Accessed: Nov. 9, 2020. doi: 10.1214/aoms/1177732360.
https://www.jstor.org/stable/2957648?seq...
).
The mean selective accuracy (rĝg) were estimated using the following equation (RESENDE et al., 2014RESENDE, M. D. V. et al. Estatística matemática, biométrica e computacional: modelos mistos, multivariados, categóricos e generalizados (REML/BLUP), inferência bayesiana, regressão aleatória, seleção genômica, QTL-QWAS, estatística espacial e temporal, competição, sobrevivência. Viçosa: UFV , 2014. 881p.): , in which PEV stands for prediction error variance.
The GGE biplot analysis, was carried out to visually analyze the multi-environment trial (MET) data. The GGE biplot model applied was as follows:
in which Yij is the mean predicted value of genotype i at j environment; yj is the overall mean predicted genotype values in j environment; y1εi1ρj1 is the first principal component (PC1); y2εi2ρj2 is the second principal component (PC2); y1 and y2 are the eigenvalues associated with PC1 and PC2, respectively; εi1 and εi2 are the values of the first two eigenvectors for the i-th genotype; ρj1 and ρj2 are the values of the first two eigenvectors for the j-th environment; and, is the error associated with the i-th genotype and j-th environment model (YAN et al., 2001YAN, W. et al. Two types of GGE biplots for analyzing multi-environment trial data. Crop Science , v.41, n.3, p.656-663, 2001. Available from: <Available from: https://doi.org/10.2135/cropsci2001.413656x >. Accessed: Nov. 4, 2020. doi: 10.2135/cropsci2001.413656x.
https://doi.org/10.2135/cropsci2001.4136...
). The biplot was based on singular value decomposition of the standardized table (“Scaling=0, Centering=2”), and dual metric preserving (“SVP=3”) was used.
Multivariate analyses were performed to discriminate between the genotypes under study. The mean standard Euclidian distance was obtained from the standard genetic values matrix from each trait. The optimization method of Tocher (RAO, 1952RAO, C. R. Advanced statistical methods in biometric research. New York: A Division of Macmillan Publishing Co, Inc New York; Collier-Macmillan Publishers, 1952.), modified by (VASCONCELOS et al., 2007VASCONCELOS, E. S. et al. Alternative methodology for the cluster analysis. Pesquisa Agropecuária Brasileira , v.42, p.1421-1428, 2007. Available from: <Available from: https://www.scielo.br/pdf/pab/v42n10/a08v4210.pdf >. Accessed: Nov. 9, 2020. doi: 10.1590/S0100-204X2007001000008.
https://www.scielo.br/pdf/pab/v42n10/a08...
) based on the mean standard Euclidian distance, was used to delimitate the genetic clusters. In addition, graphical dispersion of the genetic divergence of the genotypes was analyzed through principal component analysis (PCA) (MARDIA et al., 1979MARDIA, K. V. et al. Multivariate Analysis. London: Academic Press, 1979. 519p.). The relative importance of the traits in quantifying genetic divergence was estimated based on the PCA method.
Statistical analyses were performed using the software Rbio (BHERING, 2017BHERING, L. L. Rbio: A tool for biometric and statistical analysis using the R platform. Crop Breeding and Applied Biotechnology, v.17, n.2, p.187-190, 2017. Available from: <Available from: https://doi.org/10.1590/1984-70332017v17n2s29 >. Accessed: Sep. 8, 2020. doi: 10.1590/1984-70332017v17n2s29.
https://doi.org/10.1590/1984-70332017v17...
) and ASREML (GILMOUR et al., 2015GILMOUR, A. R. et al. ASReml User Guide Release 4.1 Functional Specification. Hemel Hempstead: VSN International Ltd, 2015. 339p.).
RESULTS AND DISCUSSION:
Significant genotypic and G×E interaction effects (P < 0.05) were detected by the LRT for all traits. The LRT values demonstrate the existence of genotypic variability for all traits among the 12 cotton genotypes under study, which implies the possibility of selecting superior genotypes from the pool. The values of selective accuracy for the trait (FY = 0.77, FL = 0.93, FS = 0.93; MIC = 0.89) presented high (0.70 < < 0.89) and very high (0.90 <) values (RESENDE & ALVES, 2020RESENDE, M. D. V.; ALVES, R. S. Linear, generalized, hierarchical, bayesian and random regression mixed models in genetics/genomics in plant breeding. Functional Plant Breeding Journal, v.2, n.2, p.1-31, 2020. Available from: <Available from: http://dx.doi.org/10.35418/2526-4117/v2n2a1 >. Accessed: Sep. 16, 2020. doi: 10.35418/2526-4117/v2n2a1.
http://dx.doi.org/10.35418/2526-4117/v2n...
). It indicates reliability in the prediction of the genotypic values for all traits analyzed.
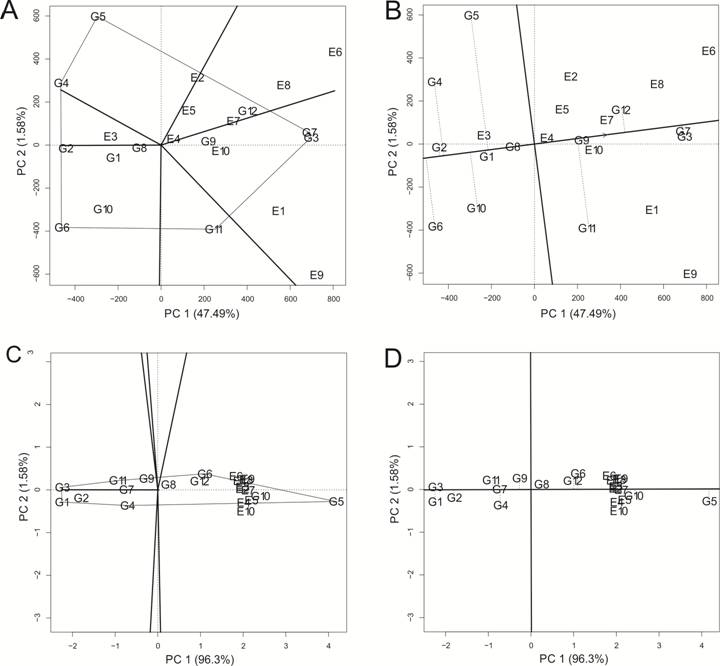
The results from the GGE biplot analysis presented the vectors from the biplot center (0,0) and divided the graph into six sectors for the FY and FL traits. (Figure 1). However, two mega-environments were recognized for FY, whereas only one mega-environment was observed for FL. It is worth mentioning that a mega-environment is a group of more than one environment and, in the case of GGE biplot, a group of environments inside a sector.

GGE biplot graph with the view of the genotypes by trait biplot, highlighting genotypes with outstanding adaptability and stability. A) “which-won-where” view for FY trait (fiber yield in kg.ha-1); B) “mean versus stability” view for FY trait; C) “which-won-where” view for FL trait (fiber length in mm); D) “mean versus stability” view for FL trait.
In addition, the polygons have a different number of genotypes in each vertex. For instance, the FY trait presented a polygon connecting the following genotypes: G5 (IMA08 WS), G7 (DP555 BGRR), G3 (IMACV 690), G11 (BRS368 RF), G6 (NUOPAL), and G4 (IMA5675 B2RF). For each polygon, the genotypes in each vertex, presenting larger vectors from the origin, are those more sensitive for G×E interaction in each sector (YAN et al., 2001YAN, W. et al. Two types of GGE biplots for analyzing multi-environment trial data. Crop Science , v.41, n.3, p.656-663, 2001. Available from: <Available from: https://doi.org/10.2135/cropsci2001.413656x >. Accessed: Nov. 4, 2020. doi: 10.2135/cropsci2001.413656x.
https://doi.org/10.2135/cropsci2001.4136...
). Combined with the sectors from the polygon graph mentioned above, the genotypes in the vertex are those with the best performance in each sector and, by definition, in each mega-environment.
The genotypes that are located within a sector are the most adapted for the sector. As the genotypes in the vertices of each polygon represent larger vectors, they are the most adapted for those environments (YAN et al., 2001YAN, W. et al. Two types of GGE biplots for analyzing multi-environment trial data. Crop Science , v.41, n.3, p.656-663, 2001. Available from: <Available from: https://doi.org/10.2135/cropsci2001.413656x >. Accessed: Nov. 4, 2020. doi: 10.2135/cropsci2001.413656x.
https://doi.org/10.2135/cropsci2001.4136...
). Thus, the genotype G3 (IMACV 690) and G7 (DP555 BGRR) were the most adapted for each mega-environment formed by FY trait. The genotypes G5 (IMA08 WS) was indicated as being more adapted to the mega-environments formed for the trait FL. Similarly, the results from the GGE Biplot analysis indicated the most stable genotypes. The x axis presents an arrow pointing in the opposite direction of the biplot origin. Then, in the direction of the arrow, the farther from the center biplot and the x axis the genotypes are situated, the more stable and less affected by the G×E interaction they are (YAN et al., 2001). For FY and FL traits, the genotypes G12 (BRS369 RF) and G5 (IMA08 WS) were most stable, respectively (Figure 1).
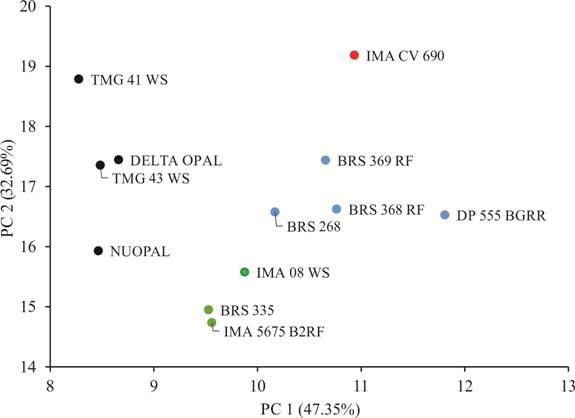
The Tocher clustering based on the mean standard Euclidian distance matrix identified four distinct cotton genotype groups (Group 1 - G7, G9, G11, and G12; Group 2 - G1, G2, G6, and G8; Group 3 - G4, G5, and G10; Group 4 - G4). Results demonstrated that PCA effectively explained the variation among the genotypes, with the sum of the first and second principal components accounting for more than 80% of the variation (Figure 2). In this case, the bidimensional graphical dispersion of the cotton genotypes, related to the first and second principal component, was preferred (Figure 2). The genotypes in the PCA presented a similar organization to that of the Tocher method, forming four distinct clusters of genotypes, demonstrating reliable experimental accuracy. Results of the PCA made it possible to graphically visualize the dissimilarities among genotypes, distinguishing the genotypes accounting for the distance from the mean Euclidian distance. The use of the PCA method alongside grouping techniques, such as Tocher or UPGMA, elucidated the distance among and within the genotype groups.

Graphical dispersion through the two principal components (PC1 and PC2) scatter plot of the genotypes analyzed. The colors represent the clusters of similar genotypes formed. Blue = cluster 1. Black = cluster 2. Green = cluster 3. Red = cluster 4. TMG41 WS (G1); TMG43 WS (G2); IMACV 690 (G3); IMA5675 B2RF (G4); IMA08 WS (G5); NUOPAL (G6); DP555 BGRR (G7); DELTA OPAL (G8); BRS286 (G9); BRS335 (G10); BRS368 RF (G11); BRS369 RF (G12).
The eigenvectors values are useful in their capacity to discriminate between the estimated components (CRUZ et al., 2012). MIC was the most important trait contributing to the first principal component, which described 47.35% of the variation, whereas FY was the most important trait in the second principal component, which described 32.69% of the total variance (Table 1). Based on the relative importance from the PCA analysis, the trait MIC presented higher contribution for the first eigenvalue, while the FY trait was the most important in the second eigenvalue.
Eigenvalues and eigenvectors of the four principal components for the four traits analyzed. FY = fiber yield (kg.ha-1); FL = fiber length (mm); FS = fiber strength (gf.tex−1); MIC = fiber fineness (µg.inch-1). Bold values indicated those loads related to each variable that presented higher contribution to each eigenvalue.
Based on the performance of the genotypes, clusters 1 and 4 presented genotypes with high values FY, while clusters 2 and 4 were formed by genotypes with high values in FS. Genotypes from cluster 3 possessed reasonable values of FL and MIC. In the case of cotton cultivars, the more important traits in breeding programs are the FY and the FL (FARIAS et al., 2016FARIAS, F. J. C. et al. Usefulness of the HMRPGV method for simultaneous selection of upland cotton genotypes with greater fiber length and high yield stability. Genetics and Molecular Research, v.15, n.3, p.1-7, 2016. Available from: <Available from: http://dx.doi.org/10.4238/gmr.15038439 >. Accessed: Nov. 4, 2020. doi: 10.4238/gmr.15038439.
http://dx.doi.org/10.4238/gmr.15038439...
). From the results obtained, one indicated cross is between the genotype IMACV 690 (most productive - higher FY value) and the genotype IMA08 WS (a representative genotype in FL). Therefore, these genotypes presented high adaptability and stability for FY and FL, highlighting the potential of such a cross. Other crosses indicated are the ones between the genotypes from clusters 1 and 4 with the ones from cluster 3. Clusters 1 and 4 had genotypes with high values of FY and FS and cluster 3 possessed genotypes with higher values of FL and lower values of MIC.
CONCLUSION:
The mixed model methodology applied through Tocher and PCA allowed for the identification of genetic divergence among cotton genotypes, the formation of clusters of genotypes, and the indication of promising crosses, which can be exploited to produce superior plants. The genotypes most adapted for the mega-environments formed by considering the FY trait were G3 (IMACV 690) and G7 (DP555 BGRR), whereas the genotype G5 (IMA08 WS) was indicated as being more adapted for the mega-environments formed for the traits FL, respectively. The genotypes G3 (IMACV 690) and G5 (IMA08 WS) were the most stable for FY and FL traits. The cross between the genotype G3 and G5 were the most recommended to increase the performance of the main cotton traits (FY and FL traits), since they were superior genotypes in each group and were indicated as highly adapted and stable for the mega-environments.
ACKNOWLEDGMENTS
We appreciate the financial support from the Brazilian Government offered by the Conselho Nacional de Desenvolvimento Científico e Tecnológico (CNPq), by the Coordenação de Aperfeiçoamento de Pessoal de Nível Superior (CAPES), and the CMPC Company for the partnership. This study was financed in part by the CAPES - Finance Code 001.
REFERENCES
- BHERING, L. L. Rbio: A tool for biometric and statistical analysis using the R platform. Crop Breeding and Applied Biotechnology, v.17, n.2, p.187-190, 2017. Available from: <Available from: https://doi.org/10.1590/1984-70332017v17n2s29 >. Accessed: Sep. 8, 2020. doi: 10.1590/1984-70332017v17n2s29.
» https://doi.org/10.1590/1984-70332017v17n2s29.» https://doi.org/10.1590/1984-70332017v17n2s29 - CONAB. Acompanhamento da safra brasileira de grãos. Companhia Nacional de Abastecimento, v.5, n.11, 2018. Available from: <Available from: https://www.conab.gov.br/info-agro/safras/graos/boletim-da-safra-de graos/item/download/21709_4d6f8550138ed03890d0bba9f9db1675 >. Accessed: Nov. 5, 2020.
» https://www.conab.gov.br/info-agro/safras/graos/boletim-da-safra-de graos/item/download/21709_4d6f8550138ed03890d0bba9f9db1675 - CRUZ, C. D. Princípios de Genética Quantitativa. Viçosa: UFV, 2012a. 394p.
- CRUZ, C. D. et al. Biometria Aplicada ao estudo da diversidade genética. Visconde do Rio Branco: Suprema, 2012b. 620p.
- D’EECKENBRUGGE, G. C.; LACAPE, J. M. Distribution and differentiation of wild, feral, and cultivated populations of perennial upland cotton (Gossypium hirsutum L.) in Mesoamerica and the Caribbean. PLoS ONE, v.9, n.9, e107458, 2014. Available from: <Available from: https://doi.org/10.1371/journal.pone.0107458 >. Accessed: Nov. 5, 2020. doi: 10.1371/journal.pone.0107458.
» https://doi.org/10.1371/journal.pone.0107458.» https://doi.org/10.1371/journal.pone.0107458 - FARIAS, F. J. C. et al. Usefulness of the HMRPGV method for simultaneous selection of upland cotton genotypes with greater fiber length and high yield stability. Genetics and Molecular Research, v.15, n.3, p.1-7, 2016. Available from: <Available from: http://dx.doi.org/10.4238/gmr.15038439 >. Accessed: Nov. 4, 2020. doi: 10.4238/gmr.15038439.
» https://doi.org/10.4238/gmr.15038439.» http://dx.doi.org/10.4238/gmr.15038439 - GILMOUR, A. R. et al. ASReml User Guide Release 4.1 Functional Specification. Hemel Hempstead: VSN International Ltd, 2015. 339p.
- HENDERSON, C.R. Best linear unbiased estimation and prediction under a selection model. Biometrics, v.31, n.2, p.423-447, 1975. Available from: <Available from: https://doi.org/10.2307/2529430 >. Accessed: Oct. 20, 2020. doi: 10.2307/2529430.
» https://doi.org/10.2307/2529430.» https://doi.org/10.2307/2529430 - HINZE, L. L. et al. Genetic Diversity of the Two Commercial Tetraploid Cotton Species in the Gossypium Diversity. Journal of Heredity, v.107, n.3, p.274-286, 2016. Available from: <Available from: https://doi.org/10.1093/jhered/esw004 >. Accessed: Sep. 16, 2020. doi: 10.1093/jhered/esw004.
» https://doi.org/10.1093/jhered/esw004.» https://doi.org/10.1093/jhered/esw004 - LI, Y. et al. Genotype by environment interactions in forest tree breeding: review of methodology and perspectives on research and application. Tree Genetics & Genomes, v.13, n.3, p.1-18, 2017. Available from: <Available from: https://doi.org/10.1007/s11295-017-1144-x >. Accessed: Nov. 9, 2020. doi: 10.1007/s11295-017-1144-x.
» https://doi.org/10.1007/s11295-017-1144-x.» https://doi.org/10.1007/s11295-017-1144-x - MARDIA, K. V. et al. Multivariate Analysis. London: Academic Press, 1979. 519p.
- PATTERSON, H. D.; THOMPSON, R. Recovery of inter-block information when block sizes are unequal. Biometrika, v.58, n.3, p.545-554, 1971. Available from: <Available from: https://doi.org/10.1093/biomet/58.3.545 >. Accessed: Oct. 20, 2020. doi: 10.1093/biomet/58.3.545.
» https://doi.org/10.1093/biomet/58.3.545.» https://doi.org/10.1093/biomet/58.3.545 - PEIXOTO, M. A. et al. Reaction norms based approach applied to optimizing recommendations of cotton genotypes. Agronomy Journal, p.1-11, 2020. Available from: <Available from: https://doi.org/10.1002/agj2.20433 >. Accessed: Nov. 12, 2020. doi: 10.1002/agj2.20433.
» https://doi.org/10.1002/agj2.20433.» https://doi.org/10.1002/agj2.20433 - QUEIROZ, D. R. et al. Diallel analysis for agronomic traits in upland cotton in semi-arid zones in Brazil. Genetics and Molecular Research , v.16, n.3, p.1-8, 2017. Available from: <Available from: http://dx.doi.org/10.4238/gmr16039677 >. Accessed: Nov. 6, 2020. doi: 10.4238/gmr16039677.
» https://doi.org/10.4238/gmr16039677.» http://dx.doi.org/10.4238/gmr16039677 - RAO, C. R. Advanced statistical methods in biometric research. New York: A Division of Macmillan Publishing Co, Inc New York; Collier-Macmillan Publishers, 1952.
- RESENDE, M. D. V.; ALVES, R. S. Linear, generalized, hierarchical, bayesian and random regression mixed models in genetics/genomics in plant breeding. Functional Plant Breeding Journal, v.2, n.2, p.1-31, 2020. Available from: <Available from: http://dx.doi.org/10.35418/2526-4117/v2n2a1 >. Accessed: Sep. 16, 2020. doi: 10.35418/2526-4117/v2n2a1.
» https://doi.org/10.35418/2526-4117/v2n2a1.» http://dx.doi.org/10.35418/2526-4117/v2n2a1 - RESENDE, M. D. V. et al. Estatística matemática, biométrica e computacional: modelos mistos, multivariados, categóricos e generalizados (REML/BLUP), inferência bayesiana, regressão aleatória, seleção genômica, QTL-QWAS, estatística espacial e temporal, competição, sobrevivência. Viçosa: UFV , 2014. 881p.
- SILVA, R. A. et al. Phytophagous insects in cotton crop residues during the fallow period in the state of Mato Grosso do Sul, Brazil. Pesquisa Agropecuária Brasileira, v.53, n.8, p.875-884, 2018. Available from: <Available from: https://doi.org/10.1590/s0100-204x2018000800001 >. Accessed: Nov. 6, 2020. doi: 10.1590/s0100-204x2018000800001.
» https://doi.org/10.1590/s0100-204x2018000800001.» https://doi.org/10.1590/s0100-204x2018000800001 - VAN EEUWIJK, F. A. et al. What should students in plant breeding know about the statistical aspects of genotype × environment interactions? Crop Science, v.56, n.5, p.2119-2140, 2016. Available from: <Available from: https://doi.org/10.2135/cropsci2015.06.0375 >. Accessed: Nov. 9, 2020. doi: 10.2135/cropsci2015.06.0375.
» https://doi.org/10.2135/cropsci2015.06.0375.» https://doi.org/10.2135/cropsci2015.06.0375 - VASCONCELOS, E. S. et al. Alternative methodology for the cluster analysis. Pesquisa Agropecuária Brasileira , v.42, p.1421-1428, 2007. Available from: <Available from: https://www.scielo.br/pdf/pab/v42n10/a08v4210.pdf >. Accessed: Nov. 9, 2020. doi: 10.1590/S0100-204X2007001000008.
» https://doi.org/10.1590/S0100-204X2007001000008.» https://www.scielo.br/pdf/pab/v42n10/a08v4210.pdf - WILKS, S. S. The large-sample distribution of the likelihood ratio for testing composite hypotheses. Annais of Mathematica and Statistica, v.9, p.60-62, 1938, Available from: <Available from: https://www.jstor.org/stable/2957648?seq=1#metadata_info_tab_contents >. Accessed: Nov. 9, 2020. doi: 10.1214/aoms/1177732360.
» https://doi.org/10.1214/aoms/1177732360.» https://www.jstor.org/stable/2957648?seq=1#metadata_info_tab_contents - YAN, W. et al. Two types of GGE biplots for analyzing multi-environment trial data. Crop Science , v.41, n.3, p.656-663, 2001. Available from: <Available from: https://doi.org/10.2135/cropsci2001.413656x >. Accessed: Nov. 4, 2020. doi: 10.2135/cropsci2001.413656x.
» https://doi.org/10.2135/cropsci2001.413656x.» https://doi.org/10.2135/cropsci2001.413656x
-
CR-2020-1054.R1
-
1
Editors: Leandro Souza da Silva (0000-0002-1636-6643) Alberto Cargnelutti Filho (0000-0002-8608-9960)
Publication Dates
-
Publication in this collection
20 Aug 2021 -
Date of issue
2022
History
-
Received
06 Dec 2020 -
Accepted
10 May 2021 -
Reviewed
18 June 2021