ABSTRACT:
The development process of a new wheat cultivar requires time between obtaining the base population and selecting the most promising line. Estimating genetic parameters more accurately in early generations with a view to anticipating selection means important advances for wheat breeding programs. Thus, the present study estimated the genetic parameters of F2 populations of tropical wheat and the genetic gain from selection via the Bayesian approach. To this end, the authors assessed the grain yield per plot of 34 F2 populations of tropical wheat. The Bayesian approach provided an adequate fit to the model, estimating genetic parameters within the parametric space. Heritability (h2) was 0.51. Among those selected, 11 F2 populations performed better than the control cultivars, with genetic gain of 7.80%. The following populations were the most promising: TbioSossego/CD 1303, CD 1303/TbioPonteiro, BRS 254/CD 1303, Tbio Duque/Tbio Aton, and Tbio Aton/CD 1303. Bayesian inference can be used to significantly improve tropical wheat breeding programs.
Key words:
information criterion; early selection,TriticumaestivumL.; wheat breeding.
RESUMO:
O processo de desenvolvimento de uma nova cultivar de trigo requer tempo entre a obtenção da população base e a seleção da linhagem mais promissora. Estimar parâmetros genéticos com mais precisão nas primeiras gerações com vistas a antecipar a seleção significa avanços importantes para os programas de melhoramento de trigo. Assim, o presente estudo estima os parâmetros genéticos de populações F2 de trigo tropical e o ganho genético da seleção via abordagem Bayesiana. Para tanto, os autores avaliaram a produtividade de grãos por parcela de 34 populações F2 de trigo tropical. A abordagem Bayesiana proporcionou um ajuste adequado ao modelo, estimando parâmetros genéticos dentro do espaço paramétrico. A herdabilidade (h2) foi de 0,51. Dentre as selecionadas, 11 populações F2 obtiveram desempenho superior às cultivares controle, com ganho genético de seleção de 7,80%. As seguintes populações foram as mais promissoras: Tbio Sossego/CD 1303, CD 1303/Tbio Ponteiro, BRS 254/CD 1303, Tbio Duque/Tbio Aton e Tbio Aton/CD 1303. A inferência Bayesiana pode ser usada para melhorar significativamente programas de melhoramento de trigo tropical.
Palavras-chave:
critério de informação de desvio; seleção precoce; Triticum aestivum L.; melhoramento de trigo.
INTRODUCTION:
Brazil consumes about 12 million tons of wheat annually; however, it produces only about 50% of this total, requiring imports to meet domestic demand (CONAB, 2021CONAB. Acompanhamento da safra brasileira de grãos, 2021.Available from: <Available from: https://www.conab.gov.br/ingo-agro/safras/graos/boletim-da-safra-de-graos >. Accessed: May, 06, 2021.
https://www.conab.gov.br/ingo-agro/safra...
). The country is dependent on the production of exporting countries such as Argentina, the European Union, and the United States. Thus, the country is constantly affected by protectionist policies in these exporting countries and by occasional weather events that reduce yield in these agricultural areas. In this context, wheat breeding programs should focus on selecting genotypes with high grain yield, especially for areas in which wheat cultivation is secondary in importance despite its exploration potential, such as the Brazilian Cerrado (PASINATO et al., 2018PASINATO, A. et al. Potential area and limitations for the expansion of rainfed wheat in the Cerrado biome of Central Brazil.Pesquisa Agropecuária Brasileira, v.53, p.779-790, 2018. Available from: <Available from: https://www.scielo.br/j/pab/a/kt7GB4x5sf4GDg4XYfy6sZx/?format=pdf⟨=en >. Accessed: May, 06, 2021.doi: 10.1590/s0100-204x2018000700001.
https://www.scielo.br/j/pab/a/kt7GB4x5sf...
).
The development of new cultivars starts with the identification of segregating populations with the potential to derive lines with superior genetic value, which depends on parents with a high concentration of trait-favorable alleles (FASAHAT et al., 2016FASAHAT, P. et al. Principles and utilization of combining ability in plant breeding.Biometrics & Biostatistics International Journal, v.4, p.1-11, 2016. Available from: <Available from: http://medcraveonline.com/BBIJ/BBIJ-04-00085.pdf >. Accessed: May, 06, 2021.doi: 10.15406/bbij.2016.04.00085.
http://medcraveonline.com/BBIJ/BBIJ-04-0...
). The definition of the best strategies both for identifying superior populations and for conducting them through breeding programs requires high accuracy prediction of breeding values, as well as the estimation of variance components and genetic parameters. Studies usually apply frequentist approaches such as the Restricted Maximum Likelihood/Best Linear Unbiased Prediction (REML/BLUP) to this end. This type of approach was used by PIMENTEL et al. (2014PIMENTEL, A. J. B. et al. Estimation of genetic parameters and prediction of additive genetic value for wheat by mixed models. Pesquisa Agropecuária Brasileira, v.49, p.882-890, 2014. Available from: <Available from: https://www.scielo.br/j/pab/a/kVGpm9sMMR795hTTGpdQLDB/?format=pdf⟨=pt >. Accessed: May, 07, 2021.doi: 10.1590/S0100-204X2014001100007.
https://www.scielo.br/j/pab/a/kVGpm9sMMR...
) in F3 wheat populations, by THORWARTH et al. (2019THORWARTH, P. et al. Dissecting the genetics underlying the relationship between protein and grain yield in a large hybrid wheat population. Theoretical and Applied Genetics , v.132, p.489-500, 2019. Available from: <Available from: https://pubmed.ncbi.nlm.nih.gov/30456718 >. Accessed: May, 08, 2021.doi: 10.1007/s00122-018-3236-x.
https://pubmed.ncbi.nlm.nih.gov/30456718...
) in wheat hybrids, and by MAHJOURIMAJD et al. (2016MAHJOURIMAJD, S. et al.The genetic control of grain protein content under variable nitrogen supply in an Australian wheat mapping population.PlosOne, v.11, p.e0159371, 2016. Available from: <Available from: https://journals.plos.org/plosone/article?id=10.1371/journal.pone.0159371 >. Accessed: May, 07, 2021.doi: 10.1371/journal.pone.0159371.
https://journals.plos.org/plosone/articl...
) in double haploid wheat. Although, the frequentist approach has several useful properties such as estimators with minimal and unbiased variance, it has limitations such as providing only approximate standard errors for heritability (RESENDE, 2002RESENDE, M. D. V. Genética biométrica e estatística no melhoramento de plantas perenes. Brasília: Embrapa Informação Tecnológica, 2002. 975p.).
As an alternative to the frequentist approach, the Bayesian approach combines subjective information contained in a priori probability distributions with sample information, through a posteriori distribution of parameters. As a central feature in the Bayesian approach, probability distribution correlates with uncertainty regarding unknown parameters. In the frequentist approach, the parameters consist of fixed and constant values, not associated with any probability distribution (BOX & TIAO, 1992BOX, G.; TIAO, G. C. Bayesian inference in statistical analysis.New York: Journal Wiley Interscience, 1992. 608p.).
The Bayesian approach provides more complete results, allowing the selection of the best segregating populations to continue breeding programs. In this process, the selection of progenies occurs from a performance evaluation according to the breeder’s criteria (SILVA et al., 2019SILVA, H. T. et al. Alternative count Bayesian models for genetic evaluation of litter traits in pigs. LivestockScience, v.225, p.140:143, 2019. Available from: <Available from: https://www.sciencedirect.com/science/article/pii/S1871141319303324?via%3Dihub >. Accessed: May, 08, 2021. doi:10.1016/j.livsci.2019.05.006.
https://www.sciencedirect.com/science/ar...
). The literature reports different successful cases involving Bayesian inference, such as the selection of guava (Psidiumguajava L.) (SILVA et al., 2020), kale (Brassica oleracea L. var acephala DC) (AZEVEDO et al., 2017AZEVEDO, A. M. et al. Population parameters and selection of kale genotypes using Bayesian inference in a multi-trait linear model.ActaScientiarum.Agronomy, v.39, p.25-31, 2017. Available from: <Available from: https://www.scielo.br/j/asagr/a/tQX6mFhBzJ5rPTtnZZN9YmR/?format=pdf⟨=en >. Accessed: May, 06, 2021.doi: 10.4025/actasciagron.v39i1.30856.
https://www.scielo.br/j/asagr/a/tQX6mFhB...
), and eucalyptus populations (Eucalyptus globulus) (MORA et al., 2019MORA, F., et al. Bayesian analysis of growth stem straightness and branching quality in full-sib families of Eucalyptus globulus. Bragantia, v.78, p.328-336, 2019.Available from: <Available from: https://www.scielo.br/j/brag/a/HWFYNjgj4yyQsf9cHyKwsCf/?format=pdf⟨=en >. Accessed: May, 07, 2021. doi:10.1590/1678-4499.20180317.
https://www.scielo.br/j/brag/a/HWFYNjgj4...
).
The definition of selection strategies in a breeding program requires information on the populations under study, the estimation of variance components and breeding values, as well as the achievement of heritability (SEARLE et al., 1992SEARLE, S. R., et al. Variance components. New York: John Wiley & Sons. 501p, 1992.; GONÇALVES-VIDIGAL et al., 2008GONÇALVES-VIDIGAL, M. C. et al. Heritability of quantitative traits in segregating common bean families using a Bayesian approach.Euphytica, v.164, p.551-560, 2008. Available from: <https://link.springer.com/article/10.1007/s10681-008-9758-6>. doi: 10.1007/s10681-008-9758-6.
https://link.springer.com/article/10.100...
). Bayesian inference can be used with advantages in these cases, since it allows to obtainposterior densities of the marginal distributions and credibility intervals for the variance components, breeding values, and genetic parameters such as heritability (WALDMANN & ERICSSON, 2006WALDMANN, P.; ERICSSON, T. Comparison of REML and Gibbs sampling estimates of multi-trait genetic parameters in Scots pine. Theoretical and Applied Genetics , v.112, p.1441-1451, 2006. Available from: <Available from: https://pubmed.ncbi.nlm.nih.gov/16544126 >. Accesed: May, 06, 2021. doi: 10.1007/s00122-006-0246-x.
https://pubmed.ncbi.nlm.nih.gov/16544126...
).
Bayesian approaches have many practical applications in breeding programs, including the study of adaptability and stability in genotypes of Gossypium L. (NASCIMENTO et al., 2020NASCIMENTO, M. et al. Bayesian segmented regression model for adaptability and stability evaluation of cotton genotypes. Euphytica , v.16, p.30, 2020. Available from: <Available from: https://link.springer.com/content/pdf/10.1007/s10681-020-2564-5.pdf >. Accessed: May 06, 2021.doi: 10.1007/s10681-020-2564-5.
https://link.springer.com/content/pdf/10...
) and Zea mays (OLIVEIRA et al., 2018OLIVEIRA, T. R. A. et al. The Eberhart and Russel’s Bayesian method used as na instrument to select maize hybrids. Euphytica , v.214, p.64, 2018. Available from: <Available from: https://www.researchgate.net/publication/323648251_The_Eberhart_and_Russel’s_Bayesian_method_used_as_an_instrument_to_select_maize_hybrids >. Accessed: May, 06, 2021.doi: 10.1007/s10681-018-2146-y.
https://www.researchgate.net/publication...
), repeatability analysis in Jatropha curcas (PEIXOTO et al., 2021PEIXOTO, M. A. et al. Multiple-trait model through Bayesian inference applied to Jatropha curcasbreeding for bioenergy. Plos One, v.16, p.e0247775, 2021. Available from: <Available from: https://journals.plos.org/plosone/article?id=10.1371/journal.pone.0247775 >. Accessed: May, 06, 2021. doi:10.1371/journal.pone.0247775.
https://journals.plos.org/plosone/articl...
), and parameter estimates and population selection in Brassica oleracea L. (AZEVEDO et al., 2017AZEVEDO, A. M. et al. Population parameters and selection of kale genotypes using Bayesian inference in a multi-trait linear model.ActaScientiarum.Agronomy, v.39, p.25-31, 2017. Available from: <Available from: https://www.scielo.br/j/asagr/a/tQX6mFhBzJ5rPTtnZZN9YmR/?format=pdf⟨=en >. Accessed: May, 06, 2021.doi: 10.4025/actasciagron.v39i1.30856.
https://www.scielo.br/j/asagr/a/tQX6mFhB...
). Moreover, the Bayesian approach produces information regarding distributions and credibility intervals; however, wheat breeding programs do not often report its use. There is a lack of information on wheat improvement regarding the obtaining of population parameters, the selection of F2 populations, and the estimates of genetic gain from selection. In this sense, the present study analyzes 34 F2 populations for grain yield using a Bayesian approach, assessing heritability, breeding values, and genetic gain from selection.
MATERIALS AND METHODS:
Genetic material and experimental design
This study included 34 F2 segregating populations belonging to the Wheat Breeding Program of the Federal University of Viçosa (UFV), Brazil, and eight commercial cultivars used as parents (Table 1). The F2 populations come from crosses conducted in 2019 (winter) in a greenhouse, involving eight parents selected for presenting genetic variability for cycle, health, and agronomic performance. The F1 seeds harvested from the crosses were sown under greenhouse conditions in the summer season of 2020 for generation advancement. Then, physiologically mature ears were harvested and threshed manually, and F2 seeds and parents were separated and arranged according to the experimental design.
The experiment was conducted in the winter season of 2020, in a randomized block design with two replications. The plots consisted of two 1.5 m rows, spaced 0.2 m apart. Sowing density was 350 seeds m-2. Cultural treatments followed technical indications for wheat cultivation in central Brazil (EMBRAPA, 2020EMBRAPA. Informações técnicas para trigo e triticale: 13ª Reunião da Comissão Brasileira de Pesquisa de Trigo e Triticale. Passo Fundo: Embrapa Trigo, 2020. 256p.). The plot was harvested manually, with manual cutting of plants, followed by mechanical threshing and cleaning and drying of grains up to 13% to determine yield per plot, in grams (g).
Statistical analysis
The Bayesian approach was used to analyze plot production data. Parameter estimates via Bayesian inference were obtained using Monte Carlo Markov Chain (MCMC) algorithms. The analysis was performed using the MCMCglmm package (HADFIELD, 2010HADFIELD, J. D. MCMC methods for multi-response generalized linear mixed models: the MCMCglmm R package. Journal of Statistical Software, v.33, p.1-22, 2010. Available from: <Available from: https://www.jstatsoft.org/article/view/v033i02 >. Accessed: May, 09, 2021.doi: 10.18637/jss.v033.i02
https://www.jstatsoft.org/article/view/v...
) in the R software (R CORE TEAM, 2020R CORE TEAM.R: A language and environment for statistical computing (version 4.02) [Software].R Foundation for Statistical Computing, Vienna, Austria, 2020. Available from: <Available from: https://www.R-project.org >. Accessed: May, 01, 2021.
https://www.R-project.org...
). A total of 1,000,000 iterations (nitt) were determined, discarding the first 50,000 (burn-in). After each set of five iterations (thin) were performed, a sample was retained, totaling a chain with 190,000 iterations, from which posterior estimates were obtained. Convergence analysis was performed according to Geweke’s criteria (GEWEKE, 1991GEWEKE, J. F. Evaluating the accuracy of sampling-basead approaches to the calculation of posterior moments. Evaluating the accuracy of sampling-basead approaches to the calculation of posterior moments.148 Federal Reserve Bank of Minneapolis Staff Report.1991. Available from: <Available from: https://www.minneapolisfed.org/research/staff-reports/evaluating-the-accuracy-of-samplingbased-approaches-to-the-calculation-of-posterior-moments >. Accessed: May, 08, 2021.doi: 10.21034/sr.148.
https://www.minneapolisfed.org/research/...
), and graphical analysis was performed using the BOA package (SMITH, 2007SMITH, B. J. Boa: an R Package for MCMC output convergence assessment and posterior inference. Journal of Statistical Sofware, v.21, p.1-37, 2007. Available from: <Available from: https://www.jstatsoft.org/article/view/v021i11 >. Accessed: May, 06, 2021. doi:10.18537/jss.v021.i11.
https://www.jstatsoft.org/article/view/v...
) of the R software (R CORE TEAM, 2020).
The posterior means and medians, credibility intervals, and standard deviation of estimates were obtained according to the linear model presented below:
y = Xb + Zg + e (1)
Where y is the vector of phenotypic values (with dimension nm × 1, where n = 42, which is the number of populations, and m = 2, which is the number of blocks), g is the vector of breeding values of populations, and e is the vector of random errors, with Equação A, where is the residual variance, and I is an identity matrix. X and Z are incidence matrices, respectively, of effects b and g.
Joint data distribution is normal, with mean and variance given by:
(2)
where is the genetic variance.
The a priori distributions of the parameters are:
(3)
(4)
(5)
(6)
Where b assumes a non-informative distribution (the normal distribution with a large variance value), G1 represents the inverse gamma distribution with hyperparameters given by, , and
(7)
Statistical inference about the parametersrelies on the posterior marginal distributions. In summary, random samples of the posterior marginal distributions are indirectly generated from the full conditional posterior distributions(f.c.p.d) (likelihood function × prior distribution of each parameter) by means of the MCMC algorithms. Thus, after a sufficiently large number of iterations, the values generated from the f.c.p.d. are samples of the posterior marginal distributions.
Two models were defined, the first with the presence of genetic effects (complete model) and the second without them (reduced models). The goodness of fit of these models was compared using the deviance information criteria (DIC) proposed by SPIEGELHALTER et al. (2002SPIEGELHALTER, D. J. et al. Bayesian measures of model complexity and fit. Journal of Royal Statistical Society, v.64, p.583-639, 2002. Available from: <Available from: https://rss.onlinelibrary.wiley.com/doi/10.1111/1467-9868.00353 >. Accessed: May, 06, 2021.doi: 10.1111;1467-9868.00353.
https://rss.onlinelibrary.wiley.com/doi/...
). The DIC is given by:
(8)
where is the deviance estimate applied to the posterior mean of the parameters of the evaluated model, and is the effective number of parameters in the model.
The density of the components of genetic and environmental variance was calculated to obtain the density and the heritability estimate (h2), as follows:
where is the genetic variance;is the residual variance.
The selection differential (SD) was obtained as follows:
SD = x̄ s - x̄ 0
wherex̄ s is the posterior mean of the selected populations (with the standardized value of 30% of selection intensity of the populations, corresponding to 12 populations), and x̄ 0 is the posterior mean of all populations and parents in the experiment.With the information on heritability and selection differential, the expected genetic gain from selection was estimated, according to FALCONER &MACKAY (1996FALCONER, D. S.; MACKAY, T. F. C. Introduction to Quantitative Genetics.4th Edition, Essex: Prentice Hall, 1996. 464p.); ST MARTIN & FUTI (2000ST MARTIN, S. K.; FUTI, X. Genetic gain in early stages of a soybean breeding program.Crop Science, v.40, p.1559-1564, 2000. Available from: <Available from: https://acsess.onlinelibrary.wiley.com/doi/pdfdirect/10.2135/cropsci2000.4061559x >. Accessed: May, 06, 2021.doi: 10.2135/cropsci2000.4061559x.
https://acsess.onlinelibrary.wiley.com/d...
), by the expression:
GS = (x̄ s - x̄ 0) × h2
and the expected genetic gain in percentage wascalculated according to the expression:
RESULTS:
The chains reached convergence by the Geweke criterion after 1,000,000 iterations at 5% significance level (Table 2). The DIC value was 895.48 for the complete model, and 933.73 for the reduced model (without the presence of genetic effects). Consequently, the best-fit model contained the population genetic effects, and the a posteriori inference will be based on it. Thus, a posteriori estimates and densities for the sources of variation, populations (pop) and error (units) were obtained. The Bayesian density distribution for heritability estimation is given in figure 1. This allows a clear graphical representation of the degree of uncertainty around the average heritability estimates; and are therefore, intuitive ways to present the results. The evaluation of the best model fit was performed using DIC, in which the model with the lowest DIC value has the best fit. In the present study, the complete model showed the best fit, with DIC equal to 895.48, to the detriment of the reduced model. This value indicated the significance of the breeding effects of the populations under study. The deviance information criterion (DIC) is widely applied to assess the goodness of fit of models in Bayesian inference (RESENDE et al., 2014RESENDE, M. D. V., et al. Estatística matemática, biométrica e computacional: modelos mistos, multivariados, categóricos e generalizados (REML/BLUP), inferência bayesiana, regressão aleatória, seleção genômica, QTL-QWAS, estatística espacial e temporal, competição, sobrevivência. Viçosa: Editora UFV, 2014. 881p.). Bayesian inference has advantages over the commonly used frequentist inference, including the incorporation of a priori knowledge and more accurate credibility intervals (0.025 and 0.975 quantile), increasing the reliability of components and estimated effects (PEIXOTO et al., 2021PEIXOTO, M. A. et al. Multiple-trait model through Bayesian inference applied to Jatropha curcasbreeding for bioenergy. Plos One, v.16, p.e0247775, 2021. Available from: <Available from: https://journals.plos.org/plosone/article?id=10.1371/journal.pone.0247775 >. Accessed: May, 06, 2021. doi:10.1371/journal.pone.0247775.
https://journals.plos.org/plosone/articl...
).

Distribution chain of mean estimates of 190,000 estimates for the sources of variation population (pop) and error (units) of the model using noninformative prior, on the left. On the right, the distribution density function corresponding to the chain.
When using noninformativea priori information, the estimates of genetic parameters obtained by Bayesian inference present values similar to those obtained by frequentist inference by restricted maximum likelihood (REML) (BEAUMONT & RANNALA, 2004BEAUMONT, M. A.; RANNALA, B.The Bayesian revolution in genetics.NatureReviews Genetics, v.5, p.251-261, 2004. Available from: <Available from: https://www.nature.com/articles/nrg1318.pdf >. Accessed: May, 08, 2021.doi:10.1038/nrg1318.
https://www.nature.com/articles/nrg1318....
). Nonetheless, SILVA et al. (2020SILVA, F. A. et al. Impact of Bayesian inference on the selection of Psidiumguajava.ScientificReports, v.10, p.1999, 2020. Available from: <Available from: https://www.nature.com/articles/s41598-020-58850-6 >. Accessed: May, 06, 2021.doi:10.1038/s41598-020-58850-6.
https://www.nature.com/articles/s41598-0...
) obtained different results when testing three approaches in segregating populations of Psidumguajava. Two of these approaches were Bayesian approaches (one with informative and the other with noninformative a priori distribution) and the other was a mixed model. The authors reported greater accuracy through Bayesian analysis with informative a priori information, followed by Bayesian analysis with noninformative a priori information and, finally, REML/BLUP analysis.
The a posteriori mean of broad-sense heritability (h²) for grain production in the plot was 0.51, the credibility intervals were HPD (0.025) 0.01 and HPD (0.975) 0.73, and the a posteriori standard deviation was 0.15 (Table 2). Figure 2 shows the results for the estimates of heritability density. According to RESENDE (2002RESENDE, M. D. V. Genética biométrica e estatística no melhoramento de plantas perenes. Brasília: Embrapa Informação Tecnológica, 2002. 975p.), the heritability of the present study (0.51) is high (h2> 0.50). This estimate is within the expected range for grain yield, considering that this characteristic is controlled by a large number of genes and is highly influenced by the environment. Previous studies on segregating wheat populations estimate heritability using frequentist approaches. For instance, AKEL et al. (2018AKEL, W. et al. Hybrid durum wheat: heterosis of grain yield and quality traits and genetic architecture of anther extrusion. Theoretical and Applied Genetics, v.132, p.921-932, 2018. Available from: <Available from: https://link.springer.com/article/10.1007%2Fs00122-018-3248-6 >. Accessed: May, 10, 2021.doi: 10.1007%2Fs00122-018-3248-6.
https://link.springer.com/article/10.100...
) analyzedseparately F1 hybrids of Triticum durum and reported an h2 of 0.67 for grain yield (t ha-1) and 0.40 analyzing the parents. In turn, PIMENTEL et al. (2014PIMENTEL, A. J. B. et al. Estimation of genetic parameters and prediction of additive genetic value for wheat by mixed models. Pesquisa Agropecuária Brasileira, v.49, p.882-890, 2014. Available from: <Available from: https://www.scielo.br/j/pab/a/kVGpm9sMMR795hTTGpdQLDB/?format=pdf⟨=pt >. Accessed: May, 07, 2021.doi: 10.1590/S0100-204X2014001100007.
https://www.scielo.br/j/pab/a/kVGpm9sMMR...
) observed heritability at an average level for grain yield equal to 39.15% in F3 populations of Triticumaestivum. The heritability value of the present study is in an intermediate position in relation to previous literature. However, it is noteworthy that estimates of genetic parameters from Bayesian analyses tend to be more accurate (SILVA et al., 2020SILVA, F. A. et al. Impact of Bayesian inference on the selection of Psidiumguajava.ScientificReports, v.10, p.1999, 2020. Available from: <Available from: https://www.nature.com/articles/s41598-020-58850-6 >. Accessed: May, 06, 2021.doi:10.1038/s41598-020-58850-6.
https://www.nature.com/articles/s41598-0...
).

Distribution chain of heritability estimates of 190,000 estimates of the model using noninformative priori, on the left. On the right, the distribution density function corresponding to the chain.
The grain yield intercept of the 34 populations and eight parents was 244.61 grams, with credibility intervals HPD (0.025) 225.92 g and HPD (0.975) 263.3 g, and with a posteriori standard deviation of 9.50 g. Significant breeding values (with credibility intervals that do not pass through zero) occurred for the populations: Tbio Aton/CD 1303, BRS 254/CD 1303, CD 1303/TbioPonteiro, Tbio Duque/Tbio Aton, and TbioSossego/Tbio Aton, being of 63.66, 76.61, 77.72, 68.8, and 92.23, respectively. All presented credibility intervals of 5% with values above zero, except for BRS 264/TbioSossego, which presented negative values (Table 2).
Bayesian models are more robust, generating more accurate estimates (JUNQUEIRA et al., 2016JUNQUEIRA, V. S. et al. Bayesian multi-trait analysis reveals a useful tool to increase oil concentration and to decrease toxicity in Jatropha curcasL. Plos One, v.11, p.e0157038, 2016. Available from: <Available from: https://journals.plos.org/plosone/article?id=10.1371/journal.pone.0157038 >. Accessed: May, 06, 2021.doi: 10.1371/journal.pone.0161046.
https://journals.plos.org/plosone/articl...
). This fact collaborates with the perspective of selection of superior populations with improved accuracy. In this context, the best F2 populations were selected for generation advancement and for deriving promising lines for the breeding program, capable of meeting the demand of agricultural producers in the Brazilian Cerrado. Since the objective is to increase average grain yield, 13 populations were selected among those with estimates higher than the overall average of the experiment.
Regarding the a posteriori standard deviation, the populations with the highest values were TbioSossego/CD 1303 (33.47 g), CD 1303/TbioPonteiro (31.18 g), and BRS 254/CD 1303 (31.03 g). Conversely, the populations with the lowest values for the a posteriori standard deviation were: BRS 264/BRS 394 (24.41 g), Tbio Duque/TbioPonteiro (24.41 g), and CD 1303/TbioSossego (24.38 g). The range between the population with the highest (TbioSossego/CD 1303) and lowest (CD 1303/TbioSossego) a posteriori standard deviation was 9.09 grams (Table 2).
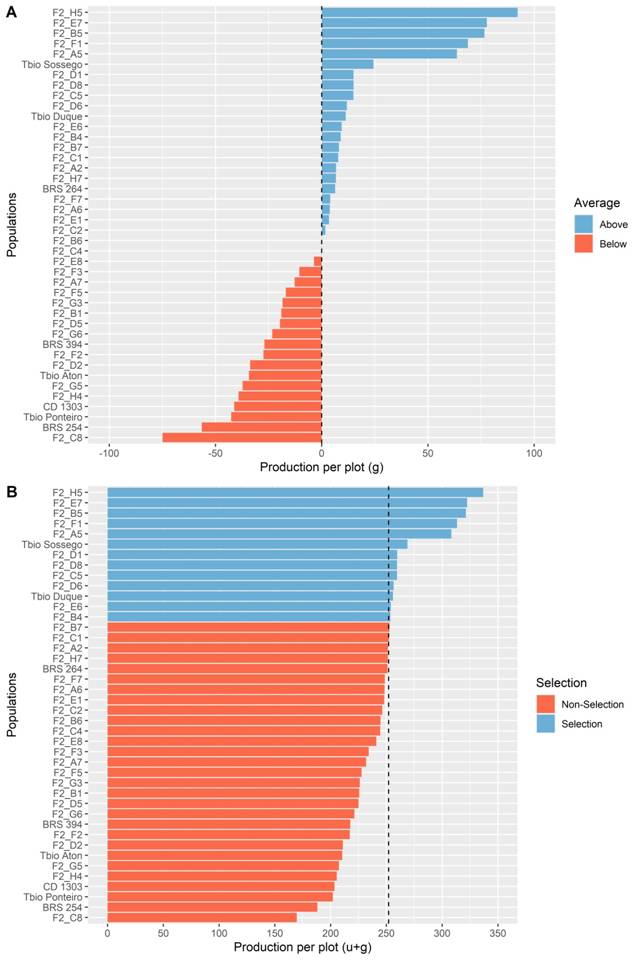
Figure 3A shows that among parents and F2 populations, 23 crosses and genotypes had positive breeding value, ranging from 0.11 to 92.23. Figure 3B shows the populations selected based on the positive breeding value intercept. When considering the group with the 13 selected populations, its mean was 282.28 g plot-1, with a selection differential of 37.67 g plot-1 in relation to the intercept of all populations and parents, of 244.61 g plot-1. The expected genetic gain from selection was 19.2 g plot-1, equivalent to 7.8%, for a selection intensity of 30%. The smallest positive breeding value intercept within the selected group belongs to population F2_B4 (BRS 254/BRS 394), with 253.55 g plot-1. The population with the highest average was F2_H5 (TbioSossego/CD 1303), with average plot production of 336.84 g plot-1.

Estimates of genetic value (A) and genetic value plus intercept (B) of 34 F2 populations and eight tropical wheat cultivars obtained by Bayesian approach for the yield per plot trait (g). Viçosa, MG, 2020.
The populations F2_H5 (TbioSossego/CD 1303), F2_E7 (CD 1303/TbioPonteiro), F2_B5 (BRS 254/CD 1303), F2_F1 (Tbio Duque/Tbio Aton), and F2_A5 (Tbio Aton/CD 1303) showed average grain yield per plot superior to all parents used in the crosses and in the experiment as controls. This shows the potential for selection of superior transgressive individuals within the wheat populations developed by the UFV Wheat Breeding Program, with a view to meeting the demand of the agricultural market in the Brazilian Cerrado.Another six F2 populations of tropical wheat were selected together with two commercial control cultivars, Tbio Duque and TbioSossego.
The five populations that showed significant genetic effects, mentioned in the previous paragraph, presented an average estimate of 320.41 g plot-1. The intercept of all hybrid and parent combinations was 244.61 g plot-1. For the selection differential (SD) between populations with significant genetic effects and all combinations, SD was 75.80 g plot-1. Considering only the parents used, the differences are even greater, since the average of the parents was of 234.29 g plot-1, then the SD was 86.12 g plot-1.
Of the five F2 populations with significant effects, the three populations with the highest breeding values were TbioSossego/ CD 1303 (F2_H5), CD 1303/TbioPonteiro (F2_E7), and BRS 254/CD 1303 (F2_B5). For the three most promising populations among all 34 combinations, crosses involving wheat parents from different breeders (BiotrigoGenética, Coodetec, and EmbrapaTrigo) resulted in F2 populations with high average grain yield plot-1, and with greater probability of extracting wheat progenies with satisfactory agronomic performance.
Strategies aimed launching cultivars with high yield potential are desirable, as they allow the intensification of wheat agricultural areas and enable satisfactory gains in production per unit of area. However, the intensification of annual gain in wheat yield is limited, with indications of stagnation. BECHE et al. (2014BECHE, E. et al. Genetic gain in yield and changes associated with physiological traits in Brazilian wheat during the 20th century. European Journal of Agronomy, v.61, p.49-59, 2014. Available from: <Available from: https://www.sciencedirect.com/science/article/pii/S1161030114000975 >. Accessed: May, 06, 2021.doi: 10.1016/j.eja.2014.08.005.
https://www.sciencedirect.com/science/ar...
) reported gains of 0.92% year-1 when evaluating wheat cultivars released in the last 60 years in Brazil. In turn, WOYANN et al. (2019WOYANN, L. G. et al. Genetic gain over 30 years of spring wheat breeding in Brazil.CropScience, v.59, p.2036-2045, 2019. Available from: <Available from: https://acsess.onlinelibrary.wiley.com/doi/full/10.2135/cropsci2019.02.0136 >. Accessed: May, 09, 2021.doi: 10.2135/cropsci2019.02.0136.
https://acsess.onlinelibrary.wiley.com/d...
) observed gains of up to 1.28% year-1 in cultivars released between 1985 and 2014. Therefore, the significant selection gains obtained are noteworthy, especially when considering the gain of selected F2 populations in relation to the parents, which are commercial cultivars.
The results of the gains are expressive and point to the possibility of extracting lines with high yield. It is noteworthy that the F2 populations come from crosses involving parents from different breeders. This is because the maintenance of existing variability in groups of segregating populations allows for the improvement of selection, with a consequent increase in gains. The alleles fixed for a certain variable of a germplasm are usually different from those fixed for the same variable of another germplasm, thus leading to gene complementarity, which increases the possibility of identifying superior transgressive individuals.
CONCLUSION:
Considering F2 populations of tropical wheat, Bayesian inference provided an adequate model fit for the dataset. This approach can be used in tropical wheat breeding programs in early generation populations. Finally, 11 F2 populations showed superior performance and were selected for generation advancement.
ACKNOWLEDGMENTS
Thanks to Professor Fabyano Fonseca e Silva bright knowledge that always gave us. This study was financed in part by the Coordenação de Aperfeiçoamento de Pessoal de Nível Superior - Brazil (CAPES) - Finance Code 001. We would like to thank the Conselho Nacional de DesenvolvimentoCientífico e Tecnológico (CNPq) for the financial aid and the scholarships granted.
-
Erratum
In the article "Nigeria’s cocoa exports: a gravity model approach" published in Ciência Rural, volume 53, number 7, DOI http://dx.doi.org/10.1590/0103-8478cr20220043.In the author’s where we read:Henrique Caletti MezzmoRead:Henrique Caletti Mezzomo
REFERENCES
- AKEL, W. et al. Hybrid durum wheat: heterosis of grain yield and quality traits and genetic architecture of anther extrusion. Theoretical and Applied Genetics, v.132, p.921-932, 2018. Available from: <Available from: https://link.springer.com/article/10.1007%2Fs00122-018-3248-6 >. Accessed: May, 10, 2021.doi: 10.1007%2Fs00122-018-3248-6.
» https://doi.org/10.1007%2Fs00122-018-3248-6.» https://link.springer.com/article/10.1007%2Fs00122-018-3248-6 - AZEVEDO, A. M. et al. Population parameters and selection of kale genotypes using Bayesian inference in a multi-trait linear model.ActaScientiarum.Agronomy, v.39, p.25-31, 2017. Available from: <Available from: https://www.scielo.br/j/asagr/a/tQX6mFhBzJ5rPTtnZZN9YmR/?format=pdf⟨=en >. Accessed: May, 06, 2021.doi: 10.4025/actasciagron.v39i1.30856.
» https://doi.org/10.4025/actasciagron.v39i1.30856.» https://www.scielo.br/j/asagr/a/tQX6mFhBzJ5rPTtnZZN9YmR/?format=pdf⟨=en - BECHE, E. et al. Genetic gain in yield and changes associated with physiological traits in Brazilian wheat during the 20th century. European Journal of Agronomy, v.61, p.49-59, 2014. Available from: <Available from: https://www.sciencedirect.com/science/article/pii/S1161030114000975 >. Accessed: May, 06, 2021.doi: 10.1016/j.eja.2014.08.005.
» https://doi.org/10.1016/j.eja.2014.08.005.» https://www.sciencedirect.com/science/article/pii/S1161030114000975 - BEAUMONT, M. A.; RANNALA, B.The Bayesian revolution in genetics.NatureReviews Genetics, v.5, p.251-261, 2004. Available from: <Available from: https://www.nature.com/articles/nrg1318.pdf >. Accessed: May, 08, 2021.doi:10.1038/nrg1318.
» https://doi.org/10.1038/nrg1318» https://www.nature.com/articles/nrg1318.pdf - BOX, G.; TIAO, G. C. Bayesian inference in statistical analysis.New York: Journal Wiley Interscience, 1992. 608p.
- CONAB. Acompanhamento da safra brasileira de grãos, 2021.Available from: <Available from: https://www.conab.gov.br/ingo-agro/safras/graos/boletim-da-safra-de-graos >. Accessed: May, 06, 2021.
» https://www.conab.gov.br/ingo-agro/safras/graos/boletim-da-safra-de-graos - EMBRAPA. Informações técnicas para trigo e triticale: 13ª Reunião da Comissão Brasileira de Pesquisa de Trigo e Triticale. Passo Fundo: Embrapa Trigo, 2020. 256p.
- FALCONER, D. S.; MACKAY, T. F. C. Introduction to Quantitative Genetics.4th Edition, Essex: Prentice Hall, 1996. 464p.
- FASAHAT, P. et al. Principles and utilization of combining ability in plant breeding.Biometrics & Biostatistics International Journal, v.4, p.1-11, 2016. Available from: <Available from: http://medcraveonline.com/BBIJ/BBIJ-04-00085.pdf >. Accessed: May, 06, 2021.doi: 10.15406/bbij.2016.04.00085.
» https://doi.org/10.15406/bbij.2016.04.00085.» http://medcraveonline.com/BBIJ/BBIJ-04-00085.pdf - GEWEKE, J. F. Evaluating the accuracy of sampling-basead approaches to the calculation of posterior moments. Evaluating the accuracy of sampling-basead approaches to the calculation of posterior moments.148 Federal Reserve Bank of Minneapolis Staff Report.1991. Available from: <Available from: https://www.minneapolisfed.org/research/staff-reports/evaluating-the-accuracy-of-samplingbased-approaches-to-the-calculation-of-posterior-moments >. Accessed: May, 08, 2021.doi: 10.21034/sr.148.
» https://doi.org/10.21034/sr.148.» https://www.minneapolisfed.org/research/staff-reports/evaluating-the-accuracy-of-samplingbased-approaches-to-the-calculation-of-posterior-moments - GONÇALVES-VIDIGAL, M. C. et al. Heritability of quantitative traits in segregating common bean families using a Bayesian approach.Euphytica, v.164, p.551-560, 2008. Available from: <https://link.springer.com/article/10.1007/s10681-008-9758-6>. doi: 10.1007/s10681-008-9758-6.
» https://doi.org/10.1007/s10681-008-9758-6.» https://link.springer.com/article/10.1007/s10681-008-9758-6 - HADFIELD, J. D. MCMC methods for multi-response generalized linear mixed models: the MCMCglmm R package. Journal of Statistical Software, v.33, p.1-22, 2010. Available from: <Available from: https://www.jstatsoft.org/article/view/v033i02 >. Accessed: May, 09, 2021.doi: 10.18637/jss.v033.i02
» https://doi.org/10.18637/jss.v033.i02» https://www.jstatsoft.org/article/view/v033i02 - JUNQUEIRA, V. S. et al. Bayesian multi-trait analysis reveals a useful tool to increase oil concentration and to decrease toxicity in Jatropha curcasL. Plos One, v.11, p.e0157038, 2016. Available from: <Available from: https://journals.plos.org/plosone/article?id=10.1371/journal.pone.0157038 >. Accessed: May, 06, 2021.doi: 10.1371/journal.pone.0161046.
» https://doi.org/10.1371/journal.pone.0161046.» https://journals.plos.org/plosone/article?id=10.1371/journal.pone.0157038 - MAHJOURIMAJD, S. et al.The genetic control of grain protein content under variable nitrogen supply in an Australian wheat mapping population.PlosOne, v.11, p.e0159371, 2016. Available from: <Available from: https://journals.plos.org/plosone/article?id=10.1371/journal.pone.0159371 >. Accessed: May, 07, 2021.doi: 10.1371/journal.pone.0159371.
» https://doi.org/10.1371/journal.pone.0159371.» https://journals.plos.org/plosone/article?id=10.1371/journal.pone.0159371 - MORA, F., et al. Bayesian analysis of growth stem straightness and branching quality in full-sib families of Eucalyptus globulus Bragantia, v.78, p.328-336, 2019.Available from: <Available from: https://www.scielo.br/j/brag/a/HWFYNjgj4yyQsf9cHyKwsCf/?format=pdf⟨=en >. Accessed: May, 07, 2021. doi:10.1590/1678-4499.20180317.
» https://doi.org/10.1590/1678-4499.20180317» https://www.scielo.br/j/brag/a/HWFYNjgj4yyQsf9cHyKwsCf/?format=pdf⟨=en - NASCIMENTO, M. et al. Bayesian segmented regression model for adaptability and stability evaluation of cotton genotypes. Euphytica , v.16, p.30, 2020. Available from: <Available from: https://link.springer.com/content/pdf/10.1007/s10681-020-2564-5.pdf >. Accessed: May 06, 2021.doi: 10.1007/s10681-020-2564-5.
» https://doi.org/10.1007/s10681-020-2564-5.» https://link.springer.com/content/pdf/10.1007/s10681-020-2564-5.pdf - OLIVEIRA, T. R. A. et al. The Eberhart and Russel’s Bayesian method used as na instrument to select maize hybrids. Euphytica , v.214, p.64, 2018. Available from: <Available from: https://www.researchgate.net/publication/323648251_The_Eberhart_and_Russel’s_Bayesian_method_used_as_an_instrument_to_select_maize_hybrids >. Accessed: May, 06, 2021.doi: 10.1007/s10681-018-2146-y.
» https://doi.org/10.1007/s10681-018-2146-y.» https://www.researchgate.net/publication/323648251_The_Eberhart_and_Russel’s_Bayesian_method_used_as_an_instrument_to_select_maize_hybrids - PASINATO, A. et al. Potential area and limitations for the expansion of rainfed wheat in the Cerrado biome of Central Brazil.Pesquisa Agropecuária Brasileira, v.53, p.779-790, 2018. Available from: <Available from: https://www.scielo.br/j/pab/a/kt7GB4x5sf4GDg4XYfy6sZx/?format=pdf⟨=en >. Accessed: May, 06, 2021.doi: 10.1590/s0100-204x2018000700001.
» https://doi.org/10.1590/s0100-204x2018000700001.» https://www.scielo.br/j/pab/a/kt7GB4x5sf4GDg4XYfy6sZx/?format=pdf⟨=en - PEIXOTO, M. A. et al. Multiple-trait model through Bayesian inference applied to Jatropha curcasbreeding for bioenergy. Plos One, v.16, p.e0247775, 2021. Available from: <Available from: https://journals.plos.org/plosone/article?id=10.1371/journal.pone.0247775 >. Accessed: May, 06, 2021. doi:10.1371/journal.pone.0247775.
» https://doi.org/10.1371/journal.pone.0247775» https://journals.plos.org/plosone/article?id=10.1371/journal.pone.0247775 - PIMENTEL, A. J. B. et al. Estimation of genetic parameters and prediction of additive genetic value for wheat by mixed models. Pesquisa Agropecuária Brasileira, v.49, p.882-890, 2014. Available from: <Available from: https://www.scielo.br/j/pab/a/kVGpm9sMMR795hTTGpdQLDB/?format=pdf⟨=pt >. Accessed: May, 07, 2021.doi: 10.1590/S0100-204X2014001100007.
» https://doi.org/10.1590/S0100-204X2014001100007.» https://www.scielo.br/j/pab/a/kVGpm9sMMR795hTTGpdQLDB/?format=pdf⟨=pt - R CORE TEAM.R: A language and environment for statistical computing (version 4.02) [Software].R Foundation for Statistical Computing, Vienna, Austria, 2020. Available from: <Available from: https://www.R-project.org >. Accessed: May, 01, 2021.
» https://www.R-project.org - RESENDE, M. D. V. Genética biométrica e estatística no melhoramento de plantas perenes. Brasília: Embrapa Informação Tecnológica, 2002. 975p.
- RESENDE, M. D. V., et al. Estatística matemática, biométrica e computacional: modelos mistos, multivariados, categóricos e generalizados (REML/BLUP), inferência bayesiana, regressão aleatória, seleção genômica, QTL-QWAS, estatística espacial e temporal, competição, sobrevivência. Viçosa: Editora UFV, 2014. 881p.
- SEARLE, S. R., et al. Variance components. New York: John Wiley & Sons. 501p, 1992.
- ST MARTIN, S. K.; FUTI, X. Genetic gain in early stages of a soybean breeding program.Crop Science, v.40, p.1559-1564, 2000. Available from: <Available from: https://acsess.onlinelibrary.wiley.com/doi/pdfdirect/10.2135/cropsci2000.4061559x >. Accessed: May, 06, 2021.doi: 10.2135/cropsci2000.4061559x.
» https://doi.org/10.2135/cropsci2000.4061559x.» https://acsess.onlinelibrary.wiley.com/doi/pdfdirect/10.2135/cropsci2000.4061559x - SILVA, H. T. et al. Alternative count Bayesian models for genetic evaluation of litter traits in pigs. LivestockScience, v.225, p.140:143, 2019. Available from: <Available from: https://www.sciencedirect.com/science/article/pii/S1871141319303324?via%3Dihub >. Accessed: May, 08, 2021. doi:10.1016/j.livsci.2019.05.006.
» https://doi.org/10.1016/j.livsci.2019.05.006» https://www.sciencedirect.com/science/article/pii/S1871141319303324?via%3Dihub - SILVA, F. A. et al. Impact of Bayesian inference on the selection of PsidiumguajavaScientificReports, v.10, p.1999, 2020. Available from: <Available from: https://www.nature.com/articles/s41598-020-58850-6 >. Accessed: May, 06, 2021.doi:10.1038/s41598-020-58850-6.
» https://doi.org/10.1038/s41598-020-58850-6» https://www.nature.com/articles/s41598-020-58850-6 - SMITH, B. J. Boa: an R Package for MCMC output convergence assessment and posterior inference. Journal of Statistical Sofware, v.21, p.1-37, 2007. Available from: <Available from: https://www.jstatsoft.org/article/view/v021i11 >. Accessed: May, 06, 2021. doi:10.18537/jss.v021.i11.
» https://doi.org/10.18537/jss.v021.i11» https://www.jstatsoft.org/article/view/v021i11 - SPIEGELHALTER, D. J. et al. Bayesian measures of model complexity and fit. Journal of Royal Statistical Society, v.64, p.583-639, 2002. Available from: <Available from: https://rss.onlinelibrary.wiley.com/doi/10.1111/1467-9868.00353 >. Accessed: May, 06, 2021.doi: 10.1111;1467-9868.00353.
» https://doi.org/10.1111;1467-9868.00353.» https://rss.onlinelibrary.wiley.com/doi/10.1111/1467-9868.00353 - THORWARTH, P. et al. Dissecting the genetics underlying the relationship between protein and grain yield in a large hybrid wheat population. Theoretical and Applied Genetics , v.132, p.489-500, 2019. Available from: <Available from: https://pubmed.ncbi.nlm.nih.gov/30456718 >. Accessed: May, 08, 2021.doi: 10.1007/s00122-018-3236-x.
» https://doi.org/10.1007/s00122-018-3236-x.» https://pubmed.ncbi.nlm.nih.gov/30456718 - WALDMANN, P.; ERICSSON, T. Comparison of REML and Gibbs sampling estimates of multi-trait genetic parameters in Scots pine. Theoretical and Applied Genetics , v.112, p.1441-1451, 2006. Available from: <Available from: https://pubmed.ncbi.nlm.nih.gov/16544126 >. Accesed: May, 06, 2021. doi: 10.1007/s00122-006-0246-x.
» https://doi.org/10.1007/s00122-006-0246-x.» https://pubmed.ncbi.nlm.nih.gov/16544126 - WOYANN, L. G. et al. Genetic gain over 30 years of spring wheat breeding in Brazil.CropScience, v.59, p.2036-2045, 2019. Available from: <Available from: https://acsess.onlinelibrary.wiley.com/doi/full/10.2135/cropsci2019.02.0136 >. Accessed: May, 09, 2021.doi: 10.2135/cropsci2019.02.0136.
» https://doi.org/10.2135/cropsci2019.02.0136.» https://acsess.onlinelibrary.wiley.com/doi/full/10.2135/cropsci2019.02.0136
-
CR-2022-0043.R1
Edited by
Publication Dates
-
Publication in this collection
21 Nov 2022 -
Date of issue
2023
History
-
Received
31 Jan 2022 -
Accepted
03 Aug 2022 -
Reviewed
29 Sept 2022