Abstracts
Spectral information is well related with agronomic variables and can be used in crop monitoring and yield forecasting. This paper describes a multitemporal research with the sugarcane variety SP80-1842, studying its spectral behavior using field spectroscopy and its relationship with agronomic parameters such as leaf area index (LAI), number of stalks per meter (NPM), yield (TSS) and total biomass (BMT). A commercial sugarcane field in Araras/SP/Brazil was monitored for two seasons. Radiometric data and agronomic characterization were gathered in 9 field campaigns. Spectral vegetation indices had similar patterns in both seasons and adjusted to agronomic parameters. Band 4 (B4), Simple Ratio (SR), Normalized Difference Vegetation Index (NDVI), and Soil Adjusted Vegetation Index (SAVI) increased their values until the end of the vegetative stage, around 240 days after harvest (DAC). After that stage, B4 reflectance and NDVI values began to stabilize and decrease because the crop reached ripening and senescence stages. Band 3 (B3) and RVI presented decreased values since the beginning of the cycle, followed by a stabilization stage. Later these values had a slight increase caused by the lower amount of green vegetation. Spectral variables B3, RVI, NDVI, and SAVI were highly correlated (above 0.79) with LAI, TSS, and BMT, and about 0.50 with NPM. The best regression models were verified for RVI, LAI, and NPM, which explained 0.97 of TSS variation and 0.99 of BMT variation.
NDVI; vegetation index; biomass; field spectroscopy; temporal evolution
A informação espectral tem boa relação com variáveis agronômicas e pode contribuir com informações para o monitoramento, acompanhamento e previsão de safras. O presente trabalho descreve a análise multitemporal do comportamento espectral da variedade de cana-de-açúcar SP80-1842 e a relação com variáveis agronômicas como índice de área foliar (IAF), número de perfilhos por metro (NPM), produtividade (TCH) e biomassa total (BMT). Nas safras 2000/2001 e 2001/2002, um talhão comercial, localizada no município de Araras/SP foi monitorado em nove campanhas de coleta de dados radiométricos e agronômicos. O comportamento temporal das variáveis espectrais acompanhou o comportamento das variáveis agronômicas. A banda 4 (B4), o índice de vegetação da razão simples (SR), o índice de vegetação por diferença normalizada (NDVI) e o índice de vegetação ajustado ao solo (SAVI) aumentaram seus valores até o fim da fase de crescimento vegetativo, aproximadamente até os 240 dias após o corte, a partir do qual os valores se estabilizaram e diminuíram em função da entrada da cultura na fase de maturação. A banda 3 (B3) e o índice de vegetação da razão (RVI) tiveram queda em seus valores desde o início do ciclo, com posterior estabilização e aumento em seus valores devido ao aumento da quantidade de palha e da queda da biomassa foliar. As variáveis espectrais B3, RVI, NDVI e SAVI tiveram correlações maiores que 0,79 com as variáveis IAF e BMT e de aproximadamente 0,50 com o NPM. Os melhores modelos de regressão linear múltipla foram os com RVI, IAF e NPM e explicaram 0,97 da variação da TCH e 0,99 da BMT.
NDVI; índices de vegetação; biomassa; índice de área foliar; evolução temporal da cultura
AGRICULTURAL ENGINEERING
Spectral variables, growth analysis and yield of sugarcane
Variáveis espectrais e indicadores de desenvolvimento e produtividade da cana-de-açúcar
Maurício dos Santos SimõesI; Jansle Vieira RochaI; Rubens Augusto Camargo LamparelliIII,* * Corresponding author < rubens@cpa.unicamp.br>
IUNICAMP/FEAGRI - Programa de Pós-Graduação em Engenharia Agrícola
IIUNICAMP/FEAGRI - Depto. de Planejamento e Desenvolvimento Rural Sustentável, C.P. 6011 - 13083-970 - Campinas, SP - Brasil
IIIUNICAMP/CEPAGRI - Centro de Pesquisas Meteorológicas e Climáticas Aplicadas a Agricultura - Cidade Universitária Zeferino Vaz, s/n. - 13083-970 - Campinas, SP - Brasil
ABSTRACT
Spectral information is well related with agronomic variables and can be used in crop monitoring and yield forecasting. This paper describes a multitemporal research with the sugarcane variety SP80-1842, studying its spectral behavior using field spectroscopy and its relationship with agronomic parameters such as leaf area index (LAI), number of stalks per meter (NPM), yield (TSS) and total biomass (BMT). A commercial sugarcane field in Araras/SP/Brazil was monitored for two seasons. Radiometric data and agronomic characterization were gathered in 9 field campaigns. Spectral vegetation indices had similar patterns in both seasons and adjusted to agronomic parameters. Band 4 (B4), Simple Ratio (SR), Normalized Difference Vegetation Index (NDVI), and Soil Adjusted Vegetation Index (SAVI) increased their values until the end of the vegetative stage, around 240 days after harvest (DAC). After that stage, B4 reflectance and NDVI values began to stabilize and decrease because the crop reached ripening and senescence stages. Band 3 (B3) and RVI presented decreased values since the beginning of the cycle, followed by a stabilization stage. Later these values had a slight increase caused by the lower amount of green vegetation. Spectral variables B3, RVI, NDVI, and SAVI were highly correlated (above 0.79) with LAI, TSS, and BMT, and about 0.50 with NPM. The best regression models were verified for RVI, LAI, and NPM, which explained 0.97 of TSS variation and 0.99 of BMT variation.
Key words:NDVI, vegetation index, biomass, field spectroscopy, temporal evolution
RESUMO
A informação espectral tem boa relação com variáveis agronômicas e pode contribuir com informações para o monitoramento, acompanhamento e previsão de safras. O presente trabalho descreve a análise multitemporal do comportamento espectral da variedade de cana-de-açúcar SP80-1842 e a relação com variáveis agronômicas como índice de área foliar (IAF), número de perfilhos por metro (NPM), produtividade (TCH) e biomassa total (BMT). Nas safras 2000/2001 e 2001/2002, um talhão comercial, localizada no município de Araras/SP foi monitorado em nove campanhas de coleta de dados radiométricos e agronômicos. O comportamento temporal das variáveis espectrais acompanhou o comportamento das variáveis agronômicas. A banda 4 (B4), o índice de vegetação da razão simples (SR), o índice de vegetação por diferença normalizada (NDVI) e o índice de vegetação ajustado ao solo (SAVI) aumentaram seus valores até o fim da fase de crescimento vegetativo, aproximadamente até os 240 dias após o corte, a partir do qual os valores se estabilizaram e diminuíram em função da entrada da cultura na fase de maturação. A banda 3 (B3) e o índice de vegetação da razão (RVI) tiveram queda em seus valores desde o início do ciclo, com posterior estabilização e aumento em seus valores devido ao aumento da quantidade de palha e da queda da biomassa foliar. As variáveis espectrais B3, RVI, NDVI e SAVI tiveram correlações maiores que 0,79 com as variáveis IAF e BMT e de aproximadamente 0,50 com o NPM. Os melhores modelos de regressão linear múltipla foram os com RVI, IAF e NPM e explicaram 0,97 da variação da TCH e 0,99 da BMT.
Palavras-chave:NDVI, índices de vegetação, biomassa, índice de área foliar, evolução temporal da cultura
INTRODUCTION
Although remote sensing has a great potential to be used with sugarcane, only a few reports have been developed in this area, such as Rudorff (1985), Rudorff & Batista (1990), Joaquim (1998), and Pellegrino (2000). Yet there is still a lack of studies on spectral behavior using field radiometry, the foundation of orbital remote sensing studies, probably in view of the difficulties in collecting data in a large crop and because of long growing period.
Spectral vegetation indices (VIs), such as Simple Ratio Vegetation Indices (RVI), Normalized difference vegetation index (NDVI), and Soil-adjusted vegetation index (SAVI) may enhance the spectral differences between spectral bands and allow inferences to be made on vegetation vigor and productivity conditions (Wiegand et al., 1991 and Jackson & Huete, 1991 and Qi et al., 1994). Several authors compared these indices and showed variations in the sensitivity to the amount of vegetation at different development stages of crops (Huete, 1988 and Hoffer, 1978). These results have demonstrated that depending on the stage in which the crop is analyzed along the cycle, there will be a more adequate vegetation index for growth cycle studies, with a higher/better relation with crop biomass. Existing the necessity to evaluate the best index for each stage of the cycle and the different crops; and that the indices have a high correlation with parameters associated with the development and productivity of plants, such as vegetation density, cover and green leaf biomass (Tucker, 1979), and leaf area index (Wiegand et al., 1991). Therefore, these indices may contribute to the understanding sugarcane development, also monitoring yield due to their relation with productivity. It was here sought to evaluate VIs designed to monitor biomass and productivity, and to test the relations between spectral data and sugarcane productivity, having in view the use of this technique to predict crop production.
MATERIAL AND METHODS
The experiment was conducted in a commercial sugarcane area, located in the municipality of Araras, SP, Brazil at longitudes between 47º19'01"W and 47º19'30"W, and latitudes between 22º21'45"S and 22º22'17"S, planted with the variety SP80-1842, at the fourth and fifth ratton under the mechanized harvest system without trash burning (Copersucar, 1993), and grown on three soil classes: A very clayey-textured Rhodic Eutrudox (LVef), a clayey-textured Rhodic Hapludox (LVd), and a clayey-textured Typic Hapludox (LVAd).
During the 2000-2001 and 2001-2002 cropping seasons, the sugarcane vegetative cycle was monitored by nine field campaigns. In order to represent the crop cycles, field spectroscopy data and agronomic variables were collected at the three basic development stages of the crop, i.e., establishment, vegetative development, and stabilization/senesce (Magalhães, 1979). The first data collection was on 28 September 2000 to obtain soil and straw reflectances. On 30 October 2000 and 02 November 2001, field spectroscopy data were collected regarding the vegetative state of the crop (sugarcane with a maximum height of 70 cm). Data that refers to the vegetative development stage was collected on 03 February and 08 April 2001; and on 10 March and 11 April 2002, when the sugarcane had a height between 1.50 and 2.00 m. In the third stage of the cycle, which is the sugarcane maturation stage (height of 3.5 to 4.0 meters), data were collected on 18 July 2001 and 31 August 2002.
The sampling grid used to collect the data was composed of 18 sampling points and was identical to the grid employed by Simões et al. (2003) to collect agronomic variables for the crop. The sampling points for collecting spectroscopy data was obtained through stratified sampling with a regular 50-meter grid and a 25-meter border, which took into account soil type, the existence or not of a straw mulch and the number of radiometric measurements that could be made in the interval from 0900 to 1300 hours. Figure 1 illustrates the location of sampling points on a Landsat 7/ETM+ image, point-orbit 220/75 on 05 April 2000.
Two CIMEL CE 313a radiometers were used to obtain the spectral data. The descriptions for the bands of these radiometers and their characteristics are presented in Table 1, also showing the coincidence with Landsat 7 ETM+ bands, which allows the data collected in the field to be extrapolated and compared with orbital data (Milton, 1987). Therefore, since the data of filters 1 and 2 are equivalent to bands 4 and 3 of the ETM+/Landsat-7, they will be hereafter treated as bands 4 and 3 (B4 and B3), respectively. The Cimel radiometer is a directional radiometer with a 10º fieldview (FOV), measuring spectral radiance with silicon (Si) and germanium (Ge) sensors for their five spectral bands. Spectral filters in each of them determine their bandwidths and band positions.
Two radiometers were used in order to improve data collection performance, which allowed a greater number of measurements to be taken during the appointed period. On the other hand, it was necessary to inter-calibrate boths, in order to achieve good data collection tuning by both data collection groups.
Reflectance Factor (RF) calculated data using the solar irradiance was obtained by means of a LICOR LI-1800 spectroradiometer. This spectroradiometer has a cosine radiation receptor, which allows solar irradiance monitoring on a hemispheric plan (180 degrees) at constant intervals (an average of every five minutes, for example). In this way, the necessity to use a barium sulfate (BaSO4) plate within the area cultivated with the crop was eliminated, and the plate was used only for intercalibration of the radiometers in the laboratory. The spectroradiometer was left outside the planted area, in the central carrier between two stands, to prevent any interference of the crop itself and of other targets on the solar irradiance values. Five radiometric measurements were made with the model CE313a CIMEL radiometer at each sampling point, according to a methodology proposed by Huete et al. (1985), so that the measurements made by the radiometer on the cropping rows and between rows and detected different soil cover conditions and amounts of plant material. The average of these five measurements considered the spectral radiance for the point. These measurements were made in a synchronized way with the solar irradiance measurements, so that the reflectance factor (RF) would be obtained reliably and would faithfully represent crop reflectance.
The reflectance factor for the points was calculated by means of equation 1 from Duggin & Cunia (1983):

where: RF is the reflectance factor, Ir is the radiance measure for the target, Io is the solar irradiance; Cr is the calibration constant between radiometers, expressed by the ratio between measured irradiance and radiance measured at the standard plate: Io/Iy (standard), RSr is the reflectance factor for the standard plate measured in the laboratory.
After reflectance was determined, the vegetation indices were calculated from equations 2, 3, 4, and 5:


where V is reflectance in red (B3), IVP is reflectance in near infrared (B4), and L is the adjustment constant for the soil effect on the vegetation index, assumed to be 0.5.
Data relative to the crop agronomic and biophysical parameters were collected simultaneously with the field campaigns to collect radiometry data, as described in Simões et al. (2003). In the specific case of sugarcane, number of tillers and stalk weight represent the most important crop components that can be measured with good correlation to productivity (Gheller et al., 1999). In addition to these, LAI is a biophysical parameter that can be of help in estimating the productivity of crops, and has a verified relation with spectral data (Xavier, 2003). Counts of the number of tillers per meter were made in all field campaigns, as well as LAI measurements, and measurements were repeated three times per sampling point. Crop biomass data (BMT) at the 18 sampling points were obtained by harvesting two linear meters of sugarcane from three adjacent sugarcane rows at the establishment and development stages of the crop. Phytomass was divided into aerial phytomass (leaves), stalk phytomass, and straw phytomass in order to obtain stalk productivity per hectare (TSS). Harvest was performed on 18 July 2001 and 13 August 2002, and data referred to the final or stabilization stage, by harvesting plots containing ten rows by 15 meters inside the stand. After mechanized harvest of the whole stand, the plot were not harvested, and the sugarcane was left standing to allow data collection. Such plot were harvested manually, so as to allow the separation of leaves, stalks, and straw. These data, individually manipulated, were correlated and studied under the view of their relation with crop spectral response.
The temporal analysis of the spectral data in both cropping seasons was made using the AJUSTE software program (Zullo Jr. & Arruda, 1986). We tried to fit curves that would describe the evolution of crop spectral behavior along the cycles. The results were also evaluated in relation to crop physiological stages, to verify whether agreement existed with crop evolution and with field data. Based on the mean data for the stand, regression analysis were performed in order to obtain curve fitting, between DAC and the spectral data (B3, B4, SR, RVI, NDVI, and SAVI).
The study of the relation between the spectral data B3, B4, SR, RVI, NDVI, and SAVI, and TSS and BMT was performed by multiple linear regression, using the Stepwise procedure of the MiniTab 13 for Windows computing program. The regressions were generated from the mean data obtained in both cropping seasons studied. For each model was performed a percentage efficacy model using r2 as the indicator; analysis of the model adequacy through Analysis of Variance (ANOVA) to evaluate the significance of the model; and analysis of the normality of residues and autocorrelation of residues, to determine whether the proposed models should be accepted or rejected.
RESULTS AND DISCUSSION
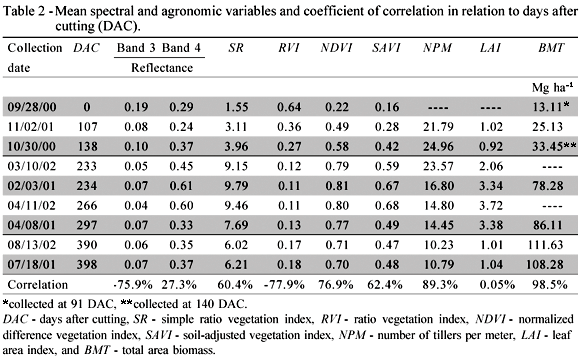
The temporal analysis of the behavior of the mean spectral data obtained in the field campaigns during both cropping seasons showed a correlated behavior between the spectral data and crop development, measured in days after cutting (DAC), as indicated by the high Pearson correlation index values (significance at 5%) (Table 2). In addition, the spectral data presented high correlations, demonstrating that these data may be more suitable than agronomic data for temporal monitoring studies of crops. Of the spectral variables, only B4 had a correlation below 50% with sugarcane temporal development, represented by DAC, possibly due to the high variability of the canopy at more advanced cutting stages, such as the fourth and fifth cuts, studied in this experiment.
Variation in the canopy exposes the bottom layers, with higher amounts of dead leaves and straw, and also exposes sugarcane stalks; this interferes with the correlation between B4 and the agronomic variables. This correlation should be high, since B4 holds a high relation with canopy structure and amount of leaves (Epiphanio et al., 1996; Wiegand et al., 1991). In spite of this low correlation with B4, correlation of DAC with the vegetation indices was not affected, and presented values higher than 60%, which suggests that the use of vegetation indices to study sugarcane could be better than using the reflectance of spectral bands separately. On the other hand, B3 and RVI had a negative correlation with DAC, demonstrating that their values decrease as the crop develops, in view of the rapid saturation of B3 caused by the increase in crop biomass and its high correlation with leaf pigments (Epiphanio & Huete, 1995). This result suggests the occurrence of different and complementary contributions of the vegetation indices on crop canopy behavior and on sugarcane development (Baret & Guyot, 1991).
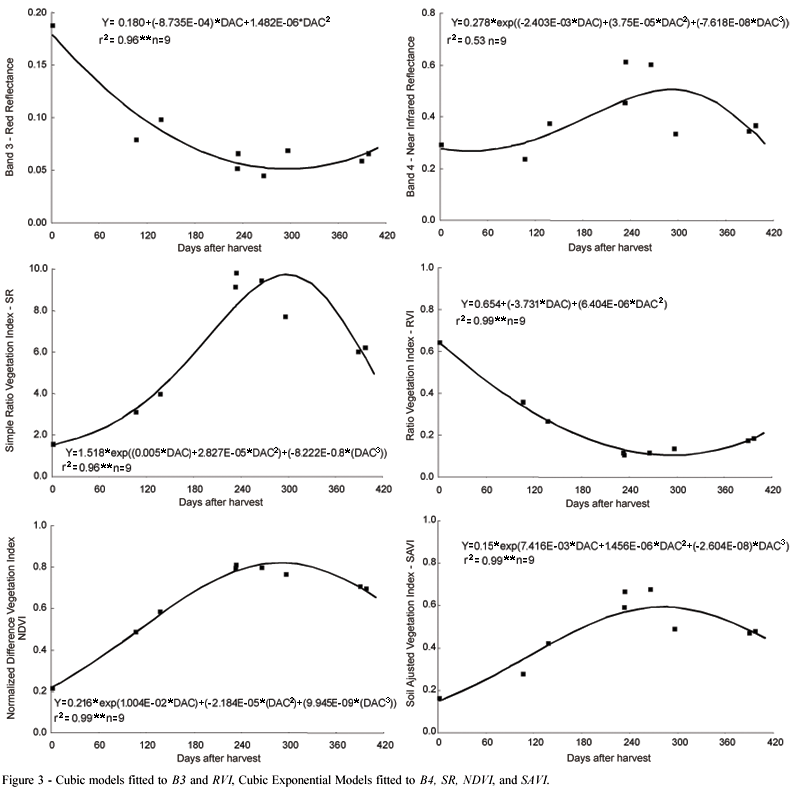
The temporal behavior of the spectral data presented in Figure 2 illustrates that all spectral parameters tend to stabilize at the end of the cycle, following the stabilization of the LAI, NPM, and BMT values (Table 2). B3 and RVI showed a very similar behavior, with a decrease in their values since the first stages of the cycle, as a consequence of the rapid saturation of B3 due to LAI and BMT. The small increase in RVI values at the end of the cycle is due to the increase in the amount of straw in the crop's total biomass and to the reduction in green leaf mass. All other spectral parameters had a behavior of intense increase in reflectance or vegetation index at the crop establishment and development stages. In the maturation stage, however, values became stabilized and presented a small reduction (Figure 2).
A similar temporal behavior of variables B4, SR, NDVI, and SAVI in relation to variable LAI can be observed in Table 2; these results are similar to those found by Epiphanio et al.; 1996; Baret & Guyot, 1991; and Simões et al., 2003. This correlated behavior of spectral variables and LAI is due to the same type of temporal behavior, characterized by stages of intense growth, stabilization, and decline in their values. In both cropping seasons, a stage of intense growth occurred until 240 DAC, at which date the maximum reflectance and LAI values were observed. From that date, values began to decrease as a consequence of the beginning of the crop senescence stage. The reduction in spectral values and LAI at the end of the cycle is explained by the process of sugarcane maturation, beginning to translocate photosynthates to the stalks, which decreases green leaf mass and increases the amount of straw (Pellegrino, 2000).
With regard to the DAC variable, the spectral variables had their temporal behaviors explained by second- or third-order models, or by exponential models, with coefficients of determination (r2) higher than 0.90 (Figure 3). These models were selected due to the possibility of representing the stage of stabilization and decrease in reflectance and vegetation indices values at the end of the crop cycle.
The fact that the temporal behavior of the spectral data follows the temporal development of agronomic variables confirms the potential shown by terrestrial remote sensing data for monitoring the conditions of agricultural crops (Wiegand et al., 1991). Although the spectral data followed the behavior of the agronomic parameters, the NDVI and B4 curve did not present the sigmoidal shape mentioned by Magalhães (1979) and Pellegrino (2000) as the standard for the behavior, probably due to the small number of data used to fit the models and to the saturation effect that occurs with NDVI at high LAI and BMT values (Figure 3).
Table 3 presents the Correlation Coefficients with significance at 5% for the mean data of the cropping seasons. B4 was more correlated with variable LAI than B3. This did not occur with NPM, TSS, and BMT, which were more correlated with B3 than with B4. This result contradicts those obtained by Epiphanio & Huete (1995) with alfalfa, and Epiphanio et al. (1996) with wheat, in which biophysical variables were more correlated with B4, due to a premature saturation of B3 as biomass increased. Wiegand et al. (1991) and Baret & Guyot (1991) also described better correlations of B4 with biophysical parameters, since this band has greater penetration power into the leaf canopy, and therefore contains more information on the bottom layers, while B3 is absorbed with priority by chlorophyll in the upper layers of the canopy.
This atypical behavior of sugarcane, showing a smaller correlation of B4 with agronomic variables than B3 can be explained, as already observed in the low correlation of B4 with DAC, by the great variability of the crop leaf canopy during the cycle. Sugarcane lodging exposes stalks and straw at the bottom layers of the canopy, compromising the correlation of B4 with LAI and BMT. Notwithstanding, this hypothesis needs to be studied in more detail in order to determine its actual effects on crop spectral behavior.
Because of the high correlation of B3 with NDVI and RVI, these indices had the highest correlations with the BMT variable. They showed better correlations than SAVI, although the contrary was expected. SAVI is indicated for studies involving crops with high biomass, such as sugarcane, because of its greater correlation with B4, which interacts more deeply with thick canopies and has the ability to reach the lower portions of the biomass of crops (Epiphanio & Huete, 1995). This result also demonstrates that, from the correlations obtained, NDVI is an interesting variable to be included in spectral models designed to predict biomass and productivity in sugarcane.
From the presented Correlation Coefficients, it is possible to observe that LAI had better correlations with the spectral data than NPM, and correlation values near those for the BMT variable; this fact is justified by the greater interaction of radiation with the leaf canopy than with sugarcane stalks represented by NPM. The correlations of VIs with agronomic variables were higher than the correlations with the bands separately (Table 3), except for NPM, which had a correlation of -0.43 with RVI, higher than the B3 correlation, which was -0.40, and the B4 correlation, of -0.09. Baret & Guyot (1991) demonstrated that this is precisely one of the arguments for the use of VIs instead of the use of individual spectral bands.
Despite the difficulties in obtaining radiometric measurements in large-sized crops, with high plant biomass, high spatial variability, and subject to great variations from one cycle to the next, field radiometry data can be employed in temporal monitoring studies for agricultural crops. Raising the sensor over the canopy to collect data is an operation that introduces spectral measurement errors, either due to view angle variations, or to FOV variations as a function of sensor height variation in relation to the top of the canopy, with implications for the representativeness of the measurement in relation to the whole canopy of the crop. All these problems may justify the different results obtained in this work in relation to the literature, which are actually found in reports with remote sensing data in commercial areas; therefore, this is a highly valuable information.

The Stepwise result showed multiple linear regression models with the more correlated variables presented in Table 3. The number of observations used in the regression was eight; however, two samples had to be disregarded because they did not include TSS or BMT data.
The TSS and BMT behavior was best explained by the mean data for LAI, NPM, B3, NDVI, and RVI, precisely the data that showed the highest correlation with the dependent variables presented in Table 3. Results were not good when variables LAI and NPM were used separately to describe the behavior of variables TSS and BMT, with r2 values of 0.28 and 0.36, respectively. However, when the spectral data were added to the regressions, their significance increased to coefficient of determination values of 0.96 and 0.98 (5% significance level) for TSS and BMT, respectively. Ruddorf & Batista (1990) obtained better explanations for sugarcane productivity using agrometeorological data and spectral data jointly, raising the explanations from 28% (agrometeorological data only) to 69% (agrometeorological plus spectral data), demonstrating that the latter aggregates information for biomass accumulation and productivity models.
The regression models found by Pellegrino (2000) for the relationship between sugarcane vegetation indices and days after cutting, also presented r2 values above 0.80, with SR as the best vegetation index. This author, however, did not find good models to relate LAI and vegetation indices with crop productivity and biomass.
The inclusion of more than one spectral variable, although not correlated with other spectral variables and with supplementary information, as it was the case with B4 in the model to estimate TSS, did not aggregate additional information to the model involving LAI, NPM, and NDVI, decreasing r2 and removing the significance of the model. Similarly, the inclusion of NDVI in the explanation of BMT in the model that already contained B3 did not add information either; therefore, the best model was still the one containing B3 alone. On the other hand, regressions that used SAVI and SR as spectral parameters were not significant, showing that RVI and NDVI were the best vegetation indices to explain crop productivity and biomass. SAVI is the most indicated vegetation index for studies involving crops with high biomass, because of its greater correlation with B4, which has greater penetration capacity and therefore interacts with deeper and thicker canopies (Epiphanio & Huete, 1995) (Table 3). In the particular case of the sugarcane here studied, the greater correlation of the crop with B3 may have compromised SAVI efficiency, thus raising RVI, which has a high correlation with B3, to the rank of best index.
CONCLUSIONS
Radiometric measurements in the field can be a good monitoring tool for sugarcane, because their behavior is correlated with agronomic parameters of the crop, such as leaf area index, number of tillers per meter, productivity, and biomass.
B3, NDVI, and RVI were the spectral variables with the highest correlations with agronomic variables. As a consequence, the multiple regression models containing these spectral variables had the highest coefficients of determination: 0.88 for B3; 0.96 for NDVI; and 0.98 for RVI.
Crop traits such as lodging and high leaf canopy variability, and difficulties to acquire radiometric data for the crop in commercial areas may have caused the greater correlation of B3 with agronomic variables and with productivity and biomass. Additional studies involving a greater volume of radiometric data and correlating orbital data may eliminate these problems and provide greater contributions to an understanding of the spectral behavior of sugarcane.
ACKNOWLEDGEMENTS
To FAPESP for financial support, to Usina São João (sugarmill) represented by João Martins and João Batista Saccomanno, for making the study area available and for data collection support, to Centro de Tecnologia Copersucar for data collection support, and to Centro de Pesquisas Meteorológicas e Climáticas Aplicadas a Agricultura-CEPAGRI, represented by Jurandir Zullo Junior, Ph.D., for providing the Cimel radiometers and the LICOR spectroradiometer.
Received January 19, 2004
Accepted April 01, 2005
- BARET. F.; GUYOT, G. Potential and limits of vegetation indices for LAI and APAR assessment. Remote Sensing of Environment, v.35, p.161-173, 1991.
- CIMEL ELECTRONIQUE. User manual - Radiancemeter CE 313a. Paris: Cimel, 1998. 15p.
- COPERSUCAR. Quarta geração de variedades de cana-de-açúcar Copersucar Piracicaba: Centro de Tecnologia Copersucar, 1993. 18p. (Boletim Técnico Copersucar Edição Especial).
- DUGGIN, M.J.; CUNIA, T. Ground reflectance measurement techniques: a comparison. Applied Optics, v.22, p.3771-3777, 1983.
- EPIPHANIO, J.C.N.; HUETE, A.R. Dependence of NDVI and SAVI on sun/sensor geometry and its effect on fAPAR relationship in Alfafa. Remote Sensing of Environment, v.51, p.351-360, 1995.
- EPIPHANIO, J.C.N.; ALMEIDA Jr., A.C.; FORMAGGIO, A.R. Desenvolvimento do trigo avaliado com dois índices de vegetação. In: SIMPÓSIO BRASILEIRO DE SENSORIAMENTO REMOTO, 8., Salvador, 1996. Anais São José dos Campos: INPE, 1996. p.158-164. CD ROM.
- GHELLER, A.C.A.; MENEZES, L.L.; MATSUOKA, S.; MASUDA, Y.; HOFFMANN, H.P.; ARIZONO, H., GARCIA, A.A.F. Manual de método alternativo para medição da produção de cana-de-açúcar Araras: UFSCAR; CCA; DBV, 1999. 7p. Disponível em: <http://www.dbv.cca.ufscar.br/pmgca>. Acesso em: 16 abril 2000.
- HOFFER, R.M. Biological and physical considerations in applying computer-aided analysis techniques to remote sensor data. In: SWAIN, P.H.; DAVIS, S.M. Remote sensing: The quantitative approach. New York: McGraw-Hill, 1978. cap.5, p.227-289.
- HUETE, A.R. A soil adjusted vegetation index (SAVI). Remote Sensing of Environment, v.25, p.295-309, 1988.
- HUETE, A.R.; JACKSON, R.D.; POST, D.F. Spectral response of a plant canopy with different soil background. Remote Sensing of Environment, v.17, p.37-53, 1985.
- JACKSON, R.D.; HUETE, A.R. Interpreting vegetation indices. Journal of Preventive Veterinary Medicine, v.11, p.185-200, 1991.
- JOAQUIM, A.C. Identificação de variedades de cana-de-açúcar em três classes texturais de solos, na região de Araraquara - SP, através de análise de nível de cinza em imagens Landsat/TM. Campinas; UNICAMP/FEAGRI, 1998. 96p. (Dissertação - Mestrado).
- MAGALHÃES, A.C.N. Análise quantitativa do crescimento. In: FERRI, M.G. (Ed.) Fisiologia vegetal São Paulo: EDUSP, 1979. cap.7, p.333-350.
- MILTON, E.J. Principles of field spectroscopy. Review Article. International Journal of Remote Sensing, v.8, p.1807-1827, 1987.
- PELLEGRINO, G.Q. Utilização de dados espectrais do satélite NOAA14/AVHRR como fonte de dados para modelos matemáticos de estimativa da fitomassa da cana-de-açúcar. Campinas: UNICAMP/FEAGRI, 2000. 114p. (Tese - Doutorado).
- QI, J.; CHEHBOUNI; A.; HUETE A.R.; KERR, Y.H.; SOROOSHIAN, S. A modified soil adjusted vegetation index. Remote Sensing of Environment, v.48, p.119-126, 1994.
- RUDORFF, B.F.T. Dados Landsat na estimativa da produtividade agrícola da cana-de-açúcar. São José dos Campos: INPE, 1985. 114p. (Dissertação - Mestrado).
- RUDORFF, B.F.T.; BATISTA, G.T. Yield estimation of sugarcane based on agrometeorologicalspectral models. Remote Sensing of Environment, v.33, p.183-192, 1990.
- SIMÕES, M.S.; ROCHA, J.V.; LAMPARELLI, R.A.C. Análise do comportamento espectral de uma área comercial de cana-de-açúcar em duas safras por meio de radiometria de campo. In: SIMPÓSIO BRASILEIRO DE SENSORIAMENTO REMOTO, 11., Belo Horizonte, 2003. Anais São José dos Campos: INPE, 2003. p.2367-2374. CD ROM.
- TUCKER, C.J. Red and photographic infrared linear combinations for monitoring vegetation. Remote Sensing of Environment, v.8, p.127-150, 1979.
- WIEGAND, C.L.; RICHARDSON, A.J.; ESCOBAR, D.E.; GERBERMANN, A.H. Vegetation indices in crop assessments. Remote Sensing of Environment, v.35, p.105-119, 1991.
- XAVIER, A.C. Estimativa da dinâmica do índice de área foliar em uma microbacia hidrográfica por meio de técnicas de sensoriamento remoto. Piracicaba: USP/ESALQ, 2003. 124p. (Tese - Doutorado).
- ZULLO Jr., J.; ARRUDA, F.B. Programa computacional para ajuste de equações em dados experimentais Campinas: Instituto Agronômico, 1986. 23p. (Boletim Técnico, 113).
Publication Dates
-
Publication in this collection
03 June 2005 -
Date of issue
June 2005
History
-
Received
19 Jan 2004 -
Accepted
01 Apr 2005