Abstracts
The current system used in Brazil for sugarcane (Saccharum officinarum L.) crop forecasting relies mainly on subjective information provided by sugar mill technicians and on information about demands of raw agricultural products from industry. This study evaluated the feasibility to estimate the yield at municipality level in São Paulo State, Brazil, using 10-day periods of SPOT Vegetation NDVI images and ECMWF meteorological data. Twenty municipalities and seven cropping seasons were selected between 1999 and 2006. The plant development cycle was divided into four phases, according to the sugarcane physiology, obtaining spectral and meteorological attributes for each phase. The most important attributes were selected and the average yield was classified according to a decision tree. Values obtained from the NDVI time profile from December to January next year enabled to classify yields into three classes: below average, average and above average. The results were more effective for 'average' and 'above average' classes, with 86.5 and 66.7% accuracy respectively. Monitoring sugarcane planted areas using SPOT Vegetation images allowed previous analysis and predictions on the average municipal yield trend.
NDVI; remote sensing; data mining; crop forecasting
O atual sistema de previsão de safras para a cultura da cana-de-açúcar (Saccharum officinarum L.) usado no Brasil depende, em boa parte, de informações subjetivas, baseadas no conhecimento de técnicos do setor sucroalcooleiro e em informações sobre demanda de insumos na cadeia produtiva. Avaliou-se o uso de imagens decendiais de NDVI do sensor SPOT Vegetation e variáveis meteorológicas do modelo do ECMWF para inferir sobre os dados de produtividade oficiais registrados em municípios e safras previamente selecionados. Foram selecionados 20 municípios e sete safras compreendidas entre o período de 1999 e 2006. O ciclo de desenvolvimento da cultura foi dividido em quatro fases, de acordo com a fisiologia, gerando para cada fase atributos espectrais e meteorológicos. Foram selecionados os atributos mais relevantes para a classificação da produtividade média municipal e, por meio de árvore de decisão, a produtividade média municipal foi classificada. Valores extraídos do perfil temporal do NDVI entre os meses de dezembro e janeiro permitiram classificar a produtividade em três classes: abaixo da média, média e acima da média. Os resultados foram mais efetivos para as classes "média" e "acima da média", com acertos de 86,5 e 66,7%, respectivamente. O monitoramento de áreas canavieiras do estado de São Paulo por meio de imagens SPOT Vegetation permitiu inferir sobre a tendência da produtividade média municipal previamente.
NDVI; sensoriamento remoto; mineração de dados; previsão de safras
CROP SCIENCE
Sugarcane yield estimates using time series analysis of spot vegetation images
Estimativa de produtividade da cana-de-açúcar por meio de séries temporais de imagens spot vegetation
Jeferson Lobato FernandesI; Jansle Vieira RochaII,* * Corresponding author < jansle.rocha@feagri.unicamp.br> ; Rubens Augusto Camargo LamparelliIII
IUNICAMP/FEAGRI Programa de Pós-Graduação em Planejamento e Desenvolvimento Rural Sustentável
IIUNICAMP/FEAGRI Av. Candido Rondon, 501, Barão Geraldo - 13083-875 Campinas, SP Brasil
IIIUNICAMP/CEPAGRI Cidade Universitária Zeferino Vaz, s/n 13083-970 Campinas, SP Brasil
ABSTRACT
The current system used in Brazil for sugarcane (Saccharum officinarum L.) crop forecasting relies mainly on subjective information provided by sugar mill technicians and on information about demands of raw agricultural products from industry. This study evaluated the feasibility to estimate the yield at municipality level in São Paulo State, Brazil, using 10-day periods of SPOT Vegetation NDVI images and ECMWF meteorological data. Twenty municipalities and seven cropping seasons were selected between 1999 and 2006. The plant development cycle was divided into four phases, according to the sugarcane physiology, obtaining spectral and meteorological attributes for each phase. The most important attributes were selected and the average yield was classified according to a decision tree. Values obtained from the NDVI time profile from December to January next year enabled to classify yields into three classes: below average, average and above average. The results were more effective for 'average' and 'above average' classes, with 86.5 and 66.7% accuracy respectively. Monitoring sugarcane planted areas using SPOT Vegetation images allowed previous analysis and predictions on the average municipal yield trend.
Key words: NDVI, remote sensing, data mining, crop forecasting.
RESUMO
O atual sistema de previsão de safras para a cultura da cana-de-açúcar (Saccharum officinarum L.) usado no Brasil depende, em boa parte, de informações subjetivas, baseadas no conhecimento de técnicos do setor sucroalcooleiro e em informações sobre demanda de insumos na cadeia produtiva. Avaliou-se o uso de imagens decendiais de NDVI do sensor SPOT Vegetation e variáveis meteorológicas do modelo do ECMWF para inferir sobre os dados de produtividade oficiais registrados em municípios e safras previamente selecionados. Foram selecionados 20 municípios e sete safras compreendidas entre o período de 1999 e 2006. O ciclo de desenvolvimento da cultura foi dividido em quatro fases, de acordo com a fisiologia, gerando para cada fase atributos espectrais e meteorológicos. Foram selecionados os atributos mais relevantes para a classificação da produtividade média municipal e, por meio de árvore de decisão, a produtividade média municipal foi classificada. Valores extraídos do perfil temporal do NDVI entre os meses de dezembro e janeiro permitiram classificar a produtividade em três classes: abaixo da média, média e acima da média. Os resultados foram mais efetivos para as classes "média" e "acima da média", com acertos de 86,5 e 66,7%, respectivamente. O monitoramento de áreas canavieiras do estado de São Paulo por meio de imagens SPOT Vegetation permitiu inferir sobre a tendência da produtividade média municipal previamente.
Palavras-chave: NDVI, sensoriamento remoto, mineração de dados, previsão de safras.
Introduction
The estimation of sugarcane (Saccharum officinarum L.) yield can be conducted at local (e.g. sugar mills) and regional (e.g. government) scales. The yield estimation methods for sugarcane adopted by the Brazilian government are considered subjective because they are based on information gathered from direct inquiries to the production sector, such as field research using questionnaires, surveys on information about demands on agriculture raw materials, use of yield historical data and field observations on plant behavior (IBGE, 2002; CONAB, 2007). The possibility of determining sugarcane development by spectral data such as the Normal ized Difference Vegetation Index - NDVI (Simões et al., 2005a) and the correlation between vegetation indices and sugarcane yield (Simões et al., 2005b; Simões et al., 2009) demonstrate the potential of using spectral data for yield estimates at local scale. It is necessary to study this potential in a regional scale, in order to gather timely information about the plant development and about the expected yield before the harvesting. Vegetation indices such as NDVI, originated from low spatial resolution sensors, have been showing to be adequate for the plantation monitoring aiming at yield estimation (Boken and Shayewich, 2002; Labus et al., 2002; Ferencz et al., 2004). Monitoring sugarcane plantations using NDVI time series derived from the Systeme Pour L'Observation de Fernandes et al. la Terre (SPOT) Vegetation, which enables the simulation of plant development and its correlation with the average municipal yield.
Greenland (2005) found relation between climate variables - obtained by stations in the sugarcane growing area - and annual sugarcane yield in Louisiana and it was possible to simulate the annual yield based on climate variables. Estimated meteorological data, provided by European Center for Medium-range Weather Forecast (ECMWF) model, allows one to obtain meteorological variables for extensive areas, in order to relate to the annual yield of sugarcane.
The main goal of this study was to obtain spectral profile and meteorological data based on publicly available data, for different plant development stages, and classify average municipal yield, in order to detect tendencies previously to harvesting.
Material and Methods
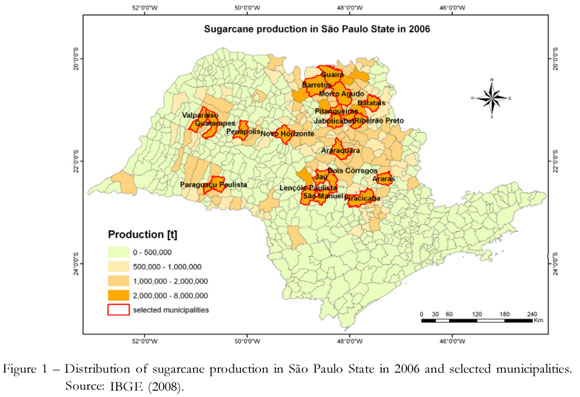
The study was carried out in 20 municipalities in São Paulo State, Brazil, during seven consecutive cropping seasons. All municipalities of São Paulo State were ranked in descending order by sugar cane average yield in 2006 and 20 municipalities of the top were selected. Average municipal yield data for sugarcane were obtained from IBGE (2008). The SPOT Vegetation images were made available from 1999, thus, for this reason, the period analyzed was defined between August 1999 and October 2006. Figure 1 shows the spatial distribution of sugarcane production in São Paulo State in 2006 and the selected municipalities.
The SPOT Vegetation offers free low spatial resolution NDVI images (1 km x 1 km pixel) with high temporal resolution (daily) (Vegetation, 2007). About 255 images of SPOT Vegetation product S10 (NDVI 10-day composite) atmospherically and geometrically corrected were used in this study.
Meteorological data, estimated by the European Center for Medium-range Weather Forecast (ECMWF) global model, interpolated at 0.5 degrees resolution, in the form of 10-daily composite images (geotiff format), are freely available at the Joint Research Centre (JRC, 2007) of the European Commission. The following meteorological variables were selected: Rainfall (in mm, accumulated value for every 10-day period); Global radiation (in Wh/m2, accumulated value for every 10-day period); Minimum temperature (in ºC, mean for every 10-day period); Medium temperature (in ºC, mean for every 10-day period); Maximum temperature (in ºC, mean for every 10-day period). Both 10-daily NDVI and meteorological data were gathered for the period between August 1999 and October 2006.
The Hants (Harmonic Analysis of NDVI Time-Series) algorithm was applied to NDVI annual time series in order to eliminate abrupt variations in the 10-day NDVI values usually caused by the presence of clouds. This algorithm, proposed by Roerink et al. (2000), considers the NDVI temporal behavior throughout a cropping season as harmonic and with low frequency. Therefore, the series was adjusted by eliminating high frequency oscillation regarded as 'noise'. The adjustment was based on the minimum quadratic error. Figure 2 shows, as an example, the adjustment of values originated from a pixel in sugarcane cultivation area.
A Geographical Information System (GIS) was used to select pixels located in sugarcane planted areas from the SPOT Vegetation images. Thematic maps from CANASAT (2007) were used as reference to locate areas planted with sugarcane in each municipality. Then, the NDVI time series profiles were obtained for each selected pixel in all municipalities and cropping seasons. So, an average municipal NDVI time series profile was Sugarcane yield estimates calculated. Average municipal NDVI profiles were used in order to adequate the spatial scale of the spectral data with the yield data available. Average municipal ECMWF meteorological data were also used to generate time profiles for each municipality and cropping season. An automatic process for image data extraction was used through an ENVI/IDL computational system based on the study carried out by Esquerdo et al. (2006).
Information about sugarcane physiology was used in order to separate the database in different development phases within the cropping season: establishment, vegetative development and stabilization/senesce, as used by Simões et al. (2005a). The vegetative development was divided in two parts: fast growth and slow growth. Thus, the development cycle was divided in 4 phases: establishment, fast growth, slow growth and stabilization/senesce.
The NDVI is directly related to the crop characteristics of the sugarcane (Simões et al., 2005a). For each cropping season the average NDVI profile of 20 municipalities was calculated to compare different dynamics in plant development among seven cropping seasons. So, the boundaries between phenological stages were defined in crop calendar, based on a general behavior of NDVI data during seven years. The average NDVI profiles and standard deviation among the 20 municipalities, obtained for each cropping season, are shown in Figure 3. Then, NDVI and meteorological data were aggregated by phase, allowing for the generation of spectral and meteorological attributes for each development phase as well as for the whole cropping season, resulting in 51 attributes for each municipality/cropping season, as shown in Table 1.
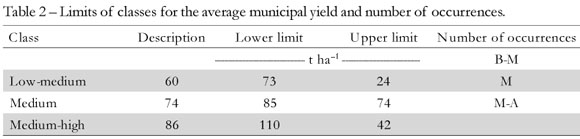
To use data mining techniques, such as attribute selection and classification by decision tree, the average municipal yield (attribute class) data were discretized in three classes through percentiles. Table 2 shows the three classes of average municipal yield after discretization, as well as their respective lower and upper limits and number of occurrences.
The Weka 5.5 software was used to carry out the attribute selection and classification procedure. Four methods were used for feature selection: (i) Chi-square test; (ii) Wrapper's method with J48 decision tree algorithm; (iii) CFS (Correlation Feature Selection) method; (iv) Combination of InfoGAin (Information Gain) and GainRatio (Ratio Gain) methods. The aim was to determine which attributes would be selected by the majority of methods in order to obtain the most relevant attributes to classify 'average municipal yield' attribute class. After the attribute selection step, the classification of the average municipal yield using J48 decision tree algorithm was applied in order to determine the relations and hierarchy of selected attributes. Based on the results for the first classification a second classification was performed using only the first two attributes at the top of the decision tree, which showed more relevance in the first classification, in order to evaluate sugar cane yield with a reduced number of strong diagnostic features.
To verify the tendency shown in the second classification correlation analysis were carried out between spectral attributes and average municipal yield using two approaches. The first approach evaluated the average result for each cropping season, considering the 20 municipalities' average. The average spectral attribute and the average crop yield among the 20 municipalities were calculated for each cropping season. The second approach evaluated the average result for each municipality, considering the average of the seven cropping seasons. The average historical value of the spectral attribute and yield was calculated for each municipality.
Results and Discussion
Table 3 shows the selected attributes for each method. The meteorological attributes were not selected. That could be explained by the fact that the development phases were fixed in the calendar, the duration of each development phase and the use of cumulative meteorological data. Other reason for absence of selection is related with the method used to discretize the yield. Three classes in percentiles method may not have been adequate to relate with the numeric meteorological attributes.
Using the ndvi2_m, ndvi2_final, ndvi3_s, ndvi3_inic and ndvi_m attributes, J48 classification algorithm was applied based on decision tree. A threshold was applied defining a minimum number of ten objects. As a training set, a cross validation method with 5 folds was used. From a total of 140 instances, the classifier rated 98 correctly, corresponding to 70% accuracy. Table 4 presents the confusion matrix and accuracy of the performed classification. The diagonal values represent the correctly classified instances.
Balance and coherence of results were observed (Table 4), since there was more confusion between neighboring classes (B-M and M or M and M-A) than between remote classes (B-M and M-A). This confusion may be associated with the discretization method used for the attribute class (average crop yield). The ndvi2_final and ndvi2_m attributes are located on top of the tree, which means an important role in yield classification (Figure 4). They belong to the fast growth phase, gathered between the first 10-day period of December the third 10-day period of January. The behavior of these two attributes was coherent, once the higher values of NDVI in the vegetative development phase mean good crop development in the field, favoring higher yield results. Then, a new classification for the same 140 instances using only the ndvi2_final and ndvi2_m attributes was carried out. The classification algorithm continued to be the J48, using a threshold with a minimum number of ten objects, and cross validation method with 5 folds was applied for the training set. The classifier rated 67% of cases correctly, which corresponded to 94 out of 140 instances.
There was a significant worsening regarding the classification of yield B-M, whose hit percentage dropped from 62.5 to 8.3 (Tables 4 and 5). Classification of M class yield improved, increasing from 74.3 to 86.5 its accuracy percentage. For classification of M-A class, the result did not change.
Figure 5 shows the decision tree for determination of average municipal yield, which was obtained using only the ndvi2_m and ndvi2_final attributes. The analysis of both classifications, to determine yield classes M and M-A, showed that it was possible to obtain reasonable results using only the ndvi2_final and ndvi2_m attributes; that, though, did not occur with class B-M. Only the ndvi2_final attribute was determinant for the classification of M-A class (Figures 4 and 5). These features were originated from phase 2, which refers to the period between the beginning of December and the end of January and, therefore, with an anticipation of at least two months in relation to the beginning of the harvesting period. Other factors, besides those considered in this study, influence the official yield figures presented. Special attention should be drawn to the B-M class regarding low yield indices since, even under favorable field conditions for plant development, low yield may occur if economic factors, for instance, are not favorable. However, for high yield indices to occur, these field conditions must be favorable.
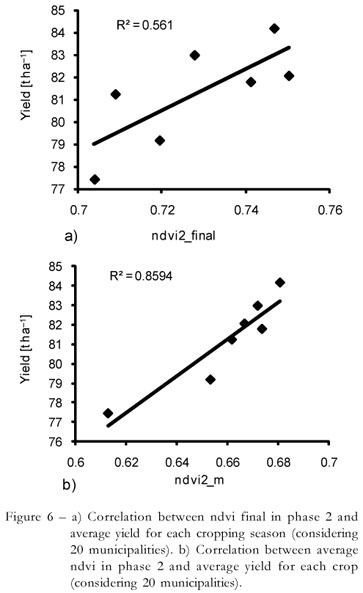
Correlation analyses between the two spectral attributes of phase 2 and the average municipal yield were done to evaluate the tendency shown in Figure 5, in which higher values are related to higher yield and vice versa. In the first approach, the option was to evaluate the cropping season average to homogenize differences between standard municipal yields. Figure 6 shows the correlation results between NDVI final/average, NDVI in phase 2 and average yield for each cropping season, considering averages among 20 municipalities. Each dot in the graphs refers to one cropping season. The results from Figure 6 were consistent with the classification presented in Figure 5, i.e., cropping seasons with higher spectral attributes values tended to show higher yields and vice versa.
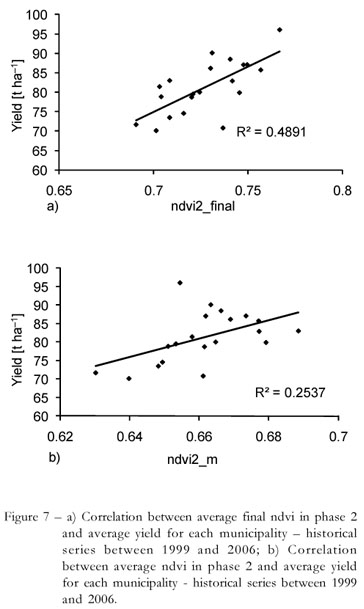
In the second approach, the goal was to verify whether the municipal yield historical pattern (historical series between 1999 and 2006) could be perceived in the spectral variables. The results presented in Figure 7 also show consistency with the classification result presented in Figure 5, despite the low coefficient of determination. Low coefficient of determination was expected, since the results of the average municipal yield do not depend only on field conditions.
Despite the results presented high level of accuracy, they are good indicators for crop monitoring purposes, once they provide a good basis for qualitative assessment of crop yield, as used by institutions such as the Joint Research Center of the European Commission (JRC, 2010), which produces monthly crop monitoring bulletins for several regions in the world based on NDVI, signaling areas with below average/average/above average conditions for crop development.
Acknowledgements
To the National Council for Scientific and Technological Development (CNPq) for the support received.
Received October 02, 2009
Accepted October 01, 2010
- Boken, V.K. and Shayewich, C.F. 2002. Improving an operational wheat yield model using phenological phase-based Normalized Difference Vegetation Index. International Journal of Remote Sensing 23: 4155-4168.
- Canasat. 2007. Mapping sugarcane by earth observation satellites. Available at: http://www.dsr.inpe.br/mapdsr/intro.htm [Accessed Nov. 13, 2007] (in Portuguese).
- Companhia Nacional de Abastecimento [CONAB]. 2007. Monitoring of the Brazilian Sugar Cane 2007/2008 cropping season, first survey, May/2007. Available at: http://www.conab.gov.br/conabweb/download/safra/1_levantamento0708_mai2007.pdf [Accessed Dec. 10, 2007] (in Portuguese).
- Esquerdo, J.C.D.M.; Antunes, J.F.G.; Baldwin, D.G.; Emery, W.J.; Zullo Júnior, J. 2006. An automatic system for AVHRR land surface product generation. International Journal of Remote Sensing 27: 3925-3942.
- Ferencz, C.; Bognár, P.; Lichtenberger, J.; Hamar, D.; Tarcsai, G.; Timár, G.; Molnár, G.; Pásztor, S.; Steinbach, P.; Székely, B.; Ferencz, O.E.; Ferencz-Árkos, I. 2004. Crop yield estimation by remote sensing. International Journal of Remote Sensing 25: 4113-4149.
- Greenland, D. 2005. Climate variability and sugarcane yield in Louisiana. Journal of Applied Meteorology 44: 1655-1666.
- Instituto Brasileiro de Geografia e Estatística [IBGE]. 2002. Agricultural and Stock Raising Surveys, Methodological Reports Series. Available at: http://www.ibge.gov.br/home/estatistica/indicadores/agropecuaria /PesquisasAgropecuarias2002.pdf [Accessed Mar. 07, 2008] (in Portuguese).
- Instituto Brasileiro de Geografia e Estatística [IBGE]. 2008. Aggregates Database. SIDRA - IBGE System for Automatic Recovery. Available at: http://www.sidra.ibge.gov.br [Accessed Jun. 29, 2008] (in Portuguese).
- Fernandes et al. Joint Research Centre [JRC]. 2006. Meteorological Data Simulated by ECMWF Model. Available at: http://mars.jrc.ec.europa.eu/mars/About-us/FOODSEC/Data-Distribution [Accessed Apr. 25, 2007]
- Joint Research Centre [JRC]. 2006. Bulletins and Publications. Available at: http://mars.jrc.ec.europa.eu/mars/Bulletins-Publications [Accessed Apr. 12, 2010]
- Labus, M.P.; Nielsen, G.A.; Lawrence, R.L.; Engel, R. 2002. Wheat yield estimates using multi-temporal NDVI satellite imagery. International Journal of Remote Sensing 23: 4169-4180.
- Roerink, G.J.; Menenti, M.; Verhoef, W. 2000. Reconstructing cloudfree NDVI composites using Fourier analysis of time series. International Journal of Remote Sensing 21: 1911-1917.
- Simões, M.S.; Rocha, J.V.; Lamparelli, R.A.C. 2005a. Spectral variables growth analysis and yield of sugarcane. Scientia Agricola 62: 199-207.
- Simões, M.S.; Rocha, J.V.; Lamparelli, R.A.C. 2005b. Growth indices and productivity in sugarcane. Scientia Agricola 62: 23-30.
- Simões, M.S.; Rocha, J.V.; Lamparelli, R.A.C. 2009. Orbital spectral variables, growth analysis and sugarcane yield. Scientia Agricola 66: 451-461.
- VEGETATION. 2003. Vegetation Programme. Available at: http://spot-vegetation.com/vegetationprogramme/index.htm [Accessed Mar. 22, 2007]
Publication Dates
-
Publication in this collection
30 May 2011 -
Date of issue
Apr 2011
History
-
Accepted
01 Oct 2010 -
Received
02 Oct 2009