Abstracts
The understanding of the preferential water flow and solute transport is important with regard to losses of nutrients and pesticides that affect the quality of the groundwater or surface water resources. Experiments using the brilliant blue dye tracer, a tension infiltrometer (TI) and a double square infiltrometer (DI) were carried out in the experimental field site located around 15 km southeast of the city of Rostock (North-Eastern Germany) on arable land in a Pleistocene lowland landscape where corn (Zea mays L.) and barley (Hordeum spp.) had been cultivated. One day after dye the infiltration, a pit was dug and vertical profiles were prepared in the TI and DI sites to assess the dye pathways in the subsoil of a Gleyic Luvisol. We wanted to examine if the mottled red and white (bleached) colour-pattern of the Gleyic Luvisol subsoil resulting from temporally stagnant water could be related to flow paths as visualized by dye tracing and if the soil colour could be related to other physical soil properties. Biogenic soil structures were the main transport routes conducting water and solutes into great depth in short time. These pathways had lower bulk density and less cone resistance than the adjacent red or white (bleached) areas of the Gleyic Luvisol subsoil. The red areas were involved in transport because their water contents increased after as compared to before infiltration. However, the measured physical soil properties did not differ between white and red areas. We assume that red areas participate in transport at least by imbibing water from the adjacent biogenic flow paths.
soil water content; bulk density; cone resistance
O fluxo preferencial de água e o transporte de solutos relacionam-se com perdas de nutrientes e pesticidas e afetam a qualidade de águas subterrâneas. Foram realizados experimentos utilizando o traçador Brilhante Blue, um infiltrômetro de tensão (TI) e um infiltrômetro com "duplos quadrados" (DI) num campo experimental localizado a cerca de 15 km a sudeste da cidade de Rostock (nordeste da Alemanha) num solo onde cultiva-se milho (Zea mays L.) e cevada (Hordeum spp.). Um dia após a infiltração do traçador, perfis de solo foram escavados no local do TI e do DI para observar o fluxo da água deixado pelo do traçador no solo. O objetivo era verificar se os mosqueados vermelhos e partes esbranquiçadas cor-padrão do subsolo do Gleyic Luvisol, resultante da água estagnada temporariamente, poderia estar relacionada ao fluxo da água visualizados pelo traçador e se a cor do solo poderia estar relacionada a outras propriedades físicas do solo. A estrutura biogênica do solo foi a principal rota de transporte conduzindo água e solutos em profundidade e em menor tempo. Esses caminhos tiveram menor densidade do solo e menor resistência do que as áreas vermelhas e esbranquiçadas adjacentes do subsolo do Gleyic Luvisol. Áreas vermelhas foram relacionadas com o transporte devido apresentarem maior conteúdo de água após o teste de infiltração. Entretanto, não houve diferenças entre as propriedades físicas do solo das áreas brancas e vermelhas. Assumiu-se que as áreas vermelhas participaram do transporte de água porque absorveram água do fluxo adjacente, ou seja, dos bioporos.
umidade do solo; densidade do solo; resistência
SOILS AND PLANT NUTRITION
Dye tracer and morphophysical properties to observe water flow in a Gleyic Luvisol
Fluxo de água em um Gleyic Luvisol usando traçador e sua relação com as propriedades físicas e morfológicas do solo
Monica Martins Silva SalvadorI; Sigrid KöhneII; John Maximilian KöhneIII; Bernd LennartzIV; Paulo Leonel LibardiV,* * Corresponding author < pllibard@esalq.usp.br>
IUSP/ESALQ Programa de Pós-Graduação em Física do Ambiente Agrícola
IIMartin-Luther Universität Halle-Wittenberg, ZUV A6.1, Universitätsplatz 10 - 06099 -Halle (Saale), Germany
IIIHelmholtz Centre for Environmental Research Dept. of Soil Physics UFZ, Theodor-Lieser-Strasse 4 D 06120 Halle, Germany
IVUniversity of Rostock Faculty for Agricultural and Environmental Sciences Inst. for Land Use, Justus-von-Liebig - Weg 6, 18044 Rostock, Germany
VUSP/ESALQ Depto. de Engenharia de Biossistemas, C.P. 09 13418-900 Piracicaba, SP Brasil
ABSTRACT
The understanding of the preferential water flow and solute transport is important with regard to losses of nutrients and pesticides that affect the quality of the groundwater or surface water resources. Experiments using the brilliant blue dye tracer, a tension infiltrometer (TI) and a double square infiltrometer (DI) were carried out in the experimental field site located around 15 km southeast of the city of Rostock (North-Eastern Germany) on arable land in a Pleistocene lowland landscape where corn (Zea mays L.) and barley (Hordeum spp.) had been cultivated. One day after dye the infiltration, a pit was dug and vertical profiles were prepared in the TI and DI sites to assess the dye pathways in the subsoil of a Gleyic Luvisol. We wanted to examine if the mottled red and white (bleached) colour-pattern of the Gleyic Luvisol subsoil resulting from temporally stagnant water could be related to flow paths as visualized by dye tracing and if the soil colour could be related to other physical soil properties. Biogenic soil structures were the main transport routes conducting water and solutes into great depth in short time. These pathways had lower bulk density and less cone resistance than the adjacent red or white (bleached) areas of the Gleyic Luvisol subsoil. The red areas were involved in transport because their water contents increased after as compared to before infiltration. However, the measured physical soil properties did not differ between white and red areas. We assume that red areas participate in transport at least by imbibing water from the adjacent biogenic flow paths.
Key words: soil water content, bulk density, cone resistance
RESUMO
O fluxo preferencial de água e o transporte de solutos relacionam-se com perdas de nutrientes e pesticidas e afetam a qualidade de águas subterrâneas. Foram realizados experimentos utilizando o traçador Brilhante Blue, um infiltrômetro de tensão (TI) e um infiltrômetro com "duplos quadrados" (DI) num campo experimental localizado a cerca de 15 km a sudeste da cidade de Rostock (nordeste da Alemanha) num solo onde cultiva-se milho (Zea mays L.) e cevada (Hordeum spp.). Um dia após a infiltração do traçador, perfis de solo foram escavados no local do TI e do DI para observar o fluxo da água deixado pelo do traçador no solo. O objetivo era verificar se os mosqueados vermelhos e partes esbranquiçadas cor-padrão do subsolo do Gleyic Luvisol, resultante da água estagnada temporariamente, poderia estar relacionada ao fluxo da água visualizados pelo traçador e se a cor do solo poderia estar relacionada a outras propriedades físicas do solo. A estrutura biogênica do solo foi a principal rota de transporte conduzindo água e solutos em profundidade e em menor tempo. Esses caminhos tiveram menor densidade do solo e menor resistência do que as áreas vermelhas e esbranquiçadas adjacentes do subsolo do Gleyic Luvisol. Áreas vermelhas foram relacionadas com o transporte devido apresentarem maior conteúdo de água após o teste de infiltração. Entretanto, não houve diferenças entre as propriedades físicas do solo das áreas brancas e vermelhas. Assumiu-se que as áreas vermelhas participaram do transporte de água porque absorveram água do fluxo adjacente, ou seja, dos bioporos.
Palavras-chave: umidade do solo, densidade do solo, resistência
Introduction
The understanding of the preferential water flow and solute transport is important with regard to losses of nutrients and pesticides that affect the quality of the groundwater or surface water resources. The groundwater constitutes a critical water supply component for many sectors, including agricultural use, when considered a clean water resource (Persson et al., 2005).
Many investigators have tried to predict water flow and transport processes in soils with numerical simulation models, which need numerous input parameters from the soil under study. For preferential flow dual porosity and dual permeability models have been developed including various experimental and numerical methods to determine model parameters (Gerke and van Genuchten, 1993). Up to now it is still difficult to determine the fractions of fast and slow flowing regions in such models. All methods to determine parameters are more or less indirect i.e. involve destructive experimentation with soil samples or soil profiles. Attempts have been made to directly deduce information and/or model parameters from soil morphology. However, the use of dye tracers combined with morphological parameters of the soil and image analysis can be useful procedure to examine water flow paths.
On the basis of morphology, the structure of a porous medium is the most important property governing the movement of water through it. Soil structure and preferential flow are thought to be highly related, but quantification of this relationship has remained problematic (Vervoort et al., 1999). Preferential flow or deep penetration of water into the soil profile take place through macropores (Gjettermann et al., 1997) and through cracks or fissures (Bouma, 1991). In this context the soil mechanical strength is an important soil parameter that affects root growth and water movement (Bradford, 1986).
Dye tracing has been used to visualize flow paths and to stain the solutes transport behaviour, ranging from qualitative descriptions of water flow to the quantitative interpretation of the associated pore types and distributions (Beven and Germann, 1982; Flury and Flühler, 1994; Gjettermann et al., 1997; Kasteel et al., 2002; Kim et al., 2006). One major disadvantage of using dyes to study flow paths of water is that the sampling, i.e., excavation of soil, is destructive and experimental results cannot be repeated at the same location. However, the results obtained from staining experiments clearly illustrate the complicated pattern of water movement (Flury et al., 1994).
Red and white areas in the subsoil of the Gleyic Luvisol mark patterns of predominant water saturation and desaturation, i.e. slow-flow and faster-flow regions, respectively. We wanted to examine, if these mottled patterns and the different colours of the subsoil could be related to flow path as visualized by dye tracing and if the soil colours and visualized flow paths could be related to selected physical soil properties.
Material and Methods
The study was carried out in September/October 2006 at an experimental field located around 15 km southeast of the city of Rostock (54º05' N; 12º08' E; 13 m a.s.l.), North-Eastern Germany, on arable land in a Pleistocene lowland landscape. Long-term mean annual precipitation, potential evapotranspiration (modified Penman), and temperature are 665 mm, 561 mm and 8.2ºC, respectively. Experiments were conducted on fields where corn (Zea mays L.) and barley (Hordeum spp.) had been cultivated. The stubble of the crops was disc-ploughed to 0.10 m depth. The sandy loam soil was classified to be a Gleyic Luvisol according to the WRB classification (FAO, 1998; FAO, 2006) or it may be named Pseudogley with respect to the German soil classification. Table 1 gives selected average soil properties (Tiemeyer et al., 2006). The chosen plot within the Dummerstorf field for measuring the infiltration of water and Brilliant Blue FCF dye solution (BB) was located at a level hilltop position.
Two experiments were performed to characterize the water pathways in the soil profile, the soil colours and physical properties. A solution of the dye Brilliant Blue FCF at a concentration of 3 g L-1 was used to stain the flow paths.
A double-square infiltrometer (DI) with inner and outer squares of 0.70 by 0.70 m and 0.80 by 0.80 m, respectively, was used in the first experiment. Steel squares were pushed into the soil about 0.05 m with minimum soil disturbance and then, the inner square was filled with Brilliant Blue (BB) Solution (concentration = 3 g L-1) equivalent to a 0.10 m depth of infiltration and the outer square was filled with water at the same height as that in the inner square to keep infiltration in the inner square vertical. A read ruler was positioned vertically at the center of the inner square and used together with a stop watch - to measure the time every 0.1 m of infiltrated water. Steady state flow was reached after 12 minutes, close to the end of infiltration (Figure 1).
The second experiment was performed using a large tension infiltrometer (TI) filled with the BB solution (Figure 2). The soil was prepared by very gently levelling its upper few cm. This was needed to insure good contact between the 0.65 × 0.65 m square membrane, which was placed onto the soil and attached to the reservoir tower and tension control tube via flexible tube. The suction of infiltration was adjusted at 0.005 m. The amount of water infiltrating into the soil was measured by recording the water level drop in the reservoir tower as a function of time. Steady state flow was reached after 22 hours (Figure 3) and the total infiltration depth accumulated to 0.115 m.
During the infiltration and dye application, a pit was dug at about 0.5 m distance to the outer square and tension infiltration plate. A first profile was prepared in the unstained soil (i.e. without infiltration) and samples were taken from red and white areas as explained below. Then, the day after infiltration, 3 (TI) and 6 (DI) vertical profiles were prepared beneath the TI and DI infiltration areas to assess the extent of dye movement (to a depth of approximately 1 m). A 0.7 by 0.7 m frame was attached in the soil profiles to allow corrections by digital image analysis and then were photographed with a Digital Colour Camera (8 mega-pixels) installed on a tripod positioned in the centre of the area at 1.3 m of the horizontal distance of the profile (Figure 4). This frame was placed at 0.23 m depth from the soil surface because own interest was to visualize the pathways in the stagnic horizon.
The stained patterns on the photographs were analysed using the adobe Photoshop 7.0 including geometrical corrections and for the best identification of the blue areas, the cyan colour intensity was increased by 30% hue and 80% saturation. The "Magic wand tool" in the Photoshop was then applied with 50% tolerance to select the dye stained area. This simple yet efficient procedure yielded accurate identification of the blue stained areas as was visually verified. The resulting selected dye and unstained areas were converted into black and with pictures. Finally, the depth distribution of dye coverage fractions under and outside the cross section of the infiltration area was calculated line for line from the number of black pixel using a custom program code in Excel.
The resistance of the soil to penetration (cone resistance (CR)), the soil water content (θ), and the bulk density (ρ) were randomly obtained for each profile (blocks) and colour (treatments) and, on average, twenty measurements or soil samples per colour per profile were also taken. The experimental data was analysed by the statistical package SPSS 12.0. Boxplot graphs were used to take out the outliers and then the data were submitted to analysis of variance and the averages compared through the Tukey test (p < 0.05). Pearson correlation at the 1% level was utilized to verify the relationship between the analysed soil parameters.
To obtain the penetration resistance (PR) in the white and red (natural colours of the soil) and blue stained areas in the soil profiles, a hand penetrometer (Type IB Eijkelkamp) was used. The principle of the hand penetrometer depends on measuring the highest penetration resistance of the soil against a moving cone. An appropriate cone, according to the expected PR, is mounted to the corresponding probing rod which is attached to the penetrometer via extention rod. The required compression spring is placed in the penetrometer. The indicator ring must be set at the zero position when measuring starts. The cone is pushed, using one hand only, perpendicularly to the soil profile into the investigated spot at a constant velocity of approximately 0.2 m s-1. The indicator ring moves to a position that shows the maximum compression of the spring on the mm scale of the penetrometer. The equation to calculate the cone resistance (CR) is as follows:

After obtaining the cone resistance (CR) measure (total force), small soil volume samples (10.62 cm-3) were obtained in the same spots using a tube sample, consisted of a 0.15 m long of copper pipe with 0.026 m internal diameter and sharpened front edge. The sample tube was pushed into the soil to a depth of 0.02 m. After the sampler was inserted, the soil around the sampler was excavated and the sample contained within the sampler was levelled in the sampler end and removed with a piston. The fresh undisturbed samples were weighed and transported to the laboratory for the traditional determination of soil water content and bulk density.
Results and Discussion
Soil profiles were prepared and the dye patterns were analysed. Within each experiment, the several replicated profiles were similar to each other. Two representative pictures were chosen to show the dye coverage in the subsoil beneath DI and TI (Figures 4 and 5). The variability of the dye pattern and the vertical distribution of the dye coverage beneath the infiltration area (average over all profiles of the DI and TI tests, respectively) are illustrated in Figure 6 for DI and TI. The percentage of dye coverage varied between the methods and was higher for the DI test from 0.23 m to 0.63 m depth, where the TI starts to be higher (Figure 6). The general appearance of the pattern was the same and the vertical concentration in the profile did not vary much (Figure 6).
For both tests, DI and TI, the dye BB has the same behaviour as the stained paths were vertically oriented mainly along biogenic structures (root channels and earthworm burrows) (Figure 4). This was also reported by Gjettermann et al. (1997) who studied preferential flow mechanisms in the field as affected by irrigation intensity and by Flury et al. (1994) who compared soils with respect to their susceptibility of soils to preferential flow of water. Kim et al. (2004) investigated the effect of texture and structure on the infiltration pattern at three field soils and verified that macropores (cracks and veins) and plant roots induced the preferential flow in the studied soils. Water water flow is not always uniform due to the occurrence of macropores which create by-pass channels (Smettem and Trudgill, 1983), and also due cracks or fissures (Bouma, 1991). The visual interpretation of our soil profile pictures suggested that the morphologic specifics of a Pseudogley subsoil - mainly, the white and red areas - were not directly related to the preferential flow paths.
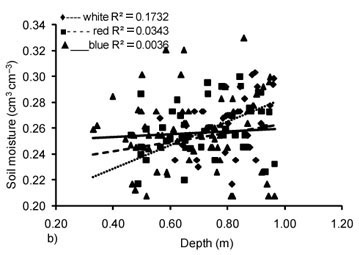
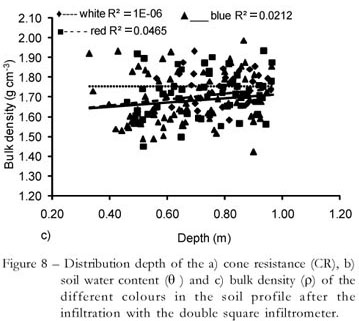
Despite the low regression R2, CR data (Figures 7a and 8a) show a trend to decrease with depth in agreement with the increase of the θ in the profile (Figures 7 b and 8 b), as expected, but r did not vary considerably over depth (Figures 7 c and 8 c). These results can be confirmed, as exemplarily shown in Figure 9 for DI, by the significant Pearson correlation (-0.243) between CR and θ. Vaz et al. (2001) studied the influence of θ and r on penetration resistance (PR) of the soil and verified that PR decreased with increasing θ.


Comparison of mean values of θ, ρ and CR in the differently coloured patches (Table 2) for TI and DI tests, show that there is no difference (p > 0.05) between the red, white and blue colours of the soil with respect to θ for both tests, TI and DI. There were differences (at p > 0.05) of θ in the red coloured areas between before and after infiltration (Table 3). However, there is no such difference for the white areas, suggesting that water flow mainly proceeds through the blue stained bio-channels. From there water flux is following the potential gradient into adjacent red areas and leads to increasing saturation of the red areas; white areas stay stable in water content over the infiltration and redistribution process. Thus white areas may only be involved in transport and transfer by diffusion.
Assuming advective transport from preferential flow regions into red / aerated areas, red areas should be stained after infiltration. However we were not able to visually detect bluish colours in the red areas. We saw evidence of strong sorption of dye BB to the soil material upon infiltration with the tension infiltrometer. Figure 10 shows the tension infiltrometer square about 2 h after infiltration started: lateral processes carried water farther outside the square than BB. BB is probably strongly adsorbed in the root and earthworm channels. Ketelsen and Meyer-Windel (1999) evaluated the adsorption of brilliant blue FCF by soils and verified considerable adsorption of the dye. In their study estimates for the maximum adsorption of the dye could be made from clay and carbon organic contents.
Concerning r, there was no difference (at p > 0.05) between the blue-stained, red, and white areas for the TI test (Table 2). For the DI test, a difference was found (p > 0.05) between the white and blue areas, the latter having lower bulk density (1.67 g cm-3). The blue areas were visually identified as mainly biogenic channels (worm and root burrows). Such structures result from decomposition and mixing of organic and inorganic material and thus usually have a higher pore volume and lower bulk density which are also documented by lower CR-values. In agreement with these results, a buried rice paddy soil had pathways with many fine roots and low r as the major conducting route of water in the profile Kim et al. (2006).
The red and white areas had higher CR-values than the blue (p > 0.05) for both infiltration tests, TI and DI. This is indicative for higher (macro) porosity of the flow path (i.e. the biochannels) as compared to the soil matrix and is in line with observations of Lin and McInnes, (1995). For the DI-profiles the lower CR-measurements in the blue as compared to the white and the red areas go along with the observations on bulk density. For TI the values are less conclusive. Why there is a difference between DI and TI findings can only be guessed. One idea is that the flow under DI was more confined to the core of the biogenic structures than under TI because the infiltration under DI was faster (the same infiltration depth of 0.1 m infiltrated over 12 min under DI whereas it needed almost 1 day under the 5-cm-suction near saturated TI) and thus the infiltration solution was guided only through the very conductive and open channels without much time to be transferred laterally. Using our measurement devices, the measurement values of the blue stained pathways under DI therefore differed from the surrounding areas.
Conclusions
Biogenic flow paths were preferential transport routes for water and solutes and the white and red areas of the soil were not involved in fast advective preferential flow. Aerated areas (red areas) more often participate in transport by imbibing water (and probably conservative solutes) from the main pathways. They may be seen as a short to intermediate buffer for water and solutes due mainly to their direct interaction with the flow pathways, that is, the mottled pattern is not directly caused by preferential flow. During times of infiltration red zones are taking up water from the flow path and during redistribution they may take up soil air from the same pathways. The white zones may stay more or less disconnected.
Acknowledgements
To the financial support of DAAD, to John M. Köehne for the tension infiltrometer, Ms. Tofaute and his crew for discussions and for building the parts of the tension infiltrometer, Ms. Parr, Simeon Lisovski and Thilo Hartwig for field work and in testing and improving the tension infiltrometer.
Received November 23, 2009
Accepted July 23, 2010
- Beven, K.; Germann, P. 1982. Macropores and water flow in soils. Water Resource Research 18: 1311-1325.
- Bouma, J. 1991. Influence of soil macroporosity on environmental quality. Advances in Agronomy 46: 2-37.
- Bradford, J.L. 1986. Penetrability. p. 463-478. In: Klute, A. ed. Methods of soil analysis. 2ed. ASA/SSSA, Madison, WI, USA. (Agronomy Monograph, 9).
- Food and Agriculture Organization [FAO]. 1998. World Reference Base for Soil Resources. FAO/ISSS/ISRIC, Rome, Italy.
- Food and Agriculture Organization [FAO]. 2006. World Reference Base for Soil Resources. FAO/IUSS/ISRIC Rome, Italy.
- Flury, M.; Flühler, H. 1994. Brilliant blue FCF as a dye tracer for solute transport studies-a toxicological overview. Journal of Environmental Quality 23: 1108-1112.
- Flury, M.; Flühler, H.; Jury, W.A.; Leuenberger, J. 1994. Susceptibility of soils to preferential flow of water: a field study. Water Resources Research 30: 1945-1954.
- Flury M.; Jury, W.A. 1995. Tracer characteristics of brilliant blue FCF. Soil Science Society of America Journal 59: 22-27.
- Gerke, H.H.; van Genuchten, M.T. 1993. A dual-porosity model for simulating the preferential movement of water and solutes in structured porous media. Water Resources Research 29: 315-319.
- Gjettermann, B.; Nielsen, K.L.; Petersen, C.T.; Jensen H.E.; Hansen, S. 1997. Preferential flow in sandy loam soils as affected by irrigation intensity. Soil Technology 11: 139-152.
- Kasteel, R.; Vogel, H.-J.; Roth, K. 2002. Effect of non-linear adsorption on the transport behaviour of Brilliant Blue in a field soil. European Journal of Soil Science 53: 231-240.
- Ketelsen, H.; Meyer-Windel, S. 1999. Adsorption of brilliant blue FCF by soils. Geoderma 90: 131-145.
- Kim, J.G.; Chon, C.M.; Lee, J.S. 2004. Effect of structure and texture on infiltration flow pattern during flood irrigation. Environmental Geology 46: 962-969.
- Kim, J.G.; Lee, G.H.; Lee, J.S.; Chon, C.M.; Kim, T.H.; Ha, T. 2006. Infiltration pattern in a regolith-fractured bedrock profile: field observation of a dye stain pattern. Hydrological Processes 20: 241-250.
- Lin, H.S.; McInnes, K.J. 1995. Water flow in clay soil beneath a tension infiltrometer. Soil Science 159: 375-382.
- Persson, M.; Haridy, S; Olsson, J.; Wendt, J. 2005. Solute transport dynamics by high-resolution dye tracer experiments-image analysis and time moments. Vadoze Zone Journal 4: 856-865.
- Smettem, K.R.J.; Trudgill, S.T. 1983. An evaluation of some fluorescent and nonfluorescent dyes in the identification of water transmission routes in soils. Journal of Soil Science 34: 45-56.7
- Tiemeyer, B.; Kahle, P.; Lennartz, B. 2006. Nutrient export rates from artificially drained catchments in North-Eastern Germany at different scales. Agricultural Water Management 85: 47-57.
- Vaz, C.M.P., Bassoi, L.H.; Hopmans, J. W. 2001. Contribution of water content and bulk density to field soil penetration resistance as measured by a combined cone penetrometer - TDR probe. Soil and Tillage Research 60: 35-42.
- Vervoort, R.W., Radcliffe, D.E.; West, L.T. 1999. Soil structure development and preferential solute flow. Water Resources Research 35: 913-928.
Publication Dates
-
Publication in this collection
31 Mar 2011 -
Date of issue
Apr 2011
History
-
Received
23 Nov 2009 -
Accepted
23 July 2010