
Abstract
Epistasis (additive × additive interaction) plays an important role in the genetic architecture of complex traits. This study presents analytical and numerical comparisons of two methods of estimation of additive × additive interaction of QTL effects. In the first method, we observed only the plant phenotype, while in the second method we have additional information from the molecular markers observations. In this study, two data sets were analyzed: i) 150 barley (Hordeum vulgare L.) doubled-haploid lines derived from the cross Steptoe × Morex and ii) 145 doubled-haploid lines of barley obtained from the cross Harrington × TR306. In total, 153 sets of observations were analyzed. The additive × additive interaction effect calculated on the basis of the marker observations is smaller than the total additive × additive interaction effect obtained from phenotypic observations only.
nonallelic interaction effect; doubled haploid lines; quantitative trait loci
GENETICS AND PLANT BREENDING
Analytical and numerical comparisons of two methods of estimation of additive × additive interaction of QTL effects
Jan Bocianowski
Poznan University of Life Sciences, Dept. of Mathematical and Statistical Methods, Wojska Polskiego 28, 60-637, Poznan, Poland
E-mail: jboc@up.poznan.pl
ABSTRACT
Epistasis (additive × additive interaction) plays an important role in the genetic architecture of complex traits. This study presents analytical and numerical comparisons of two methods of estimation of additive × additive interaction of QTL effects. In the first method, we observed only the plant phenotype, while in the second method we have additional information from the molecular markers observations. In this study, two data sets were analyzed: i) 150 barley (Hordeum vulgare L.) doubled-haploid lines derived from the cross Steptoe × Morex and ii) 145 doubled-haploid lines of barley obtained from the cross Harrington × TR306. In total, 153 sets of observations were analyzed. The additive × additive interaction effect calculated on the basis of the marker observations is smaller than the total additive × additive interaction effect obtained from phenotypic observations only.
Keywords: nonallelic interaction effect, doubled haploid lines, quantitative trait loci
Introduction
Numerical and simulation comparisons of the methods of estimation of the parameter connected with the additive gene (quantitative trait locus, QTL) action effect: phenotypic method, which is based on extreme groups of homozygous lines, and genotypic method, which is based on molecular observations were showed by Bocianowski and Krajewski (2009). In this paper, the possibility of better characterize the QTL by allowing for the additive × additive interaction is studied.
Epistasis (additive × additive interaction or nonallelic interaction or QTL × QTL interaction), usually denotes by aa, plays an important role in the genetic architecture of complex traits. Epistasis refers to the phenotypic effects of interactions among alleles of multiple loci (Xing et al., 2002). In the classical quantitative genetics, the epistasis was defined as the deviation from additivity of the effects between alleles of different loci (Cockerham, 1954). Recent genetic analyses using molecular markers in several plant species have clearly shown that, in addition to single locus QTLs, additive × additive interactions play an important role on the genetic basis of quantitative traits (Lark et al., 1995; Li et al., 1997; Maughan et al., 1996; Yu et al., 1997).
The epistasis is a very important genetic parameter and a large number of additive × additive interactions have been detected in rice (Govindaraj et al., 2009; Mei et al., 2005; Norton and Price, 2010; Zhao et al., 2010a; Yu et al., 1997), soybean (Kang et al., 2009), wheat (Liang et al., 2010; Ma et al., 2005; Zhao et al., 2010b).
The study to compare two methods of estimation of the parameter connected with the additive × additive interaction gene action: the phenotypic method, used traditionally in quantitative genetics, and the genotypic method, which is based on marker observations. The comparison was performed by analytical methods and by analyses of real data sets of barley (Hordeum vulgare L.) doubled haploid lines. Comparison of these two methods with respects to obtained estimates and breeding recommendations has not been adequately considered in the literature. Bocianowski (2008) discussed briefly this issue on the basis of one experiment with 120 barley doubled haploid lines and four traits beta-amylase activity, alpha-amylase activity, beta-glucanase activity and cyst nematode resistance.
Materials and Methods
Estimation of the non-allelic gene action effect
If in the experiment we observed n homozygous (doubled haploid, DH) plant lines, we get an n-vector of phenotypic mean observations y = [y1 y2 yn] and q n-vectors of marker genotype observations ml, l=1, 2, , q. The i-th element (i=1, 2, , n) of vector ml is equal 1 or 1, depending on the parents genotype exhibited by the i-th line.
Estimation based on the phenotype
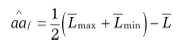
Estimation of the non-allelic interaction of homozygous loci (epistasis) effect aa (Kearsey and Pooni, 1996) on the basis of phenotypic observations y requires identification of groups of extreme lines, i.e., lines with minimal and maximal expression of the observed trait (Choo and Reinbergs, 1982). The group of minimal lines consists of the lines which contain, theoretically, only alleles decreasing the value of the trait. Analogously, the group of maximal lines contains the lines which have only alleles increasing the trait value. In this paper we identify the groups of extreme lines using the quantile method (Bocianowski et al., 1999), in which as minimal (maximal) lines are taken the ones with the mean values smaller (bigger) than 0.03 (0.97) quantile of the empirical distribution of means. The total non-allelic interaction effect aa can be estimated by the formula (Surma et al., 1984).
 (1)
(1)
where and denote the means for the groups of minimal and maximal lines, respectively, denotes the mean for all lines.
Estimation based on the genotypic observations
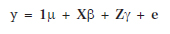
Estimation of aa is based on the assumption that the genes responsible for the trait are closely linked to observed molecular marker. By choosing from all observed markers p we can explain the variability of the trait, and model observations for the lines as
 (2)
(2)
where 1 denotes the n-dimensional vector of ones, µ denotes the general mean, X denotes (n×p)-dimensional matrix of the form X =[ml1 ml2 ... mlp], l1, l2, , lp Î{1, 2, , q}, b denotes the p-dimensional vector of unknown parameters of the form b = [al1 al2 ... alp], Z denotes matrix which columns are products of some columns of matrix X, g denotes the vector of unknown parameters of the form g = [aal1l2 aal1l3 ... aalp-1lp], e denotes the n-dimensional vector of random variables such that E(ei)=0, Cov(ei, ej)=0 for i ≠ j, i, j= 1, 2, , n. The parameters al1, al2, ..., alp are the additive effects of the genes controlling the trait and parameters aal1l2,aal1l3,... aalp-1lp are the additive × additive interaction effects. We assume that the epistatic interaction effects show only loci with significant additive gene action effects. This assumption significantly decreases the number of potential significant effects and causes the regression model more useful.
Denoting 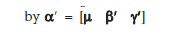 and G = [1 X Z] we obtain the model
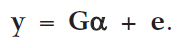 (3)
(3)
If G is of full rank, the estimate of a is given by (Searle, 1982)
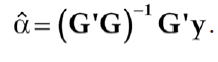 (4)
(4)
The total epistasis effect of genes influencing the trait can be found as
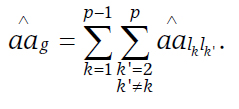 (5)
(5)
Selection of markers chosen for model (2) can be made, e.g., by a stepwise regression procedure (Bocianowski and Krajewski, 2009). Here, we used a three-stage algorithm, in which: first, selection was made by a backward stepwise search independently inside all linkage groups; then, markers chosen in this way were put in one group and subjected to the second backward selection (see Jansen and Stam, 1994). Finally, at the third stage, we considered situations, in which chosen markers were located on the chromosome very close to each other (closer than 5 cM). Because these markers are linked probably to one QTL, only the marker with the largest value of the test statistic was retained in the set. At the first and second stages we used the critical significance level equal to 0.001, resulting from Bonferroni correction.
Examples
In order to compare estimates of aa obtained by different methods the following data sets were used.
Example 1: the data concern 150 doubled haploid (DH) lines of barley obtained from the Steptoe × Morex cross, used in the North American Barley Genome Mapping (NABGM) project and tested at sixteen environments (Kleinhofs et al., 1993; Romagosa et al., 1996; http://wheat.pw.usda.gov/ggpages/SxM). The linkage map used consisted of 223 molecular markers, mostly RFLP, with mean distance between markers equal to 5.66 cM. The lines were analyzed for eight phenotypic traits (alpha amylase, AA; diastatic power, DP; grain protein, GP; grain yield, GY; height, H; heading date, HD; lodging, L; malt extract, ME; Hayes et al., 1993). Grain protein, lodging and malt extract were transformed by arcsin . Missing marker data were estimated by the method of Martinez and Curnow (1994), that is, using non-missing data of flanking markers.
Example 2: the data come also from the NABGM project (Tinker et al., 1996, http://wheat.pw.usda.gov/ggpages/maps/Hordeum) and concern 145 doubled haploid (DH) lines of barley obtained from the cross Harrington × TR306. The lines were analyzed for seven phenotypic traits (weight of grain harvested per unit area, WG; number of days from planting until emergence of 50 % of heads on main tillers, NH; number of days from planting until physiological maturity, NM; plant height, H; lodging transformed by arcsin , L; 1000 kernel weight, KW; test weight, TW). We used the map composed of 127 molecular markers (mostly RFLP) with the mean distance between markers equal to 10.62 cM. Results shown below concern observations from five environments (in four environments observations were made over two years). Total 153 sets of observations, independently for each trait and each environmental for both examples, were considered as separate cases.
Results
Analytical comparison
The estimators of the total epistasis effect, (1) and (5), can be analytically compared under some simplifying assumptions. Model (2) treats the marker observations as fixed. In fact, the vectors ml, l = 1, 2, , q, constitute observations of some random variables. Then, the following two genetic assumptions can be taken into account:
(i) that the markers are unlinked, that is, for any two markers probability of observing (1, 1) or (1, 1) is the same as observing (1, 1) or (1, 1); (ii) that the segregation of each marker is concordant with the genetic model appropriate for the analyzed population, which in our case means that the probability of observing 1 is the same as observing 1.
If the marker data satisfied exactly assumptions (i) and (ii) we would have
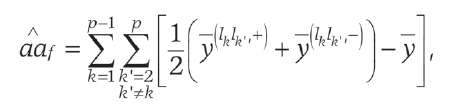 (6)
(6)
where and denote the means for lines with observations of k-th and k-th markers equal 1 and 1, respectively.
Practically, the marker data do not fulfill exactly the conditions leading to (6). The assumption (i) is, however, approximately true if the markers chosen to model (2) are weakly linked, that is, if they are far from each other on the linkage map (possibly in different linkage groups). The assumption (ii) is usually tested by a c2 test before any linkage analysis is done.
Numerical comparison
Tables 1 and 2 contain phenotypic and genotypic, respectively, estimates of the total additive × additive interaction effects for the 150 doubled haploid lines of barley obtained from the Steptoe × Morex cross. In 27 cases (30 %) we did not find significant additive × additive interaction effects (p > 0.05). Epistasis effects with two opposite signs were obtained in 30 cases (Tables 1 and 2). Figure 1 shows the summary of the comparisons between genotypic and phenotypic estimates of the total additive × additive interaction effect in the form of a box-and-whisker diagram of the observed values for the 150 doubled haploid lines of barley obtained from the Steptoe × Morex cross (variability over 16 environments). In most of the considered situations the total additive × additive interaction effect calculated on the basis of the marker observations was smaller than the total additive × additive interaction effect obtained from phenotypic observations only. However, the range of the comparative coefficients is quite large, from -194.19 % for DP in one of the environments (MN92), to 199.84 % for GP in MTi91. The smallest range of values was observed for the trait ME.
Tables 3 and 4 contain phenotypic and genotypicestimates of the total additive × additive interaction effects for the 145 doubled haploid lines of barley obtained from the cross Harrington × TR306, respectively. In 38 cases (60 %) we did not find significant additive × additive interaction effects (p < 0.001). Epistasis effects with two opposite signs were obtained in ten cases (Tables 3 and 4). In Figure 2, comparisons between genotypic and phenotypic estimates of the total additive × additive interaction effect for the 145 doubled haploid lines of barley obtained from the cross Harrington × TR306 is shown. Again, most of the genotypic estimates were smaller than the phenotypic ones. The range of the calculated coefficients was from -140.32 % for WG in ON93b, to 188.62 % for lodging in SK93a. The smallest range of the values was observed for the trait KW.
Discussion
The parameter connected with the additive × additive interaction of genes can influence decisions about usefulness of the breeding material for obtaining new genotypes with characteristics improved over the parental forms. In this paper the methods of estimation of the total additive × additive interaction genes effect were compared analytically and numerically. Under the assumption of correct segregation and no linkage between markers, the formulae for the phenotypic and genotypic estimators are comparable, and that the additive × additive interaction effect of each QTLs pair is smaller than the phenotypic effect.
The numerical comparison of estimates of the additive × additive interaction effect was based on two examples of barley doubled haploid lines. In total, 153 sets of observations were analyzed. Usually the phenotypic estimate of additive × additive interaction is a larger than the genotypic one. These results agree with the intuition, because the phenotypic estimate is an estimate of the total additive × additive interaction effects of all genes pairs influencing the trait, whereas the estimate obtained on the basis of genotypic observations is an estimate of the epistasis action of only selected genes pairs. The range of differences is, like for additive effect (Bocianowski and Krajewski, 2009), most probably a consequence of considering a large variety of experimental situations, traits and environments. In some of the cases epistasis effects obtained on the basis of phenotypic observations only were lower than the QTL × QTL interactions effects. It can be explained by higher diverse of doubled haploid lines on the genetic level than phenotypic diversity.
The method used in this paper was a simple one, of backward stepwise regression. However, a comparison with the results of analysis of the same data by using inclusive composite interval mapping (ICIM) method (described by Li et al., 2008) shows that comparable results were obtained, with respect to the number and effects of QTL × QTL interactions.
Epistatic effects are difficult to detect because an epistatic genetic model potentially contains a large number of model effects (Cheverud and Routman, 1995; He et al., 2011; Zhang and Hu, 2005). Hence, in many QTL studies for quantitative traits were usually assumed absence of epistasis among QTLs (Chen et al., 2010; Frova et al., 1999; Mares and Campbell, 2001; Parker et al., 1998; Sari-Gorla et al., 1999; Ullrich et al., 2009; Xue et al., 2009a,b).
Multiple regression models with additive × additive interactions can be used as a useful statistical tool for QTL characteristic. Very important is assumption that additive × additive interaction effects show only loci linked to markers with significant additive effects. In a previous paper (Bocianowski and Krajewski, 2009) we observed the lack of influence of the marker density on the additive estimates. Hence, marker density has no influence on the additive × additive interaction estimates. Further studies are necessary with respect to additive × additive interaction effects conducted by simulation analysis that would make possible consideration of different experimental situations.
(Received May 16, 2011)
(Accepted January 10, 2012)
Edited by: Antonio Costa de Oliveira
- Bocianowski, J. 2008. Comparison of two methods of estimation of nonallelic interaction of QTL effects on the basis of doubled haploid lines in barley. Agriculturae Conspectus Scientificus 73: 183187.
- Bocianowski, J.; Krajewski, P. 2009. Comparison of the genetic additive effect estimators based on phenotypic observations and on molecular marker data. Euphytica 165: 113122.
- Bocianowski, J.; Krajewski, P.; Kaczmarek, Z. 1999. Comparison of methods of choosing extreme doubled haploid lines for genetic parameter estimation. Colloquium Biometryczne 29: 193202 (in Polish, with abstract in English).
- Chen, G.; Geng, J.; Rahman, M.; Liu, X.; Tu, J.; Fu, T.; Li, G.; McVetty, P.B.E.; Tahir, M. 2010. Identification of QTLs for oil content, seed yield, and flowering time in oilseed rape (Brassica napus). Euphytica 175: 161174.
- Cheverud, J.M.; Routman, E.J. 1995. Epistasis and its contribution to genetic variance components. Genetics 139: 14551461.
- Choo, T.M.; Reinbergs, E. 1982. Estimation of the number of genes in doubled haploid populations of barley (Hordeum vulgare). Canadian Journal of Genetics and Cytology 24: 337341.
- Cockerham, C.C. 1954. An extension of the concept of partitioning hereditary variance for analysis of covariance among relatives when epistasis is present. Genetics 39: 859882.
- Frova, C.; Krajewski, P.; di Fonzo, N.; Villa, M.; Sari-Gorla, M. 1999. Genetic analysis of drought tolerance in maize by molecular markers. I. Yield components. Theoretical and Applied Genetics 99: 280288.
- Govindaraj, P.; Vinod, K.K.; Arumugachamy, S.; Maheswaran, M. 2009. Analysing genetic control of cooked grain traits and gelatinization temperature in a doubled haploid population of rice by quantitative trait loci mapping. Euphytica 166: 165176.
- Hayes, P.M.; Liu, B.H.; Knapp, S.J.; Chen, F.; Jones, B.; Blake, T.; Franckowiak, J.; Rasmusson, D.; Sorrells, M.; Ullrich, S.E.; Wesenberg, D.; Kleinhofs, A. 1993. Quantitative trait locus effects and environmental interaction in a sample of North American barley germ plasm. Theoretical and Applied Genetics 87: 392401.
- He, X.-H.; Qin, H.; Hu, Z.; Zhang, T.; Zhang, Y.-M. 2011. Mapping of epistatic quantitative trait loci in four-way crosses. Theoretical and Applied Genetics 122: 3348.
- Jansen, R.C.; Stam, P. 1994. High resolution of quantitative traits into multiple loci via interval mapping. Genetics 136: 14471455.
- Kang, S.-T.; Kwak, M.; Kim, H.-K.; Choung, M.-G.; Han, W.-Y.; Baek, I.-Y.; Kim, M.Y.; Van, K.; Lee, S.-H. 2009. Population-specific QTLs and their different epistatic interactions for pod dehiscence in soybean [Glycine max (L.) Merr.]. Euphytica 166: 1524.
- Kearsey, M.J.; Pooni, H.S. 1996. The Genetical Analysis of Quantitative Traits. Chapman and Hall, London, UK.
- Kleinhofs, A.; Kilian, A.; Saghai Maroof, M.A.; Biyashev, R.M.; Hayes, P.; Chen, F.Q.; Lapitan, N.; Fenwick, A.; Blake, T.K.; Kanazin, V.; Ananiev, E.; Dahleen, L.; Kudrna, D.; Bollonger, J.; Knapp, S.J.; Liu, B.; Sorrells, M.; Heun, M.; Franckowiak, J.D.; Hoffman, D.; Skadsen, R.; Steffenson, B.J. 1993. A molecular, isozyme and morphological map of the barley (Hordeum vulgare) genome. Theoretical and Applied Genetics 86: 705712.
- Lark, K.G.; Chase, K.; Adelf, F.; Mansur, L.M.; Orf, J.H. 1995. Interactions between quantitative trait loci in soybean in which trait variation at one locus is conditional upon a specific allele at another. Proceedings of the National Academy of Sciences of the United States of America 92: 46564660.
- Li, Z.K.; Pinson, S.R.M.; Park, W.D.; Paterson, A.H.; Stansel, J.W. 1997. Epistasis for three grain yield components in rice Oryza sativa L. Genetics 145: 453465.
- Li, H.; Ribaut, J.-M.; Li, Z.; Wang, J. 2008. Inclusive composite interval mapping (ICIM) for digenic epistasis of quantitative traits in biparental populations. Theoretical and Applied Genetics 116: 243260.
- Liang, Y.; Zhang, K.; Zhao, L.; Liu, B.; Meng, Q.; Tian, J.; Zhao, S. 2010. Identification of chromosome regions conferring dry matter accumulation and photosynthesis in wheat (Triticum aestivum L.). Euphytica 171: 145156.
- Ma, W.; Appels, R.; Bekes, F.; Larroque, O.; Morell, M.K.; Gale, K.R. 2005. Genetic characterisation of dough rheological properties in a wheat doubled haploid population: additive genetic effects and epistatic interactions. Theoretical and Applied Genetics 111: 410422.
- Mares, D.J.; Campbell, A.W. 2001. Mapping components of flour and noodle color in Australian wheat. Australian Journal of Agricultural Research 52: 12971309.
- Martinez, O.; Curnow, R.N. 1994. Missing markers when estimating quantitative trait loci using regression mapping. Heredity 73: 198206.
- Maughan, P.J.; Saghai Maroof, M.A.; Buss, G.R. 1996. Molecular-marker analysis of seed-weight: genomic locations, gene action, and evidence for orthologous evolution among three legume species. Theoretical and Applied Genetics 93: 574579.
- Mei, H.W.; Li, Z.K.; Shu, Q.Y.; Guo, L.B.; Wang, Y.P.; Yu, X.Q.; Ying, C.S.; Luo, L.J. 2005. Gene actions of QTL affecting several agronomic traits resolved in a recombinant inbred rice population and two backcross population. Theoretical and Applied Genetics 110: 649659.
- Norton, G.J.; Price, A.H. 2010. Mapping of quantitative trait loci for seminal root morphology and gravitropic response in rice. Euphytica 166: 229237.
- Parker, G.D.; Chalmers, K.J.; Rathjen, A.J.; Langridge, P. 1998. Mapping loci associated with flour color in wheat (Triticum aestivum L.). Theoretical and Applied Genetics 97: 238245.
- Romagosa, I.; Ullrich, S.E.; Han, F.; Hayes, P.M. 1996. Use of the additive main effects and multiplicative interaction model in QTL mapping for adaptation in barley. Theoretical and Applied Genetics 93: 3037.
- Sari-Gorla, M.; Krajewski, P.; di Fonzo, N.; Villa, M.; Frova, C. 1999. Genetic analysis of drought tolerance in maize by molecular markers. II. Plant height and flowering. Theoretical and Applied Genetics 99: 289295.
- Searle, S.P. 1982. Matrix Algebra Useful for Statistics. John Wiley, New York, USA.
- Surma, M.; Adamski, T.; Kaczmarek, Z. 1984. The use of doubled haploid lines for estimation of genetic parameters. Genetica Polonica 25: 2732.
- Tinker, N.A.; Mather, D.E.; Rossnagel, B.G.; Kasha, K.J.; Kleinhofs, A.; Hayes, P.M.; Falk, D.E.; Ferguson, T.; Shugar, L.P.; Legge, W.G.; Irvine, R.B.; Choo, T.M.; Briggs, K.G.; Ullrich, S.E.; Franckowiak, J.D.; Blake, T.K.; Graf, R.J.; Dofing, S.M.; Saghai Maroof, M.A.; Scoles, G.J.; Hoffman, D.; Dahleen, L.S.; Kilian, A.; Chen, F.; Biyashev, R.M.; Kudrna, D.A.; Steffenson, B.J. 1996. Regions of the genome that affect agronomic performance in two-row barley. Crop Science 36: 10531062.
- Ullrich, S.E.; Lee, H.; Clancy, J.A.; del Blanko, I.A.; Jitkov, V.A.; Kleinhofs, A.; Han, F.; Prada, D.; Romagosa, I.; Molina-Cano, J.L. 2009. Genetic relationship between preharvest sprouting and dormancy in barley. Euphytica 168: 331345.
- Xing, Y.Z.; Tan, Y.F.; Hua, J.P.; Sun, X.L.; Xu, C.G.; Zhang, Q. 2002. Characterization of the main effects, epistatic effects and their environmental interactions of QTLs on the genetic basis of yield traits in rice. Theoretical and Applied Genetics 105: 248257.
- Xue, D.; Chen, M.; Zhang, G. 2009a. Mapping of QTLs associated with cadium tolerance and accumulation during seedling stage in rice (Oryza sativa L.). Euphytica 165: 587596.
- Xue, D.; Huang, Y.; Zhang, X.; Wei, K.; Westcott, S.; Li, C.; Chen, M.; Zhang, G.; Lance, R. 2009b. Identification of QTLs associated with salinity tolerance at late growth stage in barley. Euphytica 169: 187196.
- Yu, S.B.; Li, J.X.; Xu, C.G.; Tan, Y.P.; Gao, Y.J.; Li, X.H.; Zhang, Q.; Saghai-Maroof, M.A. 1997. Importance of epistasis as the genetic basis of heterosis in an elite rice hybrid. Proceedings of the National Academy of Sciences of the United States of America 94: 92269231.
- Zhang, Y.M.; Hu, S. 2005. A penalized maximum likelihood method for estimating epistatic effects of QTL. Heredity 95: 96104.
- Zhao, X.; Qin, Y.; Sohn, J.-K. 2010a. Identification of main effects, epistatic effects and their environmental interactions of QTLs for yield traits in rice. Genes and Genomics 32: 3745.
- Zhao, L.; Zhang, K.-P.; Liu, B.; Deng, Z.-Y.; Qu, H.-L.; Tian, J.-C. 2010b. A comparison of grain protein content QTLs and flour protein content QTLs across environmental in cultivated wheat. Euphytica 174: 325335.
Publication Dates
-
Publication in this collection
28 Mar 2012 -
Date of issue
2012
History
-
Received
16 May 2011 -
Accepted
10 Jan 2012


