Abstract
In grass conservation systems, drying in the field is an essential process upon which the quality and quantity of the material to be conserved is dependent on. In this study a Computational Fluid Dynamics (CFD) model, previously validated, was used to assess qualitatively and quantitatively the field drying process of cut grass under different weather conditions and structural specifications of the grass. The use of the CFD model depicts the climate heterogeneity in the grass area with a special focus on moisture distribution, influence of the weather conditions, in order to create the possibility of applying the model as a decision support tool for an enhanced treatment of the grass after cutting.
evaporation; heterogeneity; forage
AGRICULTURAL ENGINEERING
Moisture content evaluation of biomass using CFD approach
Thomas BartzanasI; Dionysis D. BochtisII,* * Corresponding author < Dionysis.Bochtis@agrsci.dk> ; Claus G. SørensenII; Ole GreenII
ICenter for Research and Technology of Thessaly/Institute of Technology and Management of Agricultural Ecosystems, Technology Park of Thessaly, 1st Industrial Area 38500 Volos Greece
IIAarhus University/Faculty of Science and Technology Dept. of Engineering, Blichers Allé 20 8830 Tjele Denmark
ABSTRACT
In grass conservation systems, drying in the field is an essential process upon which the quality and quantity of the material to be conserved is dependent on. In this study a Computational Fluid Dynamics (CFD) model, previously validated, was used to assess qualitatively and quantitatively the field drying process of cut grass under different weather conditions and structural specifications of the grass. The use of the CFD model depicts the climate heterogeneity in the grass area with a special focus on moisture distribution, influence of the weather conditions, in order to create the possibility of applying the model as a decision support tool for an enhanced treatment of the grass after cutting.
Keywords: evaporation, heterogeneity, forage
Introduction
In most parts of the world, forage conservation is a key element for productive and efficient ruminant livestock farms (Macedo et al., 2010). Forage conservation also provides farmers with means of preserving forage when production is larger than can be adequately utilized by grazing animals. Removal of excess moisture from grass in the field before ensiling can eliminate the problems associated with silage effluent containment and disposal. Biomass moisture influences the management of feedstock streams (Sokhansanj et al., 2002) and the energy economy of conversion processes (Brammer and Bridgewater, 2002). However, field drying is a complex biophysical process involving water retaining properties of the biomass, energy absorption and utilization and removal of vapor from the swath (Nilsson et al., 2005). For this reason, several empirical approaches have been pursued based on diffusion equations, or energy balance approaches considering mass and energy flows (Jenkins et al., 1984; Smith et al., 1988; Monteith and Unsworth, 1990; Atzema, 1992; Nilsson et al., 2005). Nevertheless, there is lack of information concerning the distribution of moisture either along the vertical allocation or along the horizontal allocation of the grass over the whole field, although wide differences in silage moisture content can affect fermentation characteristics of any silage (Hopkins, 2000).
Numerical modeling techniques such as Computational Fluid Dynamics (CFD) can offer an effective way of quantifying accurately the moisture content and other environment parameters of interest under several design and weather conditions within a virtual environment. Typical applications of the CFD in the agri-food industry includes food storage (Le Page et al., 2009), applications such as the estimation of losses of pesticide drift from field crop sprayer (Nuyttens et al., 2010), environmental control of agriculture buildings (Bartzanas et al., 2007; Bartzanas et al., 2010; Molina-Aiz et al., 2009), airborne dust dispersion (Seo et al., 2010), wind flow characteristics (Rosenfeld et al., 2010) and soil management and water pollution (Karmakar et al., 2007; Jia et al., 2010).
This study builds upon a previous study in which the CFD model was developed, calibrated and validated (Bartzanas et al., 2010). In this study, the validated CFD model is used as a way to assess the drying process of cut biomass for different climate conditions and different biomass (cut grass) structural specifications.
Materials and Methods
The CFD model
The commercially available CFD code Fluent® (1998) was used for the implementation in this study. Fluent® code uses a finite volume numerical scheme to solve the equations of conservation for the different transported quantities of flow (mass, momentum, energy, water vapor concentration). The code first performs the coupled resolution of the pressure and velocity fields and then continues with the others parameters, like temperature or water vapor concentration. Special items like the mechanical or climatic behavior of the cut grass were simulated using a customization, i.e., a routine included in a used defined file (UDF) and built for the determination of the parameters exclusively relevant to the grass. The domain of interest was generated and then meshed using the integrated preprocessor software of Fluent®, Gambit.
The CFD technique numerically solved the Navier-Stokes equations and the mass and energy conservation equations. The three-dimensional conservation equations describing the transport phenomena for steady flows in free convection are of the general form:

In Eq (1), Φ denote the transport quantity in a dimensionless form, while U, V and W are the components of the velocity vector m s1; Γ is the diffusion coefficient m2 s1; and SΦ is the source term. The standard k-ε model (Launder and Spalding, 1974) assuming isotropic turbulence was adopted to describe turbulent transport. The k-ε turbulence model is an eddy viscosity model in which the Reynolds stresses are assumed to be proportional to the mean velocity gradients, with the constant of proportionality being the turbulent eddy viscosity. The complete set of equations of the k-ε model can be found in Mohammadi and Pironneau (1994).
Modeling the moisture content of the cut grass
The cut grass in the field was simulated using the equivalent macroporous medium approach, which refers to the combination of the porous medium approach (i.e. modeling the dynamic effect of the crop cover to the flow) with a macro-model of heat and mass transfer between the grass and the surrounding air. The sink of momentum due to the drag effect of the crop, is symbolized by the source term SΦ of the NavierStokes equation (1). This drag force may be expressed by unit volume of the cover by the commonly used formula. The drag force per unit volume of the crop can be expressed as (Wilson, 1985):

where: u is the air velocity, L the leaf area density in m2 m3 and CD the drag coefficient. For the specific case we adopt the value of 0.25 for the grass as it was proposed by Tuzet et al. (1993). The source term, SΦ, is composed of two parts, a viscous loss term (Darcy), and an inertia lose term. In the case of a simple homogenous porous media the source term was described as:

where: a is the permeability of the porous medium (crop) in m2, Y the non linear momentum loss coefficient, and µ the dynamic viscosity in N m2 s. In the case of the grass crop, for reasons of simplicity, we assumed that pressure forces contributed to the major portion of the total canopy drag (Thom, 1971).
The exchange of heat and water vapor between the grass and the air was considered through the heat and mass balance. The sensible heat, Qsen, in W m2 from the crop was calculated using the following equation:

where: Tc is the grass temperature. It must be noted that the performing of the heat and water vapor balances for grass leaves require the introduction of a new phenomenological variable Tc.
The latent heat exchange between crop and air, Qlat in W m2 was calculated according to the following equation:

where: ωc and ωi are the water content of the grass and air in kg kg1 also in the same mesh.
Within each mesh of the grass, the sensible and latent heat exchange depends on the values of the aerodynamic ga and stomatalgs conductance between the virtual solid matrix representing the grass and characterized by its surface temperature Tc and the air Ti. As ga and gs depend on the local computed air speed (u,v,w) and the climatic conditions (T, q), a close coupling is realized between the grass and air flow. The numerical model was customized in C++ in order to perform the balance described above, and based on the local computed air speed and climatic conditions within each mesh of the porous medium. More details can be found in Bartzanas et al. (2004, 2010).
Initial and boundary conditions
The numerical solution precision depends strongly on the accuracy of the boundary conditions and on the way that these conditions are integrated within the numerical model. For the simulation needs, a complete three-dimensional (3D) model was developed. For the geometry, a control volume was selected representing a large domain including the field with the cut grass. The grid was selected after grid independence test studies to ensure the solution independency from numerical errors due to spatial discretization. In addition, mesh properties like the minimal angle for each element and relative determinant of the mesh were extensively studied. Grid quality was checked using as a criterion the EquiAngleSkew criterion (Fluent, 1998).
The boundary conditions used for simulations are based on average values from the measurements from the meteorological station and the same basis was used for the analytical model. The boundary conditions prescribed a null pressure gradient in the air at the limits of the computational domain, and wall-type boundary conditions along the soil.
The basic assumption relating to the transport moisture modeling considers the air as a mixture of dry air-vapor. Moreover, no chemical interaction exists between the dry air and the vapor and the mixture is assumed an ideal gas. As a result, the vapor represents a scalar transported by the airflow, but at the same time, the water vapor properties have an effect on the equations governing the airflow.
At the inlet of the computational domain, a logarithmic inlet velocity profile (atmospheric boundary layer model) was considered. Inlet velocity was defined as:

with

with U the velocity, u* the friction velocity, K the von Karman constant (K = 0.42), z the height, zo the friction length, Uh the reference velocity and h the reference height. The friction length zo was chosen as 0.01 m corresponding to a ploughed up field.
The air velocity (at a reference height) and the air temperature are given as known values using the values from the meteorological mast.
The weather data for the simulations were extracted from a climate database developed and run by the Faculty of Agricultural Sciences at Aarhus University. The database provides scientists, farmers and other open air users with local meteorological data on a real-time basis. The current used weather data were extracted from the Foulum weather station (N6261335, E535275). The actual extracted data included hourly values including the following parameters: air temperature, air relative humidity, air wind speed, air wind direction, net solar radiation, global solar radiation, grass temperature, soil temperature and soil heat flux. The possibility of extracting data from weather stations scattered around Denmark enable the fitting of the stations with models capable to predict drying rates in different regions in Denmark and according to the local climate data.
The results of the numerical CFD simulations were compared to the computations derived from the analytical model. The applied basic analytical model was adopted from Atzema (1992) and Nilsson and Karlsson (1995) and further improved by the authors.
Solution process
The numerical model was used during two periods: i) a period with low outside air relative humidity; hereafter referred as period 1, and ii) a period with high outside air relative humidity, hereafter referred as period 2. Both test periods consisted of three continuous days, which constitute a time period sufficient to achieve a significant decrease in the water content of cut grass. Table 1 summarizes the average values of the two periods, together with the initial values which was used in the numerical model.
Two steps are invoked to determine the drying process of cut grass with the numerical model (CFD): first, a converged solution under steady-state conditions was obtained based on the boundary conditions described in Table 1. Then, an unsteady flow was considered where the initial water content of cut grass was set to 1 kg kg1. The time step was initial set to 1 s in order to control the solution process and then gradually increased to reach its maximum value of 15 s.
Results
The water content in the cut grass was steadily decreasing during the course of the day according to the local climate conditions which lead to an evapotranspiration process (Figure 1). However, during the night period, a small increase in the water content of the grass was observed caused by the dew or condensation during this period. By having obtained valid comparisons for the two selected periods and considering that the CFD model has been globally validated, the CFD model was used for case studies in order to examine the influence of different factors which affect the drying process of the cut grass.
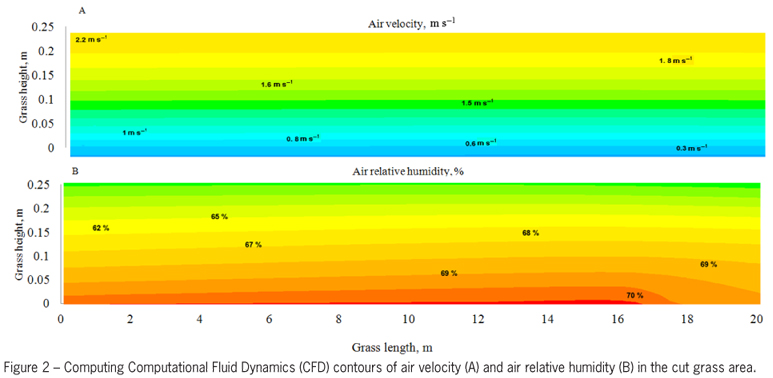
Figure 2 presents contours of air velocity and air relative humidity in the first 50 m of the cut grass since the use of the whole grass area would not provide detailed information for the flow and scalars fields. Results concern the outside conditions prevailing during the 1st period with low outside air humidity.
The velocity profile is mainly guided by the slope of the area and the wind speed and direction. Air flows down from the direction of the grass and continues down the soil. Mean, minimum, and maximum values of air velocity in the whole grass area (1 ha) was 0.58, 0.05 and 2.2 m s1, respectively. The value of the relative humidity depended both on the values of the local climate (mainly air velocity and air temperature) and on the rate of transpiration and the evaporation from the soil. Mean, minimum, and maximum values of relative humidity in the whole grass area (1ha) were 67 %, 62 % and 70 % respectively.
The air temperature profile follows the distribution of the air. Outside air with temperature of 15.8 ºC enters the area of grass and steadily, mainly due to transpiration process, its value was reduced. Values of soil heat fluxes will not change the distribution of air temperature (p < 0.05). Mean, minimum, and maximum values of air temperature in the whole grass field were 10.8, 8.2, and 14.8 ºC, respectively.
Figure 3 presents the distribution of the air relative humidity along the grass length in the middle height of the grass (i.e. 0.125 m from ground) and along the grass height in the middle of the grass field. The variation of air relative humidity is increased along the length of the grass. Smaller variations were observed along the grass height. However, this can be partially attributed to the height of the grass (i.e. 0.25 m). The major parts of the variations were occurring close to the boundary of the grass swath where the influence of outside climate variables is most significant. Even in the middle of the grass swath, the distributions of air velocity and air relative humidity were homogeneous. Air temperature distribution is also heterogeneous but to a smaller extend.
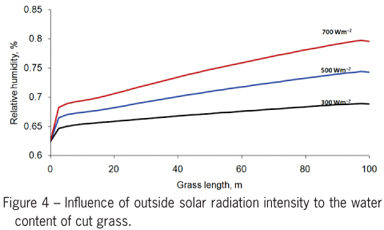
Solar radiation is the main source of energy for evaporating moisture from a drying crop. For example, Rotz and Chen (1985) and Savoie and Beauregard (1990) both showed that forage drying rate was most closely related to the amount of solar radiation. Figure 4 presents the influence of solar radiation in the distribution of air relative humidity in the cut grass field. As expected, higher values of solar radiation lead to higher values of relative humidity due to higher evapotranspiration rate.
Another parameter potentially influencing the drying process of the cut grass is the height of the cut grass swath in the field. The height of the swath apart from the obvious increase of grass mass volume alters the aerodynamic resistance of the grass and thus it increases the transpiration rate of the grass (Monteith and Unsworth, 1990). Figure 5 presents the air relative humidity distribution in a cut grass field of three different heights of (A) 0.25 m, (B) 0.35 m, and (C) 0.5 m height. Relative humidity was increased with increasing of grass height. The mean value of relative humidity in the 0.25 m height swath was 67 %, while it was increased to 69 % in the 0.35 m height swath and it was further increased to 72 % in the 0.5 m height swath.
Discussion
Usually a period of 36 h is considered adequate to allow grass to evaporate a significant part of its initial moisture content and thus be transferred into a suitable state for further handling (transport, storage, etc.). Moreover, grass should not be left in the field for more than two days as prolonging field drying beyond two days will reduce the feeding value (Wright et al., 2000). In the present study, this period can be varied according to the outside climate conditions and the structure and shape (i.e. height) of the cut grass. Table 2 presents a summary of the time needed in order for the water content in the cut grass to be reduced to half the value as compared to its initial moisture for the variables and parameters examined in the present study, i.e. the outside relative humidity and solar radiation, and the height of the cut grass.
For the operational planning of harvesting and handling of the cut grass before collection and chopping and prior to transporting to the silage stack, there is a need to provide dedicated decision support to the farmer. In practice, in most cases,the farmer solves this problem by using his experience to decide when to start executing a specific operation and how much labor and machinery should be assigned to such an operation. However, such an approach to the decision making process can lead to solutions that are far from the optimal one due to lack of information on the biological and meteorologicalconditions in the field (Sørensen and Bochtis, 2010; Romanelli and Milan, 2010). An advanced decision support system should incorporate the analysis of the moisture content of the crop combining information with the predicted weather conditions as a way to determine drying time in terms of optimal dry matter content.
According to the preliminary performance results from such a decision support system based on analytical moisture prediction models, the percentage of successful scheduling recommendations on collecting the cut grass ranged from 83.33 % to 94.61 % (Bochtis et al., 2010). It is expected that the implementation of CFD based approaches on the cut grass moisture content prediction will enhance the accuracy and reliability of this kind of decision support systems, since CFD models provide the capability to emulate the development of the drying process and its details from which this process is influenced and thus increase the prediction's accuracy. The introduction of such integrated systems is expected to increase the effectiveness of developed scheduling and planning models for field operations (Bochtis and Sørensen, 2010).
Received October 28, 2010
Accepted March 14, 2012
Edited by: José Euclides Stipp Paterniani
- Atzema, A.J. 1992. A model for the drying of grass with realtime weather data. Journal of Agricultural Engineering Research 53: 231247.
- Bartzanas, T.; Kittas, C.; Boulard, T. 2004. Effect of vent arrangement on windward ventilation of a tunnel greenhouse. Biosystems Engineering 88: 479490.
- Bartzanas, T.; Kittas, C.; Sapounas, A.A.; Nikita-Martzopoulou, C. 2007. Analysis of airflow through experimental rural buildings: sensibility to turbulence models. Biosystems Engineering 97: 229239.
- Bartzanas, T.; Bochtis, D.D.; Sørensen, C.G.; Sapounas, A.A. 2010. A Numerical modelling approach on biomass field drying. Biosystems Engineering 106: 458469.
- Bochtis, D.D.; Sørensen, C.G. 2010. The vehicle routing problem in field logistics. Part II. Biosystems Engineering 105: 180188.
- Bochtis, D.D.; Sørensen, C.G.; Green, O.; Bartzanas, T.; Fountas, S. 2010. Feasibility of a modelling suite for the optimised biomass harvest scheduling. Biosystems Engineering. http://dx.doi.org/10.1016/j.biosystemseng.2010.05.005
» link - Brammer, J.G.; Bridgewater, A.V. 2002. The influence of feedstock drying on the performance and economics of a biomass gasifier-engine CHP system. Biomass and Bioenergy 22: 271281.
- Fluent, 1998. Fluent v5.3 Manual, Sheffield, UK.
- Jenkins, B.M.; Ebeling, J.M.; Rumsey, T.R. 1984. Modeling approaches to simulating the field drying of biomass. ASAE Paper No. 84-3066. St Joseph, USA.
- Jia, D.; Shao, X.; Wang, H.; Zhou, G.; 2010. Three-dimensional modeling of bank erosion and morphological changes in the Shishou bend of the middle Yangtze River. Advances in Water Resources 33: 348360.
- Hopkins, A., ed. 2000. Grass: Its Production and Utilization. Blackwell Science, Oxford, UK.
- Karmakar, S.; Kushwaha, R.L.; Lague, C. 2007. Numerical modeling of soil stress and pressure distribution on a flat tillage tool using Computational Fluid Dynamics. Biosystems Engineering 97: 407414.
- Launder, B.E.; Spalding, D.B. 1974. The numerical computation of turbulent flows. Computer Methods in Applied Mechanics and Engineering 3: 269289.
- Le Page, J.F.; Chevarin, C.; Kondjoyan, A.; Daudin, J.D.; Mirade, P.S. 2009. Development of an approximate empirical-CFD model estimating coupled heat and water transfers of stacked food products placed in airflow. Journal of Food Engineering 92: 208216.
- Macedo, R.; Tarré, R.M.; Ferreira, E.; Rezende, C.P; Pereira, J.M.; Cadisch, G.; Rouws, J.R.C.; Alves, B.J.R.; Uquiaga, S.; Boddey, R.M. 2010. Forage intake and botanical composition of feed for cattle fed Brachiaria/legume mixtures. Scientia Agricola 67: 384392.
- Mohammadi, B.; Pironneau, O. 1994. Analysis pf the k-epsilon turbulence model. Research in Applied Mathematics, Wiley, New York, NY, USA.
- Molina-Aiz, F.D.; Valera, D.L.; Peña, A.A.; Gil, J.A.; López, A. 2009. A study of natural ventilation in an Almería-type greenhouse with insect screens by means of tri-sonic anemometry. Biosystems Engineering 104: 224242.
- Monteith, J.L.; Unsworth, M. 1990. Principles of Environmental Physics. 2ed. Edward Arnold, London, UK.
- Nilsson, D.; Karlsson, S. 1995. A model for the field drying and wetting processes of cut flax straw. Biosystems Engineering 92: 2535.
- Nilsson, D.; Svennerstedt, B.; Wretfors, C. 2005. Adsorption equilibrium moisture contents of flax straw, hemp stalks and reed canary grass. Biosystems Engineering 91: 3543.
- Nuyttens, D.; De Schampheleire, M.; Verboven, P.; Sonck, B. 2010. Comparison between indirect and direct spray drift assessment methods. Biosystems Engineering 105: 212.
- Romanelli, T.L.; Milan, M. 2010. Material flow determination through agricultural machinery management. Scientia Agricola 67: 375383.
- Seo, I.H.; Lee, I.B.; Shin, M.H.; Lee, G.Y.; Hwang, H-S.; Hong, S-W.; Bitog, J.P.; Yoo, J.I.; Kwon, K.S.; Kim, Y.H.; Bartzanas, T. 2010. Numerical prediction of fugitive dust dispersion on reclaimed land in Korea. Transactions of the ASABE 53: 891901.
- Smith, E.A.; Duncan, E.J.; McGechan, M.B.; Haughey, D.P. 1988. A model for the field drying of grass in windrows. Journal of Agricultural Engineering Research 41: 251274.
- Rosenfeld, M.; Marom, G.; Bitan, A. 2010. Numerical simulation of the airflow across trees in a windbreak. Boundary-Layer Meteorology 135: 89107.
- Rotz, C.A.; Chen, Y. 1985. Alfalfa drying model for the field environment. Transactions of the American Society of Agricultural Engineers 28: 16861691.
- Savoi, P.; Beauregard, S. 1990. Predicting the effects of hay swath manipulation on field drying. Transactions of the American Society of Agricultural Engineers 33: 17901794.
- Sokhansanj, S.; Turhollow, A.; Cushman, J.; Cundiff, J. 2002. Engineering aspects of collecting corn stover for bioenergy. Biomass and Bioenergy 23: 347355.
- Sørensen, C.G.; Bochtis, D.D. 2010. Conceptual model of fleet management in agriculture. Biosystems Engineering 105: 4150.
Publication Dates
-
Publication in this collection
28 Sept 2012 -
Date of issue
Oct 2012
History
-
Received
28 Oct 2010 -
Accepted
14 Mar 2012