Abstract
Appropriate management of agricultural crop residues could result in increases on soil organic carbon (SOC) and help to mitigate gas effect. To distinguish the contributions of SOC and sugarcane (Saccharum spp.) residues to the short-term CO2-C loss, we studied the influence of several tillage systems: heavy offset disk harrow (HO), chisel plow (CP), rotary tiller (RT), and sugarcane mill tiller (SM) in 2008, and CP, RT, SM, moldboard (MP), and subsoiler (SUB) in 2009, with and without sugarcane residues relative to no-till (NT) in the sugarcane producing region of Brazil. Soil CO2-C emissions were measured daily for two weeks after tillage using portable soil respiration systems. Daily CO2-C emissions declined after tillage regardless of tillage system. In 2008, total CO2-C from SOC and/or residue decomposition was greater for RT and lowest for CP. In 2009, emission was greatest for MP and CP with residues, and smallest for NT. SOC and residue contributed 47 % and 41 %, respectively, to total CO2-C emissions. Regarding the estimated emissions from sugarcane residue and SOC decomposition within the measurement period, CO2-C factor was similar to sugarcane residue and soil organic carbon decomposition, depending on the tillage system applied. Our approach may define new emission factors that are associated to tillage operations on bare or sugarcane-residue-covered soils to estimate the total carbon loss.
soil respiration; carbon dioxide; emission after tillage; soil organic carbon
Soil and crop residue CO2-C emission under tillage systems in sugarcane-producing areas of southern Brazil
Luís Gustavo TeixeiraI; Mariana Marotti CorradiI; Adrian FukudaI; Alan Rodrigo PanossoI,* * Corresponding author < alanrp@mat.feis.unesp.br> ** Present address: UNESP/FEIS, Av. Brasil, 56 15385-000 Ilha Solteira, SP Brasil. Edited by: João Luís Nunes Carvalho ,** * Corresponding author < alanrp@mat.feis.unesp.br> ** Present address: UNESP/FEIS, Av. Brasil, 56 15385-000 Ilha Solteira, SP Brasil. Edited by: João Luís Nunes Carvalho ; Donald ReicoskyII; Afonso LopesI; Newton La Scala Jr.I
IUNESP/FCAV, Via de Acesso Prof. Paulo Donato Castellane s/n 14884-900 Jaboticabal, SP Brasil
IIARS/USDA, North Central Soil Conservation Research Lab, 803 Iowa Ave., Morris, MN 56267 USA (Retired Soil Scientist)
ABSTRACT
Appropriate management of agricultural crop residues could result in increases on soil organic carbon (SOC) and help to mitigate gas effect. To distinguish the contributions of SOC and sugarcane (Saccharum spp.) residues to the short-term CO2-C loss, we studied the influence of several tillage systems: heavy offset disk harrow (HO), chisel plow (CP), rotary tiller (RT), and sugarcane mill tiller (SM) in 2008, and CP, RT, SM, moldboard (MP), and subsoiler (SUB) in 2009, with and without sugarcane residues relative to no-till (NT) in the sugarcane producing region of Brazil. Soil CO2-C emissions were measured daily for two weeks after tillage using portable soil respiration systems. Daily CO2-C emissions declined after tillage regardless of tillage system. In 2008, total CO2-C from SOC and/or residue decomposition was greater for RT and lowest for CP. In 2009, emission was greatest for MP and CP with residues, and smallest for NT. SOC and residue contributed 47 % and 41 %, respectively, to total CO2-C emissions. Regarding the estimated emissions from sugarcane residue and SOC decomposition within the measurement period, CO2-C factor was similar to sugarcane residue and soil organic carbon decomposition, depending on the tillage system applied. Our approach may define new emission factors that are associated to tillage operations on bare or sugarcane-residue-covered soils to estimate the total carbon loss.
Keywords: soil respiration, carbon dioxide, emission after tillage, soil organic carbon
Introduction
Losses of soil organic carbon (SOC) due to soil management in agricultural areas have been identified as a factor that accelerates the greenhouse effect, especially by emitting CO2 in the atmosphere (Eugster et al., 2010). Losses of SOC can be assessed either by directly measuring changes in SOC content or by monitoring soil CO2 emissions. The latter has the advantage to detect immediate or near-immediate effects of management practices on C loss via emissions. The impact of tillage on the loss of SOC and associated emission factors under different management systems has been studied (Smith et al., 2010; La Scala et al., 2008; La Scala et al., 2009 a,b), and some researchers have used tillage emission factors as bias for estimating soil conversion from conventional to no-till. However, Smith et al. (2010) noted that this conversion can be affected by the depth of tillage, and multiple factors should be developed to reduce estimation errors.
Agricultural activities contribute with approximately 20 % to the global greenhouse gas emissions (Lokupitiya and Paustian, 2006). No-till farming combined with the maintenance of crop residues on the soil surface has been identified as an important strategy for sequestering carbon (C) from the atmosphere (Lal, 2007). Tillage induces the loss of C as CO2 by breaking up soil aggregates and exposing the protected organic matter to microbes. Tillage also incorporates and mixes residues, improving aeration, which can lead to additional C losses by maximizing soil-residue contact compared with no-residue incorporation (Jacinthe and Lal, 2005; Six et al., 1999).
Soil organic matter decay induced by tillage is related to soil temperature, soil moisture, and the amount and quality of soil organic carbon (Zhang et al., 2011; Heal et al., 1997; Schomberg and Steiner, 1997; Beare et al., 1992). But, some researchers have shown higher emissions under NT relative to tilled plots attributed to decomposition of old surface residues (Oorts et al., 2007; Soane et al., 2012). Recently, some researchers have used no-till emission and its exponential decay in time as a reference to estimate CO2 emission after tillage (La Scala et al., 2008, 2009 a,b); by subtracting the CO2 emission after tillage from the no-till emission, it is possible to estimate the effect of tillage. Our hypothesis is that accelerated decomposition due to tillage is the major cause of short-term CO2 emissions. Our objectives were to distinguish the effect of both soil and crop residues on the CO2 emissions caused by several tillage systems in sugarcane (Saccharum spp.) areas of Brazil.
Materials and Methods
Experimental plots and treatment application
This research was conducted in 2008 on a field inside a sugarcane mill area located in Barrinha (location A - 21º11' S and 48º09' W, 542 m above sea level), and in 2009 on a field located in Guatapará (location B - 21º29' S and 48º02' W, 512 m above sea level), São Paulo State, Brazil. The climate is described as Aw, according to Köp-pen, i.e., subtropical with an average annual temperature of 21 ºC, with mean annual precipitation of 1,380 mm. The soil in these locations is an Oxisol (Psamitic Eutroferric red latosol, FAO, respectively) and is described as a Latossolo Vermelho Eutroférrico according to Brazilian Soil Classifi cation. Both soils presented a pH around 5.0, Location A soil (2008) presented an average organic carbon content of 18.1 g C dm3, base saturation of 44 % from 040 cm depth. Particle size distribution of sand, silt, and clay were 190 g kg1, 166 g kg1 and 644 g kg1 respectively. Location B soil (2009) presented an average organic carbon content of 22.67 g C dm3, base saturation of 63 % from 040 cm depth. Particle size distribution of sand, silt, and clay were similar to those values observed in the soil of the first year experimental plots.
The soils of both locations have been used for sugarcane production in the last 15-20 years, by using a green management system which involves mechanized harvesting. This harvesting procedure has provided the return of large amounts of sugarcane crop residues on soil surface and favored soil organic matter accumulation, compared to the burn system where the sugarcane is burned in the field a few days before harvesting. The crop residues (15 Mg ha1, dry mass) had high C:N ratios (close to 125:1 in location A; Gava et al., 2005, and close to 99:1 in location B). Tillage operations were applied every six years with chisel plows and ratoon remover.
On July 12, 2008, four tillage systems were applied to 10 × 2 m plots (Table 1) as follows: 1) heavy offset disk harrow followed by offset disk harrow (HO); 2) chisel plow (CP); 3) rotary tiller (RT); and 4) sugarcane mill tillage system with a ratoon remover followed by subsoiler coupled with a roller for clod breaking (SM). Each of the tillage systems was applied to two plots, one with crop residues (wc) on the soil surface and the other without crop residues (nc). In addition, no-till plots (NT) without crop residues (nc) were left as controls without tillage.
Three optional passes of the rotary tiller were used to achieve higher aggregate breakdown and smaller soil aggregate sizes. Tillage was performed using a tractor with motor power of 77.3 kW, a forward travel velocity of 3.5 km h1 and a rotary tiller running at 2.5 km h1. The plots with no crop residues had the residue removed just before tillage. The residues had lain on the soil surface since the harvest two days previously. Residue pieces were approximately 0.20 m long before and 0.05 m after tillage, and most were incorporated into the soil.
In the second experiment, 11 treatments were established in plots of 10 × 2 m in 2009 (Table 1). As in 2008, the sugarcane residues were removed from the soil surface in plots without crop residues. Plots under moldboard plowing (MP) were tilled to a working depth of 30 cm with three shanks. The configurations adopted for the tillage with rotary tiller (RT) were a lowered impact plate and a rotor speed of approximately 153 rpm with 32 C-type knives and a medium working depth of 8 cm. The typical tillage used by the sugarcane mill (SM) consists of applying the ratoon remover, followed by disk harrows and subsoiler to a working depth of 12 cm. In treatments with a chisel plow (CP), a pull-type ripper with five shanks, 2.90 m in width, spacing between shanks of 0.45 m, and working depth of 30 cm was combined with a roller. The plots treated with the subsoiler (SUB) were tilled to a working depth of 35 cm, with 45 cm between shanks, using a simple 7 cm tip.
Soil CO2 emission, soil temperature and moisture measurement
In each plot and for both experiments, a total of six PVC collars were inserted 3 cm into the soil, resulting in a total to 54 collars in experiment 1 and 66 collars in experiment 2 to support the chamber used for measuring soil respiration. The collars were inserted 24 h before the first measurement, just after the tillage, in order to minimize the disturbances due to placing the chamber into the soil; the placement of the chamber may disrupt, for example, the soil pore structure and artificially increase soil CO2 emissions, leading to overestimation of the value at that point. Measurements of CO2 flux, temperature and soil moisture, for experiment 1, were made until July 27, 2008, 15 days after tillage. During the first seven days of study, daily measurements were taken, and thereafter, measurements were performed every other day. For experiment 2, measurements were made until Aug 13, 2009. Until Aug 9, measurements were made daily, at 24 hour intervals, and then another measurement was made on Aug 13, 2009, so that all 13 evaluations were performed within 16 days of study. No rain occurred during the experiments, which were performed during the dry season.
Soil CO2 emission was measured using a portable LI-8100 system (LI-COR, Lincoln, Nebraska, USA). This system consists of a closed chamber connected to the PVC collars previously installed in the soil, with an internal volume of 991 cm3 and a soil contact area of 71.6 cm2. Every measurement started at 07h30 and each data point was measured within 90 s. In the measurement mode, the CO2 concentration of the air inside the chamber is continuously measured by optical absorption spectroscopy. The increase in CO2 concentration inside the chamber was followed every second during approximately two minutes, provide the basis for computing the soil CO2 emission for each sample point. The CO2 concentration data on the first moments after the close of the chamber were not considered for the subsequent procedures, and thus around 90 measurements data were used to interpolate and calculate emissions. At the end of logging period, an exponential regression analysis between the CO2 concentrations inside the chamber and time was computed, and the emission on that point was calculated based on CO2 concentration increases in time after chamber closure.
Soil temperature was monitored with a LI-8100 system consisting of a 20 cm rod inserted into the soil perpendicular to the surface near the PVC collars used for measuring the CO2 emissions. Soil temperature readings were taken simultaneously with measurements of soil CO2 emission. Soil moisture was measured with a TDR (time-domain reflectometry) system, the Hydrosense System (Campbell Scientific, Utah, USA). The TDR also consisted of 12 cm rods inserted vertically into the soil near the PVC collars. Because the experiment was performed in the dry season, there was no precipitation during the experiment.
Mathematical and statistical analysis
To calculate emission factors we assumed the C in sugarcane residue as 40 % of mass content (Ball-Coelho 1993; De Oliveira et al., 1999), therefore the amount of C in the sugarcane residue on soil surface at tillage was determined by multiplying 15 Mg ha1 of residue by a factor of 0.4 which resulted in 6.0 Mg ha1 of organic carbon. Soil organic carbon loss induced by tillage was assessed by subtracting the emission from plots tilled without crop residues from that of nontilled plots without crop residues (NTnc). Likewise, the CO2-C loss from crop residues was assessed by subtracting CO2-C from plots where the same tillage system was applied, but with or without crop residues on the soil surface. Here, we assume that in a plot without crop residues, the difference between tillage-induced and no-till emission is directly related to soil organic carbon loss, while that between tillage-induced emission in plots with crop residues and tillage-induced emission in plots without crop residues is directly related to the crop residues. Hence, the additional soil CO2-C loss due to residues was divided by the total of carbon present in crop residues to derive crop residues emission factors.
The temporal variability of CO2-C was characterized by two-way analysis of variance (each one of the six PVC was used as a pseudo-replicate). This was performed in a completely randomized design in repeated measurement over time, using a mixed model: treatments and the interaction treatments × time as fixed effect and time as random effect, using the Proc Mixed procedure of SAS (SAS version 9.1, SAS institute, Cary, NC, USA) (Kepner and Robinson, 1988). Prior to the above analysis, the data were tested for sphericity using the Mauchly's test of sphericity matrix of variance and covariance between times. Only for FCO2, in both experiments, the Mauchly's test was significant at 5 % level, therefore, the assumption of sphericity was rejected, however, it was possible to analyze repeated measures data by first modeling the variance and correlation structure of the repeated measures. In this case the structure of covariance that best fitted the data, according to Bayesian information criterion (BIC), were Factor Analytic and Unstructured for first and second-years experiment, respectively (Littel et al., 1998).
When significant, differences between treatments within each measurement time were compared using the Fisher's least significant difference (p < 0.10). The total emission was estimated by the area under emissions curves in time after tillage, and one-way analysis of variance (ANOVA) in a completely randomized design was applied to test the hypotheses of differences in the total emission means. In this case, pairwise comparison of means, for all treatments in each of the experiments was performed using Tukey procedure, with a p value < 0.10 considered significant.
Results and Discussion
Temporal variability of CO2-C emission
Tilled plots with crop residues had the highest values (p < 0.10), with CPwc, RTwc and SMwc treatments showing emissions of 0.42, 0.38 and 0.35 g m2 h1 of CO2-C respectively, in the first four of the study when compared with NTnc plot (Figure 1). However, higher emissions persisted for SMwc till the end of the studied period. NTnc emissions were different (p < 0.10) when compared to the other treatments in all experimental days, except for 4th day of study, when no difference was observed between NTnc and SMwc (p > 0.10). When NTnc and treatments with no crop residues were compared, the tillage effect showed a difference in emissions that decreased with time, and this decrease was similar to the exponential decay observed in many studies (Reicosky and Lindstrom, 1993; Fortin et al., 1996; Rochette and Angers, 1999; Al-Kaisi and Yin 2005; La Scala et al., 2001, 2005, 2006). Similarly, emissions were generally greater under tillage without residues relative to NTnc.
The differences between NTnc and RTnc or NTnc and SMnc CO2-C emission were mostly due to the exposure of additional labile C to microbes. This exposure was caused by the breaking of aggregates by rotary tillage and the consequent changes in the soil organic carbon decay factor. However, when CO2-C emissions of RTnc and RTwc or SMwc and SMnc were compared, an additional increase, most likely due only to the contribution of crop residues, was observed. Here, it is assumed that the aggregate breakdown and the contribution of labile C to the emissions were the same in both plots with the same tillage treatment.
Tillage with the chisel and heavy offset disk harrowing did not result in differences in emissions in plots with or without crop residues, during to the experimental period, except for chisel on the first and sixth days of study (Figure 1). The persistence of crop residues in plots under CPwc and HOwc tillage indicated that in these treatments, the crop residues were not incorporated into the soil and/or were not as fragmented as those under other tillage methods. This difference was reflected in the absence of additional emission due to the presence of crop residue on surface on most days. Despite these differences, all the plots reached a similar emission value at the end of the 15th day of the study of approximately 0.12 g m2 h1 of CO2-C.
For second-year experiment, higher soil CO2-C emissions (p < 0.10) were observed after SM and CP tillage systems, with values of 0.26 and 0.24 g m2 h1, respectively, one day of study, with lower emissions coming from the NTnc plot as expected. The effects of tillage and the presence of crop residues associated with the tillage are shown in Figure 2. When NTnc and treatments without crop residues are compared, as in the first-year experiment, the effect of soil tillage was reflected in a difference in emissions that decreased with time (Al-Kaisi and Yin 2005; La Scala et al., 2005; 2006). However, emissions in plots with crop residues did not show uniformly high differences when compared with emissions from plots without crop residues, for example, under rotary tillage.
Total/cumulative emissions
The total emissions during the 15-day study were as high as 68.11 and 63.88 g CO2-C m2 for RTwc and SMwc, respectively, and as low as 36.82 and 37.32 g CO2-C m2 in CPnc and NTnc, respectively (Figure 3). The 18.10 and 18.76 g CO2-C m2 increases in total emission from RTnc to RTwc and from SMnc to SMwc are equivalent to 181 and 188 kg CO2-C ha1 emitted in 15 days, mainly from the incorporated crop residues. Given that sugarcane C concentration of 40 % was about 15 Mg ha1, we estimated short term loss to be 3 % of total C associated with sugarcane residues. Our result is consistent with that reported by Resende et al. (2006), who found that part of the C stored and associated with crop residues in soil was lost after tillage during the replanting period, which usually occurs every six years in sugarcane areas. Changes in SOC emission due to tillage incorporation have previously been reported by Adiku et al. (2008) and Al-Kaisi and Yin (2005).
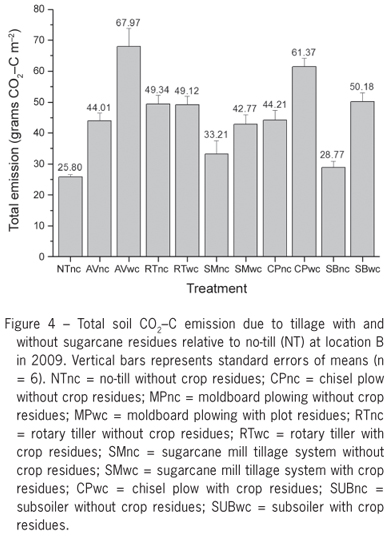
The treatments RTwc and RTnc resulted in similar total CO2-C emissions with values of 49.12 and 49.34 g CO2-C m2, respectively, 16 days after soil tillage (Figure 4). The remaining tillage systems, subsoiling and chisel plowing, led to only small differences in additional emissions, when crop residue was or was not present in the soil surface at the time of tillage (Figure 2).
Treatment RT did not cause large differences in emissions over the day following tillage between plots with and without crop residues (Figure 3). The effect of tillage on losses of soil organic carbon and crop residues was more pronounced in the plot with moldboard plowing (MP), as is expected from a tillage system that causes a large breakdown of aggregates. An increase in total emission (Figure 4) of 18.21 g CO2-C m2 from NTnc to MPnc was presumably loss from soil, while 23.95 g CO2-C m2 from MPnc to MPwc was loss from crop residues. The chisel plow, subsoiler, sugarcane mill tiller and moldboard plow systems caused increases in emissions owing to the presence of crop residues on the surface at the time of tillage. However, the subsoiler system apparently did not affect carbon loss via soil CO2 only, as shown by the similar emissions from the NTnc and SUBnc plots (Figure 4).
The differences between NTnc and other treatment emissions in plots without crop residues on soil surface could be due to abiotic factors, just like, changes in soil moisture, soil temperature and oxidation degree could affect the decay factor of soil organic carbon. However, when emissions of CO2-C from NTnc and other treatments with crop residues were compared, a further increase, most likely contributed by only the crop residues. This result suggests that the disruption of aggregates and the contribution of labile C emissions are the same in both plots with the same tillage (Six et al., 1999; Jacinthe and Lal 2005; La Scala et al., 2008).
In general, emissions increased with soil tillage and with the presence of crop residue on the surface except under rotary tillage, where large differences in emissions from plots with or without crop residues were not observed. The persistence of crop residues in this plot indicates that they were not incorporated into the soil and/or were not sufficiently fragmented compared to other methods of tillage. These conditions account for the absence, on most days, of additional emissions due to the presence of crop residue on the surface.
Cumulative emission was higher for MPwc (67.97 g CO2-C m2) and CPwc (61.40 g CO2-C m2) and lower for NTnc (25.80 g CO2-C m2) and SUBnc (28.77 g CO2-C m2) (Figure 4). Presumably, the differences in emissions were not only due to the differing tillage treatments but also due to different effects. For example, CO2-C increase for MPnc relative to NTnc was presumably loss from SOC. In contrast, the increases in MPwc compared to MPnc or CPwc compared to CPnc are mainly due to the incorporation of crop residues and the mixing because the labile C from the breakdown of aggregates should be the same when MPnc and MPwc or CPnc and CPwc are compared. The increase of 23.95 and 17.16 g CO2-C m2 in the total emission from MPnc to MPwc and CPnc to CPwc are equivalent to 240 and 172 kg CO2-C ha1, respectively, emitted within 16 days, mainly from crop residues.
Calculated emission factors
The percentage of C loss due to emission factors associated with tillage, either from the crop residues, could be easily calculated under the same assumptions described above. Table 2 presents all the tillage emission factors after these calculations were performed. Despite the similarities in the induced emissions apparent in Figure 3, the sugarcane residues on the surface resulted in a higher percentage of CO2 loss than that induced by tillage alone. Moreover, when crop residue is incorporated to soil, not all labile C is immediately available for microbial activity because the decay of residue depends strongly on its contact with soil (Thorburn et al., 2001). This fact may explain the variation found in our results. Although the emission factors of sugarcane residues varied from 1.17 to 3.13 %, the same tillage system resulted in soil organic carbon loss from near zero (the chisel plow loss was actually negative) to 0.88 %. Thus, average emission factors of 0.345 and 2.326 % induced by tillage were associated with soil and sugarcane residues, respectively.
Relationship between emission and soil temperature and moisture
Soil temperature varied widely in our experiment (Table 3). The lowest and highest mean temperatures registered in the NTnc and HOwc plots were 20.6 and 34.3 ºC, respectively on the fi rst-year experiment. Soil temperature varied lesser during the second-year than during the first-year experiment. For example, in the NTnc plot, the mean soil temperature varied only approximately 1 ºC during the two week study. Lower mean soil temperatures of 19.7 ºC were observed in the SUBwc plot and higher ones in the RTnc (20.4 ºC); thus, soil temperature in the second-year study was lower than that in the first-year study (Table 3). For the fi rstyear experiment the lowest and highest mean soil moisture were from 7.2 and 13.1 % (m3 m3), in the CPwc and NTnc, respectively. In contrast, during the second-year experiment the soil moisture differences were much greater, with lower soil moisture (13.4 %) observed in the RTnc plot and higher (33.4 %) in the NTnc plot.
In the first-year experiment, the linear correlations of soil CO2-C emission with soil temperature and soil moisture were not significant in the NTnc, even considering that most of the emission occurred of the plots (p < 0.05). However, emissions from RTnc and SMwc plots were positively correlated with soil moisture (r = 0.84; p < 0.05), while emissions from HOwc and CPwc were negatively correlated with soil temperature (r= 0.78; p < 0.05). These observations are consistent with a significant (p < 0.10) linear correlation observed between soil CO2 emission and soil moisture in plots CPnc, SMwc, SUBwc and MPnc in the second-year experiment, while the best correlation was observed in the MPnc plot (r = 0.74; p < 0.002).
Conclusions
The presence of crop residues on the soil surface influenced the magnitude of soil CO2-C emission for some tillage systems, especially in the first four days of the study, when emissions in tilled plots were higher/lower from no-till emissions. The total emission indicates that some tillage systems could exert even negative effects on short-term soil CO2 emissions. In contrast, when sugarcane residues were present, tillage induced emissions were always positive. By taking into account the carbon contents of the sugarcane crop residues, it was possible to derive multiple tillage factors related to the separate C losses from crop residues induced by tillage.
Received August 30, 2012
Accepted June 10, 2013
- Adiku, S.G.K.; Narh, S.; Jones, J.W.; Laryea, K.B.; Dowuona, G.N. 2008. Short-term effects of crop rotation, residue management, and soil water on carbon mineralization in a tropical cropping system. Plant and Soil 311: 29-38.
- Al-Kaisi, M.M.; Yin X.H. 2005. Tillage and crop residue effects on soil carbon and carbon dioxide emission in corn-soybean rotations. Journal of Environmental Quality 34: 437-445.
- Ball-Coelho, B.; Tiessen, H.; Stewart, J.W.B.; Salcedo, I.H.; Sampaio, E.V.S.B. 1993. Residue management effects on sugarcane yield and soil properties in northeastern Brazil. Agronomy Journal 85: 1004-1008.
- Beare, M,H.; Parmelee, R.W.; Hendrix, P.F.; Cheng, W.X.; Coleman, D.C.; Crossley, D.A. 1992. Microbial and faunal interactions and effects on litter nitrogen and decomposition in agroecosystems. Ecological Monographs 62: 569-591.
- De Oliveira, M.W.; Trivelin, P.C.O.; Penatti, C.P.; Piccolo, M.C. 1999. Field decomposition and release of sugar cane trash nutrients. Pesquisa Agropecuaria Brasileira 34: 2359-2362.
- Fortin, M.C.; Rochette, P.; Pattey, E. 1996. Soil carbon dioxide fluxes from conventional and no-tillage small-grain cropping systems. Soil Science Society of America Journal 60: 1541-1547.
- Gava, G.J.D.; Trivelin, P.C.O.; Vitti, A.C.; De Oliveira, M.W. 2005. Urea and sugarcane straw nitrogen balance in a soil-sugarcane crop system. Pesquisa Agropecuaria Brasileira 40: 689-695.
- Heal, O.W.; Anderson, J.M.; Swif, M.J. 1997. Plant litter quality and decomposition: an historical overview. In: Cadish, G.; Giller, K.E., eds. Driven by nature: plant litter quality and decomposition. CAB International, Wallingford, UK.
- Jacinthe, P.A.; Lal, R. 2005. Labile carbon and methane uptake as affected by tillage intensity in a Mollisol. Soil & Tillage Research 80: 35-45.
- Kepner, J.L.; Robinson, D.H. 1988. Nonparametric methods for detecting treatment effects in repeated-measures designs. Journal of the American Statistical Association 83: 456-461.
- Lal, R. 2007. Soil science and the carbon civilization. Soil Science Society of America Journal 71: 1425-1437.
- La Scala, N.; Lopes, A.; Marques Junior, J.; Pereira, G.T. 2001. Carbon dioxide emissions after application of tillage systems for a dark red latosol in southern Brazil. Soil & Tillage Research 62: 163-166.
- La Scala, N.; Lopes, A.; Panosso, A.R.; Câmara, F.T.; Pereira, G.T. 2005. Soil CO2 efflux following rotary tillage of a tropical soil. Soil & Tillage Research 84: 222-225.
- La Scala, N.; Bolonhezi, D.; Pereira, G.T. 2006. Short-term soil CO2 emission after conventional and reduced tillage of a no-till sugar cane area in southern Brazil. Soil & Tillage Research 91: 244-248.
- La Scala, N.; Lopes, A.; Spokas, K.; Bolonhezi, D.; Archer, D.; Reicosky, D.C. 2008. Short-term temporal changes of soil carbon losses after tillage described by a first-order decay model. Soil & Tillage Research 99: 108-118.
- La Scala, N.; Lopes, A.; Spokas, K.; Archer, D.; Reicosky, D.C. 2009a. Short-term temporal changes of bare soil CO2 fluxes after tillage described by first-order decay models. European Journal of Soil Science 60: 258-264.
- La Scala, N.; Lopes, A.; Spokas, K.; Archer, D.; Reicosky, D.C. 2009b. First-order decay models to describe soil CO2-C loss after rotary tillage. Scientia Agricola 66: 650-657.
- Lokupitiya, E.; Paustian, K. 2006. Agricultural soil greenhouse gas emissions: a review of national inventory methods. Journal of Environmental Quality 35: 1413-1427.
- Oorts, K.; Merckx, R.; Grehan, E.; Labreuche, J.; Nicolardot, B. 2007. Determinants of annual fluxes of CO2 and N2O in longterm no-tillage and conventional tillage systems in northern France. Soil & Tillage Research 95: 133-148.
- Reicosky, D.C.; Lindstrom, M.J. 1993. Fall tillage method: effect on short-term carbon dioxide flux from soil. Agronomy Journal 85: 1237-1243.
- Resende, A.S.; Xavier, R.P.; Oliveira, O.C.; Urquiaga, S.; Alves, B.J.R.; Boddey, R.M. 2006. Long-term effects of pre-harvest burning and nitrogen and vinasse applications on yield of sugar cane and soil carbon and nitrogen stocks on a plantation in Pernambuco, northeastern Brazil. Plant and Soil 281: 339-351.
- Rochette, P.; Angers, D.A. 1999. Soil surface carbon dioxide fluxes induced by spring, summer and fall moldboard plowing in a sandy loam. Soil Science Society of America Journal 63: 621-628.
- Schomberg, H.H.; Steiner, J.L. 1997. Estimating crop residue decomposition coefficients using substrate-induced respiration. Soil Biology and Biochemistry 29: 1089-1097.
- Six, J.; Elliott, E.T.; Paustian, K. 1999. Aggregate and soil organic matter dynamics under conventional and no-tillage systems. Soil Science Society of America Journal 63: 1350-1358.
- Smith, W.N.; Grant, B.B.; Desjardins, R.L.; Worth, D.; Li, C.; Boles, S.H.; Huffman E, C. 2010. A tool to link agricultural activity data with the DNDC model to estimate GHG emission factors in Canada. Agriculture Ecosystems & Environment 136: 301-309.
- Soane, B.D.; Ball, B.C.; Arvidsson, J.; Basch, G.; Moreno, F.; Roger-Estrade, J. 2012. No-till in northern, western and southwestern Europe: a review of problems and opportunities for crop production and the environment. Soil & Tillage Research 118: 66-87.
- Thorburn, P.J.; Probert, M.E.; Robertson, F. A. 2001. Modelling decomposition of sugar cane surface residues with APSIM-Residue. Field Crops Research 70: 223-232.
- Zhang, H.; Wang, X.; Feng, Z.; Pang, J.; Lu, F.; Ouyang, Z.; Zheng, H.; Liu, W.; Hui, D. 2011. Soil temperature and moisture sensitivities of soil CO2 efflux before and after tillage in a wheat field of Loess Plateau, China. Journal of Environmental Sciences 23: 79-86.
Publication Dates
-
Publication in this collection
12 Sept 2013 -
Date of issue
Oct 2013
History
-
Received
30 Aug 2012 -
Accepted
10 June 2013