Abstract
Agroforestry systems are an alternative option for sustainable production management. These systems contain trees that absorb nutrients from deeper layers of the soil and leaf litter that help improve the soil quality of the rough terrain in high altitude areas, which are areas extremely susceptible to environmental degradation. The aim of this study was to characterize the stock and nutrients in litter, soil activity and the population of microorganisms in coffee (Coffea arabica L.) plantations under high altitude agroforestry systems in the semi-arid region of the state of Pernambuco, Brazil. Samples were collected from the surface litter together with soil samples taken at two depths (0-10 and 10-20 cm) from areas each subject to one of the following four treatments: agroforestry system (AS), native forest (NF), biodynamic system (BS) and coffee control (CT).The coffee plantation had been abandoned for nearly 15 years and, although there had been no management or harvesting, still contained productive coffee plants. The accumulation of litter and mean nutrient content of the litter, the soil nutrient content, microbial biomass carbon, total carbon, total nitrogen, C/N ratio, basal respiration, microbial quotient, metabolic quotient and microbial populations (total bacteria, fluorescent bacteria group, total fungi and Trichoderma spp.) were all analyzed. The systems thatwere exposed to human intervention (A and BS) differed in their chemical attributes and contained higher levels of nutrients when compared to NF and CT. BS for coffee production at high altitude can be used as a sustainable alternative in the high altitude zones of the semi-arid region in Brazil, which is an area that is highly susceptible to environmental degradation.
AGRICULTURAL MICROBIOLOGY
Agroforestry systems, nutrients in litter and microbial activity in soils cultivated with coffee at high altitude
Krystal de Alcantara Notaro; Erika Valente de Medeiros; Gustavo Pereira Duda* * Corresponding author < gpduda@gmail.com> ; Aline Oliveira Silva; Patrícia Maia de Moura
Federal Rural University of Pernambuco/Academic Unit of Garanhuns, Av. Bom Pastor, s/n 55292-270 Garanhuns, PE Brazil
ABSTRACT
Agroforestry systems are an alternative option for sustainable production management. These systems contain trees that absorb nutrients from deeper layers of the soil and leaf litter that help improve the soil quality of the rough terrain in high altitude areas, which are areas extremely susceptible to environmental degradation. The aim of this study was to characterize the stock and nutrients in litter, soil activity and the population of microorganisms in coffee (Coffea arabica L.) plantations under high altitude agroforestry systems in the semi-arid region of the state of Pernambuco, Brazil. Samples were collected from the surface litter together with soil samples taken at two depths (0-10 and 10-20 cm) from areas each subject to one of the following four treatments: agroforestry system (AS), native forest (NF), biodynamic system (BS) and coffee control (CT).The coffee plantation had been abandoned for nearly 15 years and, although there had been no management or harvesting, still contained productive coffee plants. The accumulation of litter and mean nutrient content of the litter, the soil nutrient content, microbial biomass carbon, total carbon, total nitrogen, C/N ratio, basal respiration, microbial quotient, metabolic quotient and microbial populations (total bacteria, fluorescent bacteria group, total fungi and Trichoderma spp.) were all analyzed. The systems thatwere exposed to human intervention (A and BS) differed in their chemical attributes and contained higher levels of nutrients when compared to NF and CT. BS for coffee production at high altitude can be used as a sustainable alternative in the high altitude zones of the semi-arid region in Brazil, which is an area that is highly susceptible to environmental degradation.
Introduction
Coffee (Coffea spp.) is the most popular and most consumed drink in the world (Selvamurugan et al., 2010). Coffee is the primary commodity produced by Brazil, where the majority of the coffee crop is produced under monoculture systems and full sun. However, this management practice reduces fertility, organic matter and soil yield.
Agricultural practices based on ecological principles (such as agroforestry) can combine production with conservation of the remaining fragments of natural forests (Buck et al., 2006). Agroforestry is based on principles of diversification, recycling, biological processes and the imitation of natural habitats (Lernoud, 2004), offering multiple techniques such as windbreak systems, silvopastoral, and intercropping / alley cropping, among other variations. Agroforestry can be an interesting alternative for environmental, social and economic development because it does not pollute the environment or people directly and indirectly involved, and can generate additional income for the farmer.
The litter deposition in these agroforestry systems is responsible for significant additions to the contents of organic matter (OM) of the soil (Hergoualc'ha et al., 2012; Tumwebaze et al., 2012), which might be equivalent to a forest that has experienced no human interference (Lima et al., 2010). Many benefits have been attributed to the use of agroforestry systems such as: (i) improvement of the nutrient cycle (Nair et al., 1999); (ii) increase in microbial populations and soil OM contents (Chander et al., 1998; Souza et al., 2012); (iii) reduction of the weed population (Beer et al., 1998; Sileshi et al., 2007); (iv) reduction of nutrient losses caused by turning biomass (Montagnini and Nair, 2004; Mutual et al., 2005); (v) reduction of runoff; (vi) increase of water infi ltration (Barreto et al., 2011); and (vii) reduction of erosion and nutrient input.
Because biological indicators are extremely sensitive when attempting to detect changes in soil quality, there has been a growing interest in studying and comparing the microbial attributes in agroforestry systems to other production systems (Paudel et al., 2012). The aim of this study was to characterize the stock and nutrient in litter, soil activity and population of microorganisms from coffee plantations at high altitude in different agroforestry systems in the semi-arid region of the state of Pernambuco, Brazil.
Materials and Methods
This study was conducted on agroforestry coffee growing systems and a native forest in the semi-arid region of Taquaritinga do Norte, in the state of Pernambuco, Brazil (07º54'17" S, 36º05'32" W). The region's climate is classified as CSA type, with an average temperature of 18 ºC at an altitude of 900 m. All areas were similar in terms of climate, soil type, topography and altitude. Three types of coffee production used in agroforestry coffee producing systems (agroforestry, biodynamic and coffee control) were found in the various areas, together with a native forest, that was next to the production fields which constituted a control area. The treatments were as follows:
Agroforestry or silvopastoral system (AS): This area contained 25 ha of coffee that had been cultivated in shade since 1986. Prior to this date, the cultivation of coffee had been the conventional type. The variety is the Coffea arabica typica, with a spacing of 2.5 m between plants. The plants responsible for the shading are banana (Musa paradisiaca), cashew nuts (Anacardium occidentale), legumes (Leucaena leucocephala) and trees native to the region, mostly Jurema (Mimosa tenuiflora). Some animals, such as free-roaming goats, are raised in the production fields.
Native forest (NF): This area was investigated for comparative purposes and served as the control treatment. The area was composed of deciduous forest and old trees with a closed canopy, high litter deposition. Additionally, the area was wet,extremely rugged and was free from human intervention.
Biodynamic system (BS): This area contained 8 ha of coffee in full production. It was shaded with fruit trees, such as cashew, banana and other plants, that are indigenous to Ingazeira (Inga cylindrica). The area is flatter than the other areas, had more closed canopy, and a larger amount of litter deposition. This area had also been subjected to constant application of cattle manure.
Control (CT): This relatively smooth area of the coffee plantation had been abandoned for nearly 15 years and, although there had been no management or harvesting, still contained productive coffee plants.
In each environment (AS, NF, BS, CT), three prescaled sub-areas of 100 m2 were selected, one for each repetition. In February 2010, eight soil and litter simple sub-samples were collected for each replicate and homogenized to form a composite sample for repetition. The litter samples were collected from the surface of the soil using a square of PVC that was 0.20 × 0.20 cm at each sampling point to form a composite sample. During the same sampling, the soil samples were collected at 0-10 and 10-20 cm depth. The samples were maintained at their field moist condition and stored at 4 ºC until analyzed.
The litter samples were cleaned and then dried in an oven at 65 ºC for 48 h. The samples were sieved in a 2 mm mesh. For the determination of N, P, K, Ca and Mg, 0.5 g of dry matter from each sample was dried and digested in a microwave oven using a mixture of nitric acid / hydrochloric acid (Embrapa, 2009). In the extracts, K was determined photometrically, Ca and Mg were determined by atomic absorption, and P was determined by colorimetry (Embrapa, 2009). Total organic carbon (TOC) and total nitrogen (TN) were determined through combustion at a temperature of 925 ºC in a CHNS-O elemental analyzer (Perkin Elmer PE-2400). To perform the analysis, 1 to 2 mg of litter which had already been previously dried and sieved were used. The reference standard used was acetonitrile (C = 71 %, H = 7 %, N = 10 %).
The soil samples were covered and set aside to dry. After drying, the samples were passed through a sieve of 2 mm mesh for chemical characterization in accordance with the methodology recommended by Embrapa (2009). The pH was determined in water at the ratio 1:2.5 soil: solution, the available P was determined by colorimetry after extraction with Mehlich-I, the exchangeable K was determined by flame photometry after extraction with Mehlich-I, and the exchangeable Ca, Mg and Al were extracted with 1 M KCl and determined by titrimetry as prescribed by Embrapa (2009).
To determine the microbial carbon biomass (MCB), the samples were submitted to an irradiation process. For this measurement, we adopted the method described by Vance et al. (1987) using 0.5 M K2SO4 as the extract and placed 80 mL of 0.5 M K2SO4 in 20 g of soil moisture content. The carbon in the K2SO4 extracts was determined by colorimetry (Bartlett and Ross, 1988).
The basal respiration (BRS) of the microbial population of the soil was determined by quantifying the carbon dioxide (CO2) released in the process of microbial respiration (CO2 evolution) using the alkali adsorption method with adjustments for the humidity of the soil samples to 60 % of its field capacity (Anderson and Domsch, 1985). Aliquots of 30 g were drawn from the soil samples and placed in individual airtight containers, where the CO2 produced was captured by 0.5 M NaOH. After 72 h of incubation, the amount of CO2 was quantified by titration with 0.25 M HCl, and the addition of barium chloride solution (0.05 M BaCl2) to the NaOH solution, using phenolphthalein diluted in 100 mL of ethyl alcohol (95 % v/v) as an indicator.
Total organic carbon (TOC) and total nitrogen (NT) were determined using the elemental analyzer described above. The metabolic quotient (qCO2) was calculated as the ratio between the BRS / CMB (Anderson and Domsch, 1993), and the microbial quotient (qMIC) was calculated using the CMB / TOC ratio, according to Sparling (1997). The samples underwent serial dilution to detect the microorganism populations of total bacteria (TB), fluorescent group bacteria (FGB), total fungi (TF) and Trichoderma spp. (TRI) in the soil. Plates were incubated at 25 ºC with a photoperiod of 12 h. The bacterial populations (TB and FGB) were evaluated after 24 h of incubation, whereas the TF was evaluated after 48 h of incubation.
The TRI populations were evaluated after 120 h of incubation. In each plate, colonies were quantified using a colony counter. The number of microorganisms were used in the following formula: Population = number of colonies × dilution factor × 10 with the latter representing the adjustment factor for plating 1 mL of suspension per plate and expressed as colony forming units per gram of soil (CFU g1 soil)
Data were submitted to analysis of variance and means were compared by Tukey test (p < 0.05), and principal component analysis (PCA). The original variables with the highest weight (loadings) in the linear combination of the first principal components were considered the most important. Thus, the data from the microbiological and chemical soil attributes of the four areas were compared using principal components analysis and the Statsoft data analysis software system, version 7.0 (Statistica, 2011). This analysis yielded a group that was reduced to two principal components (factors 1 and 2), identified in a two-dimensional graph, containing the original information.
Results
The areas with NF, CT and BS presented similar litter deposition values, while the AS treatment had the lowest litter value (Table 1). The content of Ca in the litter of the AS and NF treatments was higher than in the other treatments (Table 1). The content of K in the litter from NF was the lowest in relation to other treatments. The content of Mg in the litter from CT, NF and BS treatments are similar, except in areas under AS litter which d the lowest content of Mg in litter. The CT litter had lower values for P. The litter from the coffee plantations in BS and AS had higher values of P.
The content of TOC and TN were not different (p < 0.05), indicating that the areas used for the production of coffee in agroforestry systems at high altitude showed TOC and TN in quantities similar to the native forest (NF). The C/N litter ratio obtained for the AS and BS systems were similar to NF (Table 1). The pH of the soil from the different coffee producing agroforestry systems had values above 5. The only exception was the soil from NF, which had values of 4.7 and 4.3 at depths of 0-10 cm and 10-20 cm, respectively. The soils from areas subjected to AS, BS and CT treatments indicated similar pH values (Table 2).
When comparing areas, the lowest content of Al was found in soils from NF treatment. The soils collected from AS had higher levels of Na, K, Ca and P in the surface layer of the soil. There was a decrease in the Ca content in relation to depth Except for the soil in which the CT from both depths did not differ in content of Ca, the first depth demonstrated the highest levels (Table 2). In AS soils, the P content in the first depth found in the soils was 62 % higher than the level found in NF, which was considered the control treatment. With the exception of the AS area, the other areas demonstrated low values of P. This finding indicates the need to add this element as a supplement to meet the demands of the coffee plants.
The lowest levels of TOC were observed in the area with CT soil at 0-10 cm depth. Reduced TOC concentrations were observed in CT and AS soils at 10-20 cm. No differences (p < 0.05) were found for the TN variable between study areas when the depth was 0-10 cm. However, at a depth of 10-20 cm lower values of TN were observed in soils from areas with CT and AS (Table 2). There was a difference between the C/N ratio of soils in relation to the areas. The lower C/N ratio was found in the CT soil system at both depths, while the highest ratios were found in soils under NF and BS.
High values of the basal respiration of soil (BRS) and microbial carbon biomass (MCB) were observed for the soil covered with NF followed by BS (Table 3). The values in NF were followed by the values in BS, AS and CT. The highest values of BRS were also observed in the surface soil. For MCB, only the soil covered with NF and AS contained higher values of this attribute in the surface soil (Table 3). Higher qCO2 were observed in the NF and BS soils. The area with CT had the lowest qCO2 value. The lowest qMIC was found in BS soils at 0-10cm depth, differing from other areas in which they were similar. These results show that in BS soils there is a lower microbial activity, as observed for the MCB and qCO2.
TB and TRI population densities at the depth of 0-10 cm were higher in the soil from the coffee plantations in the BS system, with averages of 8.1 × 10⁶ and 3.7 × 10⁵ CFU g1 soil (Table 3). The soils of the CT and BS systems presented similar populations of TB at 0-10 cm depth. High variability was observed in the TF populations, and the treatment indicated a lower population of these microorganisms in the BS soil and a larger population in the NF treatment. Compared to the 10-20 cm depth, there was a decrease in the populations of TF and BFG at 0-10 cm depth (Table 3).
The correlation matrix of biological and chemical variables of soils under different cropping systems of organic coffee at altitude showed high significant correlation coefficients (Table 4). There was increased microbial activity (BRS) with increased total carbon levels. The aluminum levels influenced BRS, MCB and TF at 0-10 cm depth negatively.
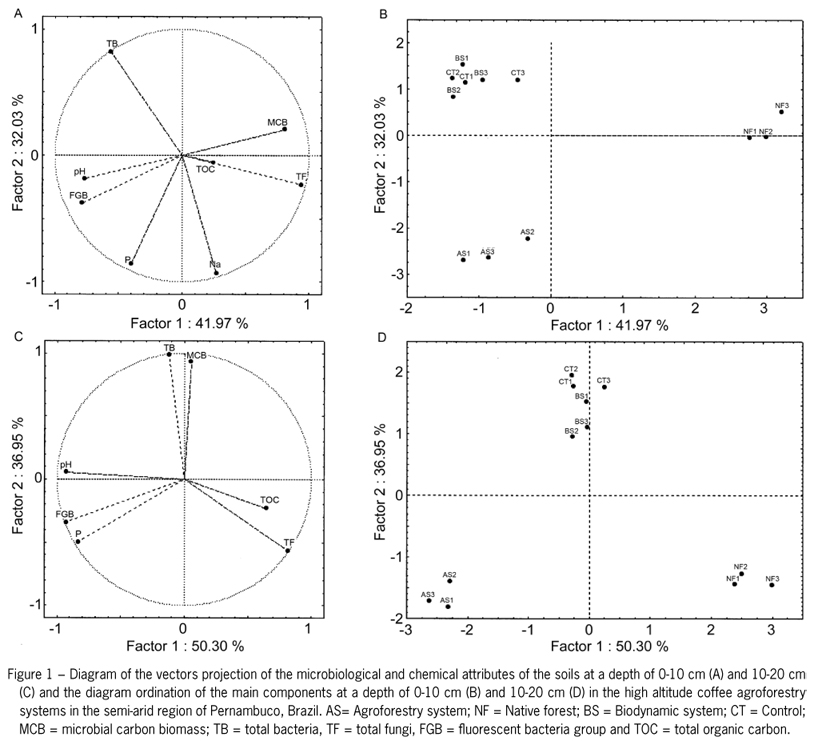
To make a distinction between the treatments, principal components were generated (Factor 1 and Factor 2) for the chemical (Na, P and pH) and microbial attributes of the soil (TOC, MCB, TB, TF, and FGB) at depths of 0-10 cm and 10-20 cm. Diagrams were generated for the projection vectors to demonstrate the soil attributes that most influence the distinction between the types of shade coffee production in agroforestry systems. Moreover, sorting diagrams that distinguished the three groups of treatments (as confirmed at two depths) were plotted from the relationship between these components (Figures 1B and 1D).
The PCA considered the first two factors with a cumulative value of 72 % for the chemical and microbial attributes of the soil at a depth of 0-10 cm and 87 % at a depth of 10-20 cm. For the data from a depth of 0-10 cm,factor 1 explained 42 % of the total variation of the microbiological and chemical attributes. The variables TB, MCB, TF, Na and P, which had the highest correlation coefficients (Table 5), are considered the most sensitive for distinguishing the types of agroforestry systems used in coffee production. However, these variables can also be observed in the vector diagram, where the variables are closer to the axis of this factor (Figure 1A).
32 % of the factor 2 variance was explained by the variables FGB, pH and TOC indicating the highest correlations with this factor (Figure 1A and Table 5). At the 10-20 cm depth, the variables that correlated significantly with factor 1 were TF, FGB, Na, TB and pH, which explained 50 %. For factor 2, the variables MCB, TOC and P explained 37 % of the variation (Figure 1C).
At a depth of 0-10 cm, the variables MCB, TB and P demonstrated positive correlation with factor 1 (Table 5), which indicates that their average values increased from left to right on the graph (Figure 1B) and that there was negative correlation between the TF and Na variables. Because the TB variable was positively correlated with factor 2, their average values increased ascending from the lower part of the graph and demonstrated negative correlation with FGB and pH. At the 10-20 cm depth, the variables that were highly correlated with factor 1 were TF and C (the mean values increased when going from left to right on the graph). MCB and TB (mean values increased ascending the graph) were highly correlated with factor 2 (Figure 1D).
The microbiological and chemical attributes used in PCA showed differences between the types of organic coffee production in agroforestry systems and native forest soil. Soils under BS and CT showed similar characteristics and adjusted in the same quadrant at both 0-10 and 10-20 depth, differing from soils under NF.
Discussion
The stock of the litter was greatest in the NF, CT and BS (Table 1). These results demonstrate the similarity between the areas studied. Soils cultivated with high altitude coffee under the shade of fruit trees or forest species result in high additions of soil OM, making this an important practice for maintaining high levels of soil carbon, improving the soil fertility and soil microbial activity. Hergoualc'ha et al. (2012) found higher carbon stock using agroforestry systems with Inga trees to that found in coffee monoculture. In general, the conversion of forest systems to agricultural systems results in a decline of litter and consequently soil organic carbon. However, according to the results obtained by Tumwebaze et al. (2012) and this study, an agroforestry system retains soil carbon stock.
The values of the litter are high when compared to other studies. The litter stocks of this study are higher than the litter stocks found by Lima et al. (2010), who, analyzing areas with agroforestry systems six and ten years after planting, in three-year old ecological based systems, slash-and-burn agriculture and native forest, localized in Esperantina (03º54' S; 42º14' W), in the state of Piauí, Brazil, and obtained an estimated annual litter fall of 9.3 t ha1 in agroforestry area after ten years. This result is associated with the samples taken at the end of the dry period, which provides a greater leaf fall because of the physiological characteristics of the plant species in these areas and the water deficit (Martins and Rodrigues, 1999).
The content of the nutrients in the litter varied among the types of coverage highlighting the area covered by BS and NF. In these areas, larger quantities of K, N, Ca, Mg and P were found. Lima et al. (2010) observed a higher contribution of N, P, K, Ca and Mg in an agroforestry system with ten years of implantation than in the native forest. This contribution surpassed the values of the native forest, which demonstrated the importance of the agroforestry system. Leaves from the leguminous trees could be the main source of organic N in the soil (Mamani-Pati et al., 2012). However, a similar result was not observed in this study. Compared to the other areas, NF had higher values for the content of Ca, Mg and N. The lowest values found were for K and P. Thus, all of the areas demonstrated similar levels of nutrient accumulation.
The low amount of P found in the litter is most likely related to the mobility of the senescent tissues when retranslocated to other parts of the plant. The litter can act as a sink of nutrients, which reduces its content in the leaves (Salisbury and Ross, 1992). In the litter of all of the coffee production systems, the contents of Ca, Mg, K and N, which can be a source of nutrients to the culture after they are mineralized, were high. The content of P in the litter was very low, which suggests that this element is limiting in all of the systems evaluated.
When compared to the other types of coverage, the soil pH was lower in the soil covered with NF. This lower pH might be associated with the failure to not use a corrective for acidity in the soil covered with NF. This result is confirmed by the other areas that received a corrective for acidity. These areas had higher pH values, as well as higher values of Ca and Mg. As for K, the highest levels observed might be associated with the application of potassium fertilizers. As observed by Salgado et al. (2006), the K, Ca and Mg in the soil covered with CT, BS and AS are generally at levels suitable for the growth of the plants as observed.
Only the land covered with the AS system had adequate levels of P for plant growth, probably due to addition of P fertilizer. This result is again in agreement with the findings of Salgado et al. (2006). Generally, the increased availability of P in agroforestry systems is associated with falling leaves of plants as observed by Nigussie and Kissi (2012).
The low values of P in the soil and litter indicate that this is the main limiting element in all of the systems evaluated. Thus, the soil provides little P to the soil plants used in agroforestry systems. Additionally, the plants in the agroforestry systems returned a low litter result for P. Despite the low levels of available P in the soil and litter, when the high levels of TOC and Ca are taken into account, the occurrence of Al complexed with organic molecules is possible because the levels of organic P in these systems are high.
The content of TOC in the NF areas was not different among AS, BS (Table 2). This was different from that observed by Souza et al. (2012) in a coffee agroforestry system in the Atlantic Rainforest biome, where the TOC was higher in the soil in forests than in the soil under coffee systems in Brazil. This result was also observed in other studies that compared coffee producing agroforestry systems in Indonesia (Hairiah et al., 2006) to the content of TOC in Brazil (Maia et al., 2007).
Although the agroforestry systems are similar to the NF in terms of altitude and the steepness of the terrain and climatic conditions, an evaluation in this study of the degree of similarity of the soil quality between these hedges was not possible for TOC. This evaluation was impossible because the canopy formation was influenced by human involvement in the introduction of fruit trees for commercial interests and because of the introduction of coffee, which caused the amount of TOC lost in relation to NF. NF also had a larger stock of litter, which contributes to the greater stability of organic matter in undisturbed soil (Kaur et al., 2000).
The soil covered with NF that was evaluated at both depths indicated higher values of BRS and MCB in these areas. This finding indicates that there is a greater loss of CO2 by microbial activity when compared to the other areas. This loss of CO2 might be associated with higher levels of TOC, which has a great influence on microbial activity. Moreover, The MCB is vital for the maintenance of soil quality because it is responsible for the dynamics of the organic carbon (Dinesh et al., 2003).
Losses in concentration of TOC, MCB, BRS, TF and FGB in systems similar to NF (but which had been subjected to human intervention as in the AS, BS and SB systems) indicate that the detecting sensitivity of these traits varies according to the type of use of soils (Stenberg, 1999). This difficulty might occur because the soil use type interferes with the dynamics of the soil organic matter and the nutrient cycling processes in the decomposition of soils (Acosta-Martinez et al., 2008).
The qCO2 values in the soils from the NF, BS and AS areas were higher than in the CT area, which indicates that the mineralization activity of the soil organic carbon was higher in these areas. The higher values of qCO2 indicate higher stress conditions and a higher loss of CO2 per unit of microbial biomass in the systems. As observed in the agricultural crops (Silva et al., 2007), when compared to the native forestry, the higher levels of qCO2 are generally observed in systems that suffer from human intervention. However, in the case of this study, the greater supply of organic matter might favor a higher population of bacteria, which quickly attacks the organic substrate and accelerates the process of biological oxidation (Zibilske et al., 2002).
The variables most sensitive to the detection differences in the treatments at a depth of 0-10 cm and 10-20 cm were MCB, TOC, TB, TF, FGB, Na, pH and P. All of these variables were reduced to two factors (Factor 1 and Factor 2). Experiments with the first two factors have been performed in studies that evaluate the microbial quality of the soil (García-Ruiz et al., 2008; Gardner et al., 2011).
The importance of each variable in each principal component is indicated by the value of the modular weight, which identifies the variables that are correlated with each principal component. Thus, the data from a soil depth of 0-10 cm were the most important factor. For factor 1, the order of importance was as follows: TB> MCB > TF > Na > P. For factor 2, the order of importance was FGB > pH > TOC. At the 10-20 cm depth, the most important variables for factor 1 were as follows: TF = FGB > Na > TB > pH. For factor 2, the most important variables were TOC > MCB = P. Many authors have used principal components analysis and have also highlighted the importance of the TOC and MCB variables to explain the total variance of the treatments (Wick et al., 1998).
The BS system is similar to NF when evaluating production and nutrient content of litter. The systems that were exposed to human intervention (AS and BS) differed in their chemical attributes and had higher levels of nutrients when compared to NF and CT. The activity and microbial populations were higher in NF soils, followed by BS soils indicating that a soil microbial and chemical quality of BS is greater than or similar to NF. Biodynamic systems for coffee production at high altitude can be used as a sustainable alternative at high altitude in the semiarid region of Pernambuco, Brazil, which are areas that are highly susceptible to environmental degradation.
Received June 07, 2012
Accepted November 14, 2013
Edited by: José Miguel Reichert / Luís Reynaldo Ferracciú Alleoni
- Acosta-Martinéz, V.; Acosta-Mercado, D.; Sotomayor-Ramírez, D.; Cruz-Rodríguez, L. 2008. Microbial communities and enzymatic activities under different management in semiarid soils. Applied Soil Ecology 38: 249-260.
- Anderson, T.H.; Domsch, K.H. 1985. Determination of ecophysiological maintenance carbon requirements of soil microorganisms in a dormant state. Biology and Fertility 1: 81-89.
- Anderson, T.H.; Domsch, K.H. 1993. The metabolic quotient for CO2 (qCO2) as a specific activity parameter to assess the effects of environmental conditions such as pH on the microbial biomass of forest soils. Soil Biology and Biochemistry 25: 393-395.
- Barreto, P.A.B.; Gama-Rodrigues, E.F.; Gama-Rodrigues, A.C.; Fontes, A.G.; Polidoro, J.C.; Moço, M.K.S.; Machado, R.C.R.; Baligar, V.C. 2011. Distribution of oxidizable organic C fractions in soils under cacao agroforestry systems in Southern Bahia, Brazil. Agroforestry Systems 81: 213-220.
- Bartlett, R.J.; Ross, D.S. 1988. Colorimetric determination of oxidizable carbon in acid soil solutions. Soil Science Society America Journal 52: 1191-1192.
- Beer, J.; Muschler, R.; Kass, D.; Somarriba, E. 1998. Shade management in coffee and cacao plantations. Agroforestry Systems 38: 139-164.
- Buck, L.E.; Milder, J.C.; Gavin, T.A.; Mukherjee, I. 2006. Understanding Ecoagriculture: A Framework for Measuring Landscape Performance. Department of Natural Resources, Cornell University, Ithaca, USA.
- Chander, K.; Goyal, S.; Nandal, D.P.; Kapoor, K.K. 1998. Soil organic matter. microbial biomass and enzyme activities in a tropical agroforestry system. Biology and Fertility of Soils 27: 168-172.
- Dinesh, R.; Ghoshal Chaudhuri, S.; Ganeshamurthy, A.N.; Dey, C. 2003. Changes in soil microbial indices and their relationships following deforestation and cultivation in wet tropical forests. Applied Soil Ecology 24: 1726.
- Empresa Brasileira de Pesquisa Agropecuária [EMBRAPA]. 2009. Manual of Soil Chemical, Plants and Fertilizers Analysis. = Manual de Análises Químicas de solos, Plantas e Fertilizantes. Embrapa, Brasília, DF, Brazil (in Portuguese).
- García-Ruiz, R.; Ochoa, V.; Hinojosa, M.B.; Carreira, J.A. 2008. Suitability of enzyme activities for the monitoring of soil quality improvement in organic agricultural systems. Soil Biology and Biochemistry 40: 2137-2145.
- Gardner, T.; Acosta-Martínez, V.; Senwo, Z.; Dowd, S.E. 2011. Soil rhizosphere microbial communities and enzyme activities under organic farming in Alabama. Diversity 3: 308-328.
- Hairiah, K.; Sulistyani, H.; Suprayogo, D.W.; Purnomosidhi, P.; Widodo, R.H.; Noordwijk, M.V. 2006. Litter layer residence time in forest and coffee agroforestry systems in Sumberjaya, West Lampung. Forest Ecology and Management 224: 45-57.
- Hergoualc'ha, K.; Blanchartd, E.; Skibae, U.; Hénaultf, C.; Harmanda, J.M. 2012. Changes in carbon stock and greenhouse gas balance in a coffee (Coffea arabica) monoculture versus an agroforestry system with Inga densiflora, in Costa Rica. Agriculture, Ecosystems & Environment 15: 102-110.
- Kaur, B.; Gupta, S.R.; Singh, G. 2000. Soil carbon, microbial activity and nitrogen availability in agroforestry systems on moderately alkaline soils in Northern India. Applied Soil Ecology 15: 283-294.
- Lernoud, A.P.; Piovano, M. 2004. Latin America: country reports. p. 132-147. In: Willer. H.; Yussefi. M., eds. The world of organic agriculture: statistics and emerging trends. IFOAM, Bonn, Germany.
- Lima, S.S.; Leite, L.F.C.; Aquino, A.M.; Oliveira, F.C.; Castro, A.A.J.F. 2010. Litter and nutrient contents in argisol under different managements in northern Piauí. Revista Árvore 34: 75-84 (in Portuguese, with abstract in English).
- Maia, S.M.F.; Xavier, F.A.S.; Oliveira, T.S.; Mendonça, E.S.; Araújo Filho, J.A. 2007. Organic carbon pools in a Luvisol under agroforestry and conventional farming systems in the semi-arid region of Ceará, Brazil. Agroforestry Systems 71: 127-138.
- Mamani-Pati, F.; Clay, D.E.; Clay, S.A.; Smeltekop, H.; Yujra-Callata, M.A. 2012. The influence of strata on the nutrient recycling within a tropical certified organic coffee production system. ISRN Agronomy, Article ID 389290. DOI 10.5402/2012/389290
- Martins, S.V.; Rodrigues, R.R. 1999. Production of litter in a seasonal forest clearings semideciduous in Campinas, SP. Revista Brasileira de Botânica 22: 405-412.
- Montagnini, F.; Nair, P.K.R. 2004. Carbon sequestration: an underexploited environmental benefit of agroforestry systems. Agroforestry Systems 61: 281-295.
- Mutual, P.K.; Cadisch, G.; Albrecht, A.; Palm, C.A.; Verchot, L. 2005. Potential of agroforestry for carbon sequestration and mitigation of greenhouse gas emissions from soils in the tropics. Nutrient Cycling Agroecosystems 71: 43-54.
- Nair, P.K.R.; Buresh, R.J; Mugendi, D.N.; Latt, C.R. 1999. Nutrient cycling in tropical agroforestry systems: myths and science. p. 1-31. In: Buck, L.E.; Lassoie, J.P.; Fernandes, E.C.M., eds. Agroforestry in sustainable agricultural systems. CRC Press, Boca Raton, FL, USA.
- Nigussie, A.; Kissi, E. 2012. The contribution of coffee agroecosystem to soil fertility in Southwestern Ethiopia. African Journal of Agricultural Research 7: 74-81.
- Paudel, B.R.; Udawatta, R.P.; Kremer, R.J.; Anderson, S.H.; 2012. Soil quality indicator responses to row crop, grazed pasture, and agroforestry buffer management. Agroforestry Systems 84: 311-323.
- Salgado, B.G.; Macedo, R.L.G.; Alvarenga, M.I.N.; Venturin, N. 2006. Evaluation of soil fertility in agroforest systems with coffee trees (Coffea arabica L.) in Lavras, MG. Revista Árvore 30: 343-349 (in Portuguese, with abstract in English).
- Salisbury, F.B.; Ross, C.W. 1992. Plant Physiology. 4ed. Wadsworth, Belmont, CA, USA.
- Selvamurugan, M.; Doraisamy, P.; Maheswari, M. 2010. An integrated treatment system for coffee processing wastewater using anaerobic and aerobic process. Ecological Engineering 36: 1686-1690.
- Silva, R.F.; Tomazi, M.; Pezarico, C.R.; Aquino, A.M.; Mercante, F.M. 2007. Edaphic invertebrate macrofauna in cassava cultivation under vegetable cover crops. Pesquisa Agropecuária Brasileira 42: 865-871 (in Portuguese, with abstract in English).
- Sileshi, G.; Schroth, G.; Rao, M.R.; Girma, H. 2007. Weeds, diseases, insect pests, and tri-trophic interactions in tropical agroforestry. p. 73-94. In: Batish, D.R.; Kohli, R.K.; Jose, S.; Singh, H.P., eds. Ecological basis of agroforestry. CRC Press, Boca Raton, FL, USA.
- Souza, H.N.D.; de Goede, R.G.; Brussaard, L.; Cardoso, I.M.; Duarte, E.M.; Fernandes, R.B.A.; Pulleman, M.M. 2012. Protective shade, tree diversity and soil properties in coffee agroforestry systems in the Atlantic rainforest biome. Agriculture, Ecosystems & Environment 146: 179-196.
- Sparling, G.P. 1997. Soil microbial biomass: activity and nutrient cycling as indicators of soil health. p. 97-120. In: Pankhurst, C.; Doube, B.M.; Gupta, V.V.S.R., eds. Biological indicators of soil health, CAB International, Wallingford, UK.
- Stenberg, B. 1999. Monitoring soil quality of arable land: microbiological indicators. Acta Agriculturae Scandinavica 49: 1-24.
- Tumwebaze, S.B.; Bevilacqua, E.; Briggs, R.; Volk, T. 2012. Soil organic carbon under a linear simultaneous agroforestry system in Uganda. Agroforestry Systems 80: 1-13.
- Vance, E.D.; Brooks, P.C.; Jenkinson, D.S. 1987. An extraction method for measuring soil microbial biomass C. Soil Biology and Biochemistry 19: 703-707.
- Wick, B.; Kühne, R.F.; Vlek, P.L.G. 1998. Soil microbiological parameters as indicators of soil quality under improved fallow management systems in Southwestern Nigeria. Plant and Soil 202: 97-107.
- Zibilske, L.M.; Bradord, J.M.; Smart, J.R. 2002. Conservation tillage induced changes in organic carbon, total nitrogen and available phosphorus in a semi-arid alkaline subtropical soil. Soil and Tillage Research 66: 153-163.
Publication Dates
-
Publication in this collection
14 Apr 2014 -
Date of issue
Apr 2014
History
-
Received
07 June 2012 -
Accepted
14 Nov 2013