Abstract
Solum depth and its spatial distribution play an important role in different types of environmental studies. Several approaches have been used for fitting quantitative relationships between soil properties and their environment in order to predict them spatially. This work aimed to present the steps required for solum depth spatial prediction from knowledge-based digital soil mapping, comparing the prediction to the conventional soil mapping approach through field validation, in a watershed located at Mantiqueira Range region, in the state of Minas Gerais, Brazil. Conventional soil mapping had aerial photo-interpretation as a basis. The knowledge-based digital soil mapping applied fuzzy logic and similarity vectors in an expert system. The knowledge-based digital soil mapping approach showed the advantages over the conventional soil mapping approach by applying the field expert-knowledge in order to enhance the quality of final results, predicting solum depth with suited accuracy in a continuous way, making the soil-landscape relationship explicit.
soil survey; fuzzy logic; similarity vectors
SOILS AND PLANT NUTRITION
Solum depth spatial prediction comparing conventional with knowledge-based digital soil mapping approaches
Michele Duarte de MenezesI; Sérgio Henrique Godinho SilvaII; Carlos Rogério de MelloIII; Phillip Ray OwensIV; Nilton CuriII,* * Corresponding author < niltcuri@dcs.ufla.br>
IFederal Rural University of Rio de Janeiro - Soil Dept., BR 465, km 7 - 23890-000 - Seropédica, RJ - Brazil
IIFederal University of Lavras - Soil Science Dept., C.P. 3037 - 37200-000 - Lavras, MG - Brazil
IIIFederal University of Lavras - Engineering Dept
IVPurdue University - Dept. of Agronomy, Lilly Hall of Life Sciences, 915 W. State Street - 47906 - West Lafayette, IN - USA
ABSTRACT
Solum depth and its spatial distribution play an important role in different types of environmental studies. Several approaches have been used for fitting quantitative relationships between soil properties and their environment in order to predict them spatially. This work aimed to present the steps required for solum depth spatial prediction from knowledge-based digital soil mapping, comparing the prediction to the conventional soil mapping approach through field validation, in a watershed located at Mantiqueira Range region, in the state of Minas Gerais, Brazil. Conventional soil mapping had aerial photo-interpretation as a basis. The knowledge-based digital soil mapping applied fuzzy logic and similarity vectors in an expert system. The knowledge-based digital soil mapping approach showed the advantages over the conventional soil mapping approach by applying the field expert-knowledge in order to enhance the quality of final results, predicting solum depth with suited accuracy in a continuous way, making the soil-landscape relationship explicit.
Keywords: soil survey, fuzzy logic, similarity vectors
Introduction
Solum depth (A+B horizon) has been applied in distributed hydro-ecological models to simulate watershed processes as net photosynthesis and stream flow (Quinn et al., 2005; Zhu and McKay, 2001), affecting the soil storage capacity (Follain et al., 2007) or the soil drainage condition (Odeh et al., 1995). Solum depth is strongly linked to landscape characteristics and it is important for soil mapping (Chartin et al., 2011), and land use planning and management.
Several approaches have been used for fitting quantitative relationships between soil types and/or properties and their environment in order to predict their spatial distribution and variability (spatial inference models) (McBratney et al., 2003). Such models are divided into data-driven (Pedometric approach) and knowledge-driven (Shi et al., 2009). The pedometric approach (statistic and geostatistic) gives a predictive accuracy that is generally related to a dense sampling scheme, which is not always feasible due to cost and time constraints (Zhu and Lin, 2010).
Zhu and Band (1994) and Zhu (1997) presented an alternative approach based on limited observations per soil class, using fuzzy logic and similarity vectors, in an expert system. Possessing the maps that represent soil forming factors (environmental variables), the knowledge of pedologists can be incorporated into spatial prediction, whereby the qualitative soil-landscape model is converted into quantitative predictions using relationships between soils and, more frequently, terrain attributes, such as slope, topographic wetness index, and profile curvature. It overcomes a limitation of the conventional soil mapping approach, as raised by Hudson (1992), which fails to highlight the soil surveyor mental model. Because this approach requires an understanding from a soil scientist's perspective of the repeating soil patterns on the landscape, as does the conventional mapping approach, it is considered to be a knowledge-driven digital soil mapping approach and it has been regarded as efficient and economical (Hudson, 1992; MacMillan et al., 2007).
This study aimed to present the steps required for solum depth spatial prediction from knowledge-based digital soil mapping, comparing it to the conventional soil mapping approach through field validation, in a watershed located at Mantiqueira Range region, in the state of Minas Gerais, Brazil.
Materials and Methods
Study area characterization
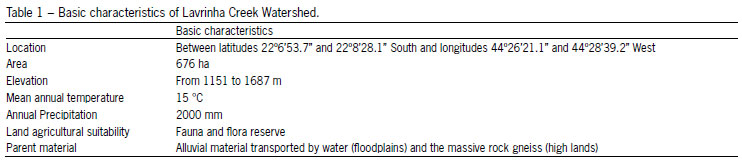
This study was carried out at Lavrinha Creek Watershed located at Mantiqueira Range, in the south of the state of Minas Gerais, Brazil (Figure 1). It is a typical headwater watershed, representative of the Alto Rio Grande Basin, an important hydrological region, due to its potential for generating electricity in the form of hydroeletric energy. There is a predominance of dense rain forest, with high slope gradients and few roads, which, together, hinder access and traffic in the area. The main characteristics of the study site are presented in Table 1.
Conventional soil mapping approach
The photo-interpretation of the watershed was performed using a stereoscope, with vertical panchromatic aerial photography on a scale of approximately 1:35,000. Physiographically, homogeneous areas were separated, which formed the basis of the preliminary mapping units. This map was further tuned in the field. The correlation between map units and landform features were verified and boundaries were redrawn when necessary. This study helped to select representative sites for describing soil profiles and making prospections. After the photo interpretation procedure, the landform map was digitalized and displayed in the Geographic Information Systems (GIS) environment in which places easily identified in the photo and in the Brazilian Statistics and Geography Institute's (IBGE) maps were used for georeferencing the landform maps. With regard to solum depth, each soil map unit assumes a unique value based on the soil profile described, which represents the central or modal concept for that soil map unit.
Knowledge-based digital soil mapping approach
The steps required to predict solum depth were, for the most part, implemented using ArcSIE (Soil Inference Engine) version 9.2.402, a toolbox that functions as an ArcMap extension (Shi et al., 2009). ArcSIE was designed for creating soil maps using fuzzy logic and supports the knowledge-based approach to establishing relationships between the soil and its environment, providing tools for soil scientists to formalize the relationship based on pedological knowledge of the local soils. A knowledge-based digital soil mapping is performed according to existing relationships between soil attributes and landforms. The landforms can be obtained from Digital Elevation Model (DEM) derivatives that create the Digital Terrain Models (DTMs) in a GIS environment. From DTMs and pedological information, soil-landscape relationships can be used for extrapolating information for non-sampled places through mapping techniques (fuzzy logic and similarity vectors) (Zhu, 1997). In order to predict the solum depth, the following steps were taken:
i) Establishing soil-landscape relationships to predict soil classes: this step was the basis for setting rules and was based on soil scientists' knowledge, maps from previous soil surveys and other types of soil research developed at the study site. Considering the soil-landscape relationships at LCW, the alteration of gneiss resulted in the predominance of Udepts (moderately developed and well-drained soils) (US Soil Taxonomy - Soil Survey Staff, 1999). The relief is steep with concave-convex slopes, dominated by linear pedoforms and narrow floodplains. Hydromorphic soils occupy the toeslope areas, where the water table is near to the surface for most of the year.
ii) Quantifying relationships between soils and terrain attributes and formalizing these relationships in a set of rules: analogous to a DEM, DTMs are identified in an ordered array of numbers that represents the spatial distribution of terrain attributes across a landscape, in a raster-based format. Terrain models were based on a 30 m resolution DEM, generated from the Brazilian source of contour lines in 1:50,000 scale (IBGE, 1973). The sinks were filled and a hydrologically consistent DEM was created using ArcGIS version 10.0. The System for Automated Geoscientific Analysis (SAGA) (Böhner et al., 2006), version 2.0.8, ArcMap spatial analyst and ArcMap extension Soil Inference Engine (Arc-SIE), version 9.2.402 were used to calculate the terrain attributes from DEM.
The following primary (calculated directly from DEM) and secondary (calculated from the combination of two or more primary terrain attributes) terrain attributes were derived from DEM:
Primary: slope is the gradient of elevation. Profile curvature is the slope shape in the direction of the maximum slope and is, therefore, important for water flow. Plan curvature is the slope shape perpendicular to the slope direction, which measures the convergence or divergence and, hence, the concentration of water in a landscape (Moore et al., 1993);
Secondary: SAGA wetness index (WI) was used instead of the well-known topographic wetness index (ln(a/ tanβ)), where a = the ratio of upslope contributing area per unit contour length and β = the tangent of the local slope). Both wetness indexes are similar; however, in SAGA it is possible to adjust the width and convergence of the WI multidirectional flow to single directional flow. Large WI values indicate an increased likelihood of saturated conditions and are usually found in lower-lying parts and convergent hollow areas and soils with small hydraulic conductivity or areas of gentle slope (Beven and Wood, 1983). These indexes have been used to identify water flow characteristics in landscapes (Sumfleth and Duttmann, 2008).
Soil-landscape relationships were qualitatively modeled using DTMs, based on the terrain attributes that represent soil and hydrologic processes. Next, a qualitative soil landscape model from step a) was used to quantify soil-landscape relationships on a continuous basis, based on terrain attributes and their histogram distribution values. For the development of the model, a set of rules for the entire watershed was created for each soil map unit (step a) and applied in ArcSIE in order to create a soil map for the entire watershed. ArcSIE provides different types of knowledge integration. In this study, rule-based reasoning was applied allowing for the covering of the entire mapping area (Shi et al., 2009).
The soil-landscape relationships were extracted and the characterized environmental conditions were linked through a set of inference techniques to populate the similarity model for the area (Zhu and MacKay, 2001). The terrain attribute values and ranges associated with each soil map class were used to define membership or optimality functions (curves), which, in turn, define the relationship between the values of an environmental feature and soil type. The initial output from the inference is a series of fuzzy membership maps in raster format, one for each soil type under consideration (Shi et al., 2009). The fuzzy membership values represent the similarities of each pixel in the landscape to the soil types. Then, these fuzzy membership maps are combined into one final soil class map, in which only the soils with the highest membership are assigned to that pixel.
iii) Creating soil property map (solum depth): after creating the soil class map, the soil property map (solum depth) can be created. This technique allows for the prediction in a continuous way of any soil property that shows a recognizable relationship with the terrain attribute or landscaping position. Based on fuzzy membership values, the continuous variation of soils can be represented by continuous solum depth derived from the similarity vectors, using the following formula (Zhu et al., 1997):

where: Vij is the estimated solum depth at location (i,j), Vk is a typical value of soil type k (e.g. Udepts), and n is the total number of prescribed soil classes for the area. The typical value consists of the central concept of the soil type, and corresponds to those same soil profiles used in the conventional soil mapping approach. If the local soil formative environment characterized by a GIS resembles the environment of a given soil category (solum depth), then property values of the local soil should resemble the property values of the candidate soil type. The resemblance between the environment for soil at (i,j) and the environment for soil type k is expressed by  , which is used as an index to measure the level of resemblance between the soil property values of the local soil and soil category (Zhu et al., 2001). The property value can be any property that shows a recognizable pattern or relationship with the terrain attribute or landscape position. The higher the membership of a local soil in a given soil type, the closer the property values (solum depth) will be at that location to typical property values (Zhu et al., 2010).
Based on the five soil class map units established in step i) and the resulting fuzzy membership map in step ii) measured solum depth values from the five soil profiles were assigned to their respective fuzzy soil membership maps.
Assessment of accuracy of solum depth prediction
A set of data containing the solum depth information was obtained for assessing the accuracy of solum depth maps (conventional and digital). In order to compare the solum depth information (real vs. estimated) contained in both maps, R2, R2adj, mean error (ME) and root mean square error (RMSE) were calculated using R software (R Development Core Team). ME and RMSE have the formulas below:

where: n is the number of observations, ei is the estimated value of the solum depth and mi is the measured value of the solum depth.
Results and Discussion
Conventional soil survey
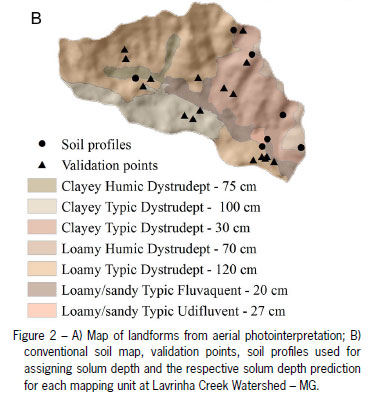
The map of landforms (Figure 2A) was the basis for creating the soil class map (Figure 2B). The following landforms were identified: convex hills, ravined hills, steep slopes, alluvial plains, and embedded valley. The relief played an important role in soil distribution, since it is the only varying factor in the study area out of the five soil forming factors (Jenny, 1941). The removal of soil through geologic erosion from the steepest portions of relief and material accumulation by alluvial addition in floodplains explain the spatial variability of Udepts in the first case, and Fluvents and Acquents in the second case. Figure 2B shows the soil profiles used for assigning solum depth and the validation points for comparing conventional and digital knowledge-based solum depth maps.
The conventional soil map has only one solum depth assigned to each soil polygon map unit from soil profile, and does not necessarily reflect the variability and continuous nature of solum depth in and between soil polygon map units. The polygon model assumes a discrete distribution with definite boundaries, in which spatial generalization occurs due to scale limitations. According to the soil survey scale, delineations, smaller than the minimum mappable area, are included in larger polygons and their actual spatial locations are lost (Zhu, 1997). The polygon represents only the distribution of a set of prescribed soil classes (central concepts of the soil), and other minor soil classes/minor components are not spatially represented. Pedologists know that there are local soils that differ from the central concepts of the assigned class, but this expert knowledge cannot be conveyed using polygon-based soil mapping (Zhu et al., 2001). This procedure results in a simplification of a solum depth mapping and loss of information.
Knowledge-based digital soil mapping
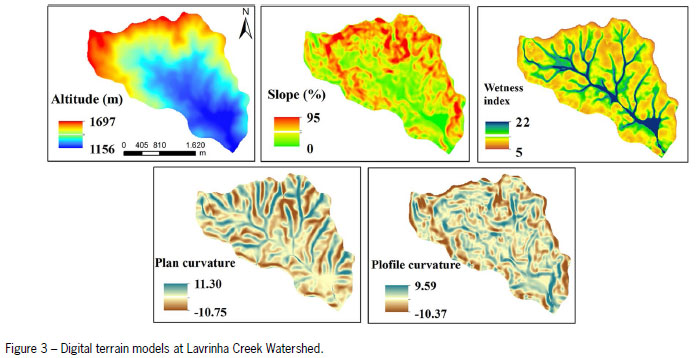
The DTMs used in the prediction are presented in Figure 3. These models numerically describe the surface form as a continuum, which is more appropriate for the representation of geographic features than the discrete polygon model. According to Zhu (1997), pixel-based maps minimize the discrepancies between the spatial resolution of soil spatial information and environmental data (in this case, relief).
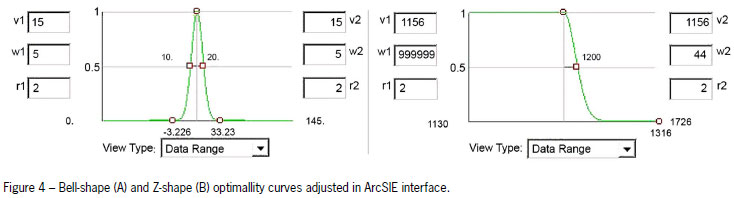
The ranges and curve shapes (Table 2) that define the modal soil types were adjusted using DTMs. This table represents information on optimality curves that describe quantitatively the relationships between soil type and a particular DTM (Zhu et al., 1997). It overcomes a limitation of conventional soil mapping approach, as described by Hudson (1992), which is the failure to represent the soil surveyor mental model. Figure 4 shows two examples of curve shapes used in this study. For the bell-shape (a), the optimality value decreases as the difference between the environmental feature value and the central values (v1 and v2) increases. For example, in Table 2, for classifying any place in the landscape as clayey Typic Dystrudept, the optimal (central) slope value to receive 100 % membership is 15 and the curve shape is a bell, which indicates that as slope values decrease from 15 to 10 or increase to 20 the pixels will receive membership values decreasing from 100 to 50 %, the latter being, therefore, less characteristic for clayey Typic Dystrudept to occur (Figure 4A). On the other hand, the Z-shaped or the-lower-the-better shaped curve defines that all the values inferior to the central one will correspond to 100 % membership. In Table 2, this curve type is used to define the typical conditions for loamy/ sandy Typic Udifluvent occurrence. The full membership altitude value was identified as 1,156 m, and all of the altitude values smaller than 1,156 m will also receive 100 % membership due to the Z-shaped curve. However, as the altitude increases from 1,156 to 1,200 m, the membership decreases from 100 % until it reaches 50 % (Figure 4B). This low membership value (50 %) indicates environmental conditions less characteristic of loamy/ sandy Typic Udifluvent, contrary to places where altitude values are smaller than 1,156 m.
Higher values of WI and low slopes (Table 2) were used for mapping hydromorphic soils in flatter alluvial areas (footslope). Udepts occupy the well-drained portions of the landscape with lower values of WI (summit, shoulder and backslope) formed by different combinations and ranges of slope, plan and profile curvature that represent different landforms. This procedure reduced the inconsistency and costs associated with conventional manual processes (Zhu et al., 2001).
A fuzzy logic based on the model called similarity vector (Zhu, 1997) represents soils at a given location perceiving the landscape as a continuum. The fuzzy logic is used to infer the membership of a soil type from environmental variables, such as a digital elevation model and its derivative maps. A soil at a given pixel (i,j) is represented by a n-element of similarity vector: Sij= ( ,
,  ,...
,... ,...
,... ...), where n is the number of prescribed soil types over the area, is an index which measures the similarity between the local soil at (i,j) to the prescribed soil type k. The similarity value is measured according to how close the soil is to a centroid concept (between 1 and 0). The more similar a soil is to a prescribed soil type, the higher its similarity value (fuzzy membership). The soil class, as well as the continuous spatial prediction is determined under fuzzy assignment, whereby a soil object can be labeled as being more than one soil type with different degrees of assignment depending on the similarities between the soil and a set of prescribed soil classes. The more similar a soil is to a prescribed soil type, the higher its similarity value, and from a fuzzy perspective, such values are the same as fuzzy memberships of the local soil to a soil type (Zhu et al., 2010).
Figure 5 shows the fuzzy membership maps created according to the instances for the five soil types (Table 2). They are the first product generated by the inference process. Every pixel is classified assuming a value ranging from 0 to 100, being high or low according to its similarity to the soil class which is being classified. These maps reveal more details about soil types than polygon maps because they are made at pixel size spatial resolution. The general shapes on the membership maps follow the landscape better than the ones on the soil polygon maps where inclusion or exclusion from a region is based more on restrictions derived from the scale of the map than from local conditions (Zhu et al., 1996). The central concept of the soil type responds to local variations in the apparent soil forming environment (represented by DTMs or terrain attributes). Fuzzy membership maps can be viewed as a non-linear transformation of the environmental variables (DTMs) (Zhu et al., 2010), and can be used to portray the uncertainty associated with the hardened or polygon map (McKay et al., 2010).
Solum Depth Predictive Maps
Figure 6 shows the solum depth prediction map from knowledge-based digital soil mapping. The shallowest sola display hydromorphic features, occurring under low elevation regions, with gentle slopes, higher wetness index and concave landforms (Figure 3), where the water table is closer to the surface for most of the year. Also, these soils do not contain B horizon because of the frequent sediments deposited due to floods, which inhibit soil development, limiting the solum depth to the A horizon thickness only in these places. On the other hand, Udepts are formed under different landforms, slopes, and are not subjected to floods, which, in turn, allow for the development of a B horizon and, hence, the solum depth. The moderately deep solum areas (yellow and light blue on the map), related to Udepts, correspond to places on steep slopes (Figure 3) and they are thicker than the ones from lowlands that are poorly developed. The deepest Udepts are related to places with gentle slopes and intermediate wetness index (high lands). Such conditions allow soil development with current characteristics that may reduce erosion rates and provide higher water infiltration, which enhance the pedogenesis development rates. Also, these areas tend to receive soil eroded (colluvium) from the uplands which further contributes to their increased thickness. As reported by Menezes et al. (2009), the only detailed soil survey report of the Mantiqueira Mountain region, the Udepts around the Lavrinha Creek Watershed, under the same climate and parent material, are deeper than the ones found in the rest of the Alto Rio Grande Basin, that are influenced by the faster weathering of gneiss and the intense precipitation regime.
Validation and Accuracy Assessment of the Predicted Solum Depth
The scatterplot graphics to compare the accuracy of conventional and knowledge-based digital soil mapping approaches are shown in Figure 7, and the results of the comparison parameters RMSE, ME, R2 and R2adj for the knowledge-based and conventional solum depth map are presented in Table 3. The scatterplot graphic for conventional solum depth map (7A), shows a greater spread of data points compared to the knowledge-based graphic (7B), which means a greater discrepancy between predicted and real solum depths. It is also apparent in the low R2 and R2adj. RMSE and ME values, which indicate that the knowledge-based solum depth map is more accurate compared to the solum depth map derived from the conventional soil polygon map (Table 3).
The knowledge-based digital soil mapping showed the gradual changing of solum depth throughout the landscape, which is more realistic, and resulted in greater spatial detail and accuracy when compared to the conventional map. Also, the knowledge-based solum depth map provides information about the smaller but potentially important environmental niches that may be described by higher resolution DTMs (Zhu, 1997).
The knowledge-based digital soil mapping approach has been successfully applied in the prediction of A horizon depth (Zhu et al., 1997), drainage classes (McKay et al., 2010), A horizon silt and sand contents (Qi et al., 2006), soil transmissivity (Zhu et al., 1997), hydraulic conductivity (Zhu and McKay, 2001), and solum depth (Quinn et al., 2005; Zhu and McKay, 2001). While the information about surface topography can nowadays be derived from easily accessible DEMs in different spatial resolutions and accuracies (Hengl and MacMillan, 2009), the use of aerial photography interpretation is becoming harder due to the limited number of pedologists trained in this methodology and the difficulty of acquiring aerial photographs on adequate scales in comparison to widely available high resolution satellite images. Furthermore, the use of digital soil mapping approach employed in this study provided adequate estimates of the solum thickness distribution at LCW. It reinforces the need of associating the knowledge of soil experts with soil-landscape relationships to predict soil properties along the landscape, especially in areas with limited data availability (Menezes et al., 2013).
Conclusions
The knowledge-based digital soil mapping approach showed advantages over the conventional soil mapping approach, by applying field expert-knowledge to predict solum depth with suited accuracy in a continuous way. A low density of samples was used, which is considered adequate given the low financial resources for soil survey programs currently available in Brazil.
The use of digital elevation models to derive terrain attributes and the possibility of employing them to predict soil properties using fuzzy logic provide adequate results for study areas with various soil types and difficult to access.
Acknowledgements
The authors would like to thank Fapemig, CNPq and CAPES funding agencies for the financial support provided to this work.
Received December 19, 2013
Accepted February 28, 2014
- Beven, K.; Wood, E.F. 1983. Catchment geomorphology and the dynamics of runoff contributing areas. Journal of Hydrology 65:139-158.
- Böhner, J.; McCloy, K.R.; Strobl, J. 2006. SAGA - Analysis and Modeling Applications. Göttinger Geographische Abhandlungen 115:130.
- Chartin, C.; Bourennane, H.; Salvador-Blanes, S.; Hinschberger, F.; Macaire, J.J. 2011. Classification and mapping of anthropogenic landforms on cultivated hillslopes using DEMs and soil thickness data: example from the SW Parisian basin, France. Geomorphology 135:8-20.
- Follain, S.; Walter, C.; Legout, A.; Lemercier, B.; Dutin, G. 2007. Induced effect of hedgerow networks on soil organic carbon storage within an agricultural landscape. Geoderma 142:80-95.
- Hengl, T.; MacMillan, R.A. 2009. Geomorphometry: a key to landscape mapping and modelling. p. 433-460. In: Hengl, T.; Reuter, H.I., eds. Geomorphometry: concepts, software, applications. Elsevier, Amsterdam, The Netherlands.
- Hudson, B.D. The soil survey as a paradigm-based science. 1992. Soil Science Society of America Journal 56:836-841.
- Instituto Brasileiro de Geografia e Estatística [IBGE]. Carta do Brasil. Rio de Janeiro, 1973. Escala: 1:50000. = Brazilian Institute of Geography and Statistics. Letter of Brazil. Rio de Janeiro. Scale: 1:50000. IBGE, Rio de Janeiro, RJ, Brazil.
- Jenny, H. 1941. Factors of Soil Formation. McGraw-Hill, New York, NY, USA.
- MacMillan, R.A.; Moon, D.E.; Coupe, R.A. 2007. Automated predictive ecological mapping in a Forest Region of B.C., Canada, 2001-2005. Geoderma 140:353-373.
- McBratney, A.B.; Santos, M.L.M.; Minasny, B. 2003. On digital soil mapping. Geoderma 117:3-52.
- McKay, J.; Grunwald, S.; Shi, X.; Long, R.F. 2010. Evaluation of the transferability of a knowledge-based soil-landscape model. p. 165-177. In: Boettinger, J.L.; Howell, D.W.; Moore, A.C.; Hartemink, A.E.; Kienast-Brown, S., eds. Digital soil mapping: bridging research, environmental application, and operation. Springer, New York, NY, USA.
- Menezes, M.D.; Junqueira Junior, J.A.; Mello, C.R.; Silva, A.M.; Curi, N.; Marques, J.J. 2009. Hydrological dynamics of two springs, associated to land use, soil characteristics and physical-hydrological attributes at Lavrinha creek watershed - Mantiqueira Mountains (MG). 2009. Scientia Forestalis 37:175-184 (in Portuguese, with abstract in English).
- Menezes, M.D.; Silva, S.H.G.; Owens, P.R.; Curi, N. 2013. Digital soil mapping approach based on fuzzy logic and field expert knowledge. Ciência e Agrotecnologia 37:287-29.
- Moore, I.D.; Gessler, P.E.; Nielsen, G.A.; Peterson, G.A. 1993. Soil attribute prediction using terrain analysis. Soil Science Society of American Journal 57:443-452.
- Odeh, I.O.A.; Mcbratney, A.B.; Chittleborough, D. 1995. Further results on prediction of soil properties from terrain attributes: heterotopic cokriging and regression-kriging. Geoderma 67:215-226.
- Qi, F.; Zhu, A.X.; Harrower, M.; Burt, J.E. 2006. Fuzzy soil mapping based on prototype category theory. Geoderma 136:774-787.
- Quinn, T.; Zhu, A.X.; Burt, J.E. Effects of detailed soil spatial information on watershed modeling across different model scales. 2005. International Journal of Applied Earth Observation and Geoinformation 7:324-338.
- Shi, R.; Long, R.; Dekett, R.; Phillip, R. 2009. Integrating different types of knowledge for digital soil mapping. Soil Science Society of America Journal 73:1682-1692.
- Soil Survey Staff. 1999. Soil Taxonomy. A Basic System of Soil Classification for Making and Interpreting Soil Surveys. 2ed. USDA-SCS, Washington, DC, USA. (Handbook 436).
- Sumfleth, K.; Duttmann, R. 2008. Prediction of soil property distribution in paddy soil landscape using terrain data and satellite information as indicators. Ecological Indicators 8:485-501.
- Zhu, A.X. A similarity model for representing soil spatial information. 1997. Geoderma 77:217-242.
- Zhu, A.X.; Band, L.E. 1994. A knowledge-based approach to data integration for soil mapping. Canadian Journal of Remote Sensing 20:408-418.
- Zhu, Q.; Lin, H.S. 2010. Comparing ordinary kriging and regression kriging for soil properties in contrasting landscapes. Pedosphere 20:594-606.
- Zhu, A.X.; McKay, D.S. 2001. Effects of spatial detail of soil information on watershed modeling. Journal of Hydrology 248:54-77.
- Zhu, A.X.; Band, L.E.; Dutton, B.; Nimlos, T.J. 1996. Automated soil inference under fuzzy logic. Ecological Modelling 90:123-145.
- Zhu, A.X.; Band, L.; Vertessy, R.; Dutton, B. 1997. Derivation of soil properties using a soil land inference model (SoLIM). Soil Science Society of American Journal 61:523-533.
- Zhu, A.X.; Hudson, B.; Burt, J.; Lubich, K.; Simonson, D. 2001. Soil mapping using GIS, expert knowledge, and fuzzy logic. Soil Science Society of American Journal 65:1463-1472.
- Zhu, A.X.; Qi, F.; Moore, A.; Burt, J.E. 2010. Prediction of soil properties using fuzzy membership values. Geoderma 158:199-206.
Publication Dates
-
Publication in this collection
21 July 2014 -
Date of issue
Aug 2014
History
-
Received
19 Dec 2013 -
Accepted
28 Feb 2014