
Abstract
Biological nitrogen fixation (BNF) has global economic and environmental importance, but has often not been considered in soybean [Glycine max (L.) Merrill] breeding programs. Knowing the genetic diversity and structure of a population within a germoplasm represent a key step for breeding programs. This study aimed at determining the structure of the population and diversity of soybean with regard to BNF and protein content in grain. In total, 191 accessions were evaluated, including 171 commercial soybean cultivars, developed and released by public institutions and private companies in Brazil, and 20 ancestral lines. The genotypes were chosen to represent four genetic groups: 128 Brazilian public genotypes, 20 exotic, and 43 genotypes from private companies. Soybeans were genotyped with 22 SSR markers, previously described as associated with BNF and protein content. Genetic diversity was evaluated using the DARwin 5.0 software. Population structure was inferred by principal component analysis and by the STRUCTURE software. The accessions were distributed in two groups: one clustering approximately 50 % of the accessions, from Brazilian public and private companies; the other one clustering 45 % of the accessions, including Brazilian, exotic and private germoplasms. Some accessions (5 %) were not grouped in any cluster. Principal component analysis explained 29 % of the total variance and there was a tendency to cluster the accessions into two groups. Similar results were obtained with the STRUCTURE, clearly showing two subpopulations. There is variability for BNF and protein content amongst both modern germoplasms cultivated in Brazil and ancestral lines. This variability could be better explored in soybean breeding programs to improve these traits.
BNF; Bradyrhizobium; Glycine max; SSR markers; symbiosis
Introduction
A difficulty encountered in soybean [Glycine max (L.) Merrill] breeding programs is how to increase protein content without lowering yield (Chung et al., 2003Chung, J.; Babka, H. L.; Graef, G. L.; Staswick, P. E.; Lee, D. J.; Cregan, P. B.; Shoemaker, R. C.; Specht, J. E. 2003. The seed protein, oil, and yield QTL on soybean linkage group I. Crop Science 3: 1053–1067.). An alternative to circumvent this problem is to improve biological nitrogen fixation (BNF) efficiency, because nitrogen (N) is the most limiting nutrient for crop growth and is directly related to protein content in grains (Hungria et al., 2006Hungria, M.; Franchini, J. C.; Campo, R. J.; Crispino, C. C.; Moraes, J. Z.; Sibaldelli, R. N. R.; Mendes, I. C.; Arihara, J. 2006. Nitrogen nutrition of soybean in Brazil: contributions of biological N2 fixation and N fertilizer to grain yield. Canadian Journal of Plant Science 86: 927-939.; Santos et al., 2013Santos, M. A.; Geraldi, I. O.; Garcia, A. A. F.; Bortolatto, N.; Schiavon, A.; Hungria, M. 2013. Mapping of QTLs associated with biological nitrogen fixation traits in soybean. Hereditas 150: 17-25.). BNF results from the symbioses between legumes and nitrogen-fixing soil bacteria collectively known as rhizobia. Several studies performed worldwide have demonstrated that the association between soybean and Bradyrhizobium japonicum, Bradyrhizobium diazoefficiens and Bradyrhizobium elkanii strains is economically and environmentally important (Hungria and Mendes, 2014Hungria, M.; Franchini, J. C.; Campo, R. J.; Crispino, C. C.; Moraes, J. Z.; Sibaldelli, R. N. R.; Mendes, I. C.; Arihara, J. 2006. Nitrogen nutrition of soybean in Brazil: contributions of biological N2 fixation and N fertilizer to grain yield. Canadian Journal of Plant Science 86: 927-939.). For example, savings on N-fertilizer by the replacement of BNF are estimated at about US$15 billion per season in Brazil (Hungria and Mendes, 2014Hungria, M.; Franchini, J. C.; Campo, R. J.; Crispino, C. C.; Moraes, J. Z.; Sibaldelli, R. N. R.; Mendes, I. C.; Arihara, J. 2006. Nitrogen nutrition of soybean in Brazil: contributions of biological N2 fixation and N fertilizer to grain yield. Canadian Journal of Plant Science 86: 927-939.). Additionally, benefits can be achieved in grain protein content, as the N derived from BNF is preferentially shifted to grains when compared to the N-fertilizer (Hungria and Neves, 1987Hungria, M.; Neves, M. C. P. 1987. Partitioning of nitrogen from biological and fertilizer in Phaseolus vulgaris. Physiologia Plantarum 69: 55-63.; Israel et al., 1985Israel, D.; Burton, J. W.; Wilson, R. F. 1985. Studies on genetic male-sterile soybeans. IV. Effect of male sterility and source of nitrogen nutrition on accumulation, partitioning, and transport of nitrogen. Plant Physiology 78: 762-767.).
Protein content in grains and BNF are quantitative traits (Nicolás et al., 2006Nicolás, M. F.; Hungria, M.; Arias, C. A. A. 2006. Identification of
quantitative trait loci controlling nodulation and shoot mass in progenies from
two Brazilian soybean cultivars. Field Crops Research 95:
355-366.) and the genetics associated with these
traits are poorly understood. BNF has often been excluded from consideration in
plant breeding programs mainly due to the difficulty of evaluating phenotypic traits
as nodulation. However, molecular tools may be used to overcome this evaluation
limitation (Semagn et al., 2010Semagn, K.; Bjørnstad, A.; Xu, Y. 2010. The genetic dissection of
quantitative traits in crops. Electronic Journal of Biotechnology. Available at:
http://www.scielo.cl/pdf/ejb/v13n5/a16.pdf [Accessed May 13,
2014].
http://www.scielo.cl/pdf/ejb/v13n5/a16.p...
).
Despite the importance of BNF for the soybean crop, there are few studies about molecular markers associated with this trait (Hwang et al., 2014Hwang, S.; Ray, J. D.; Cregan, P. B.; King, C. A.; Davies, M. K.; Purcell, L. C. 2014. Genetics and mapping of quantitative traits for nodule number, weight, and size in soybean Glycine max (L) Merr. Euphytica 195: 419-434.; Nicolás et al., 2006Nicolás, M. F.; Hungria, M.; Arias, C. A. A. 2006. Identification of quantitative trait loci controlling nodulation and shoot mass in progenies from two Brazilian soybean cultivars. Field Crops Research 95: 355-366.; Santos et al., 2006Santos, M. A.; Nicolás, M. F.; Hungria, M. 2006. Identification of QTL associated with the symbiosis of Bradyrhizobium japonicum, B. elkanii and soybean = Identificação de QTL associados à simbiose entre Bradyrhizobium japonicum, B. elkanii e soja. Pesquisa Agropecuária Brasileira 41: 67-75 (in Portuguese, with abstract in English).; Santos et al., 2013Santos, M. A.; Geraldi, I. O.; Garcia, A. A. F.; Bortolatto, N.; Schiavon, A.; Hungria, M. 2013. Mapping of QTLs associated with biological nitrogen fixation traits in soybean. Hereditas 150: 17-25.; Tanya et al., 2005Tanya, P.; Srinives, P.; Toojinda, T.; Nakhon, P.; Vanavichit, A.; Lee, S. H. 2005. Identification of SSR markers associated with N2 fixation components in soybean [Glycine max (L) Merr.]. Korean Journal of Genetic 27: 351-359.). These studies were performed with bi-parental populations, and many markers are required for this purpose. For example, Santos et al. (2013)Santos, M. A.; Geraldi, I. O.; Garcia, A. A. F.; Bortolatto, N.; Schiavon, A.; Hungria, M. 2013. Mapping of QTLs associated with biological nitrogen fixation traits in soybean. Hereditas 150: 17-25. described quantitative trait loci (QTLs) for nodule number and individual nodule weight in a population of 157 F2:7 inbred lines using 97 simple sequence repeat (SSR) markers. Hwang et al. (2014)Hwang, S.; Ray, J. D.; Cregan, P. B.; King, C. A.; Davies, M. K.; Purcell, L. C. 2014. Genetics and mapping of quantitative traits for nodule number, weight, and size in soybean Glycine max (L) Merr. Euphytica 195: 419-434. used a combination of 664 informative (SSR and single nucleotide polymorphism - SNP) markers for soybean root nodulation in 17 F3- and 80 F5- derived RILs.
Most QTLs related to BNF coincide with QTLs for protein content (Cregan et al., 1999Cregan, P. B.; Jarvik, T.; Bush, A. L.; Shoemaker, R. C.; Lark, K.
G.; Kahler, A. L.; Kaya, N.; Toai T. T. van; Lohnes, D. G.; Chung, J.; Specht,
J. E. 1999. An integrated genetic linkage map of the soybean genome. Crop
Science 39: 1464-1491.; Santos et al., 2006Santos, M. A.; Nicolás, M. F.; Hungria, M. 2006. Identification of
QTL associated with the symbiosis of Bradyrhizobium japonicum,
B. elkanii and soybean = Identificação de QTL associados à
simbiose entre Bradyrhizobium japonicum, B.
elkanii e soja. Pesquisa Agropecuária Brasileira 41: 67-75 (in
Portuguese, with abstract in English).; Santos et
al., 2013Santos, M. A.; Geraldi, I. O.; Garcia, A. A. F.; Bortolatto, N.;
Schiavon, A.; Hungria, M. 2013. Mapping of QTLs associated with biological
nitrogen fixation traits in soybean. Hereditas 150: 17-25.), but to date, no studies have addressed simultaneous increases
in both traits. Nowadays, there is no report about genetic variability in soybean
germplasm worldwide regarding BNF and protein traits. Therefore, there is a need to
improve the understanding of the genetic bases of these two components. Considering
that Brazil is the second largest producer and exporter of soybean (USDA, 2014United States Department of Agriculture [USDA]. 2014. Oilseeds world
markers and trade. Available at:
http://apps.fas.usda.gov/psdonline/circulars/oilseeds.pdf [Accessed May 5,
2014].
http://apps.fas.usda.gov/psdonline/circu...
), understanding the genetic
variability for BNF and protein in Brazilian germoplasm represents crucial
information for plant breeding programs.
Knowing the structure of the population within a germplasm collection is essential for understanding and correctly interpreting the association between functional and molecular diversity. Population structure refers to the existence of established subgroups within a whole population. Furthermore, selecting useful diversity from an available germplasm collection is critical in order to effectively conserve and utilize the genes in soybean breeding programs (Li et al., 2011Li, Y. H.; Smulders, M. J. M.; Chang, R. Z.; Qiu, L. J. 2011. Genetic diversity and association mapping in a collection of selected Chinese soybean accessions based on SSR marker analysis. Conservation Genetics 12: 1145-1157.). In this study, we aimed at determining the genetic structure and diversity of soybean in relation to the characteristics of BNF and protein content in grains.
Materials and Methods
Plant material
A total of 191 accessions was evaluated, including 171 commercial cultivars of soybean, developed and released by public and private institutions in Brazil (primarily selected for disease resistance and yield), and 20 ancestral lines. The genotypes were chosen to represent four genetic groups, coded as follows: 128 public Brazilian (BR), 20 exotic (E), and from private companies (30 N and 13 ST). Group N comprised cultivars with high protein concentration in grains, developed mainly for human consumption. The ST group consisted of germplasm from another private company selected for traits of disease resistance and yield.
DNA extraction
Seeds from each cultivar were grown under controlled greenhouse conditions. Twelve days after germination, three young leaves from one plant from each cultivar were harvested and stored at -80 °C for DNA extraction (Keim et al., 1988Keim, P.; Olson, T. C.; Shoemaker, R. C. 1988. A rapid protocol for isolating soybean DNA. Soybean Genetic Newsletter 15: 150-152.).
SSR markers and polymerase chain reaction
Twenty-two simple-sequence repeat (SSR) markers were chosen based on previous genotyping studies (Santos et al., 2006Santos, M. A.; Nicolás, M. F.; Hungria, M. 2006. Identification of QTL associated with the symbiosis of Bradyrhizobium japonicum, B. elkanii and soybean = Identificação de QTL associados à simbiose entre Bradyrhizobium japonicum, B. elkanii e soja. Pesquisa Agropecuária Brasileira 41: 67-75 (in Portuguese, with abstract in English).; Santos et al., 2013Santos, M. A.; Geraldi, I. O.; Garcia, A. A. F.; Bortolatto, N.; Schiavon, A.; Hungria, M. 2013. Mapping of QTLs associated with biological nitrogen fixation traits in soybean. Hereditas 150: 17-25.), which found association between markers and BNF. They are related to QTLs controlling protein content in soybean grain, previously developed and published by Cregan et al. (1999)Cregan, P. B.; Jarvik, T.; Bush, A. L.; Shoemaker, R. C.; Lark, K. G.; Kahler, A. L.; Kaya, N.; Toai T. T. van; Lohnes, D. G.; Chung, J.; Specht, J. E. 1999. An integrated genetic linkage map of the soybean genome. Crop Science 39: 1464-1491.. The markers cover 13 out of the 20 soybean linkage groups. The estimated genetic distance (cM) along with the loci was inferred from the public USDA map (Song et al., 2004Song, Q. J.; Marek, L. F.; Shoemaker, R. C.; Lark, K. G.; Concibido, V. C.; Delannay, X.; Specht, J. E.; Cregan, P. B. 2004. A new integrated genetic linkage map of the soybean. Theoretical and Applied Genetics 109: 122-128.). Primer pairs (RW Genes) are coded as shown in Table 1.
Amplification of DNA by PCR was performed on each of the 191 cultivars, using primers for each SSR locus. Reaction mixtures contained 0.7 units of Taq DNA polymerase, 1 × reaction buffer [2.5 mM Tris-HCl (pH 8.3)] 50 mM KCl, 2.5 mM MgCl2, 0.2 μM of each primer, 125 μM of each deoxyribonucleoside triphosphate and 20 ng of DNA sample, in a total volume of 10 μL. The following PCR program was used on a Veriti 96-well thermal cycler: 7 min at 95 °C, 29 cycles of 1 min at 95 °C, 1 min at 50 °C, 1 min at 72 °C and final elongation of 7 min at 72 °C. Amplicons were separated by vertical electrophoresis in 10 % polyacrylamide gels (29:1 acrylamide:bis-acrylamide) immersed in 1 × TAE (0.09 M Tris-acetate; 2 mM EDTA) with a Dcode apparatus (3 h at 300 V). Gels were stained with ethidium bromide (0.5 μg mL−1), visualized under UV radiation and photographed with a digital camera and PC software (Eastman Kodak Company). A 1-kb Plus DNA Ladder was included in each run. Amplified SSR fragments of different sizes were considered as different alleles.
Genetic diversity and cluster analysis
All cultivars were treated as pure lines. A small proportion of heterozygosity was observed, and the following criteria were used to define the working allele, as suggested by Breseghello and Sorrels (2006)Breseghello, F.; Sorrels, M. E. 2006. Association mapping of kernel size and milling quality in wheat (Triticum aestivum L.) cultivars. Genetics 172: 1165-1177.: if the two bands had different intensities, then the strongest band was scored; if the two bands had similar intensities, then the more common allele was retained. If neither criterion could be applied, it was considered as missing data.
To quantify the allelic diversity of the polymorphic SSR markers, the polymorphism information content (PIC) for each marker was estimated according to the following formula: 1 - Σ(Pij)2, where Pij is the frequency of the ith allele in the jth population for each SSR locus (Botstein et al., 1980Botstein, D.; White, R. L.; Skolmick, M.; Davis, R. W. 1980. Construction of a genetic linkage map in man using restriction fragment length polymorphism. American Journal of Human Genetics 32: 314-332.).
The dissimilarity matrix was used for clustering of cultivars based on the unweighted neighbor-joining method, and the analysis was performed using DARwin 5.0 software. We used Jaccard’s similarity coefficient and 70 % as the minimal proportion of valid data required for each unit pair for cluster analysis.
Population structure
First, the population structure was evaluated by principal component analysis (PCA), a classical nonparametric linear dimensionality reduction technique (Jolliffe, 2002Jolliffe, I. 2002. Principal Components Analysis. Springer-Verlag, New York, NY, USA.). Analyses were performed with polymorphic SSR markers (Table 1) using the STATISTICA program, version 7.0. For visualization, principal components were plotted in two-dimensional plots.
For structure analysis based on Bayesian inference, SSR loci with at least 10 cM of distance between each other were chosen (Pritchard et al., 2000Pritchard, J. K.; Stephens, M.; Donnelly, P. 2000. Inference of population structure using multilocus genotype data. Genetics 155: 945-959.) (Table 1). The STRUCTURE software (version 2.3.3) (Pritchard et al., 2000Pritchard, J. K.; Stephens, M.; Donnelly, P. 2000. Inference of population structure using multilocus genotype data. Genetics 155: 945-959.) was used to test the hypothesis for one to five subpopulations, without admixture and with correlated allele frequencies (Falush et al., 2003Falush, D.; Stephens, M.; Pritchard, J. K. 2003. Inference of population structure using multilocus genotype data: linked loci and correlated allele frequencies. Genetics 164: 1567-1587.; Pritchard et al., 2000Pritchard, J. K.; Stephens, M.; Donnelly, P. 2000. Inference of population structure using multilocus genotype data. Genetics 155: 945-959.), a burn-in phase of 100,000 iterations, a sampling phase of 10,000 replicates and 10 independent runs. To detect the most probable value of K, the model criterion chosen was ΔK, according to Evanno et al. (2005)Evanno, G.; Regnaut, S.; Goudet, J. 2005. Detecting the number of clusters of individuals using the software STRUCTURE: a simulation study. Molecular Ecology 14: 2611-2620..
Results
The total number of alleles generated by the SSR loci was 102, ranging between 2 and 12, with an average of 5.1 alleles per locus (Table 1). Only two markers (Satt455 and Satt578) did not reveal polymorphism among the 191 accessions. The average of the effective number of alleles (Ae) was 4.28, ranging from 1.46 (Satt567) to 10.6 (Satt416). The PIC values ranged from 0.2 (Satt567) to 0.8 (Satt406), with an average of 0.48.
The dendrogram generated by the Neighbor-Joining method showed the genetic relationships of the accessions (Figure 1). They were clearly separated into two distinct clusters: one grouping approximately 50 % of the accessions, including public Brazilian compamies (BR) and one private company (N) germplasms; the other one grouping 45 % of the accessions, including Brazilian (BR), exotic (E) and two private companies (N and ST). However, some accessions from BR, E, N and ST (5 %) were not grouped in any cluster.
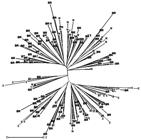
− Tree based on the Neighbor Joining method showing genetic dissimilarity between soybean cultivars, based on SSR markers. Cultivars representative of the following groups: Brazilian (BR), exotic (E), private companies (N) and (ST).
When the population structure was evaluated using principal component (PC) analysis, the first two PCs explained 29 % of the total variance (Figure 2). Based on Bayesian inference, using the software STRUCTURE and the ΔK parameter proposed by Evanno et al. (2005)Evanno, G.; Regnaut, S.; Goudet, J. 2005. Detecting the number of clusters of individuals using the software STRUCTURE: a simulation study. Molecular Ecology 14: 2611-2620., we established two subpopulations (K = 2) (Figure 3). Population structure analysis revealed clearly that the highest value of ΔK for the 191 soybean accessions was K = 2 (Figure 4). Based on K = 2, the Q value of each classified cultivar was verified for each subpopulation. Total accessions generally had probability exceeding 90 % of the assignment subpopulation. Only 3 % (5 accessions) had probabilities lower than 70 %. Subpopulation 1 was formed by Brazilian (BR) and private company N, whereas subpopulation 2 was composed of BR, E and ST accessions and a small percentage of N (2 accessions).

− Two-dimensional plots of the soybean accessions based on principal component analysis (PCA). Acessions representative of the following groups: Brazilian (BR), exotic (E), private companies (N) and (ST).

− Estimation of the number of subpopulation (K) calculated by delta K value (ΔK), according to Evanno et al. (2005)Evanno, G.; Regnaut, S.; Goudet, J. 2005. Detecting the number of clusters of individuals using the software STRUCTURE: a simulation study. Molecular Ecology 14: 2611-2620..

− Bar plot for two subpopulations based on an admixture model for 191 soybean cultivars, developed and released by public and private institutions, in Brazil. Each cultivar is represented by a single vertical line. Subpopulation 1 consisted by 68 cultivars representative of the Brazilian (BR) group and 27 private (N). Subpopulation 2 consisted by 60 cultivars representative of the Brazilian (BR) group, 20 exotic (E) and 3 (N) and 13 (ST) private companies.
Discussion
Soybean exhibits narrow genetic variability in the United States (Gizlice et al., 1994Gizlice, Z.; Carter, T. E.; Burton, J. W. 1994. Genetic base for North American public soybean cultivars released between 1947 and 1988. Crop Science 34: 1143-1151.) and in Brazil (Abdelnoor et al., 1995Abdelnoor, R. V.; Barros, E. G.; Moreira, M. A. 1995. Determination of genetic diversity within Brazilian soybean germplasm using random amplified polymorphic DNA techniques and comparative analysis with pedigree data. Revista Brasileira de Genética 18: 265-276.; Hiromoto and Vello, 1986Hiromoto, D. M.; Vello, N. A. 1986. The genetic base of Brazilian soybean (Glycine max (L.) Merrill) cultivars. Revista Brasileira de Genética 2: 295-306.). Large-scale soybean cultivation in Brazil started in the 1960s, with few lines coming from the United States. Since then, Brazilian cultivars have been developed by means of crosses and selection in the resulting progenies (Hiromoto and Vello, 1986Hiromoto, D. M.; Vello, N. A. 1986. The genetic base of Brazilian soybean (Glycine max (L.) Merrill) cultivars. Revista Brasileira de Genética 2: 295-306.). The frequent crossing of a small number of cultivars has resulted in reduced genetic diversity. More recently, there has been an indication of an increase in the number of ancestors in Brazil (Wysmierski and Vello, 2013Wysmiersky, P. T.; Vello, N. A. 2013. The genetic base of Brazilian soybean cultivars: evolution over time and breeding implications. Genetics and Molecular Biology 4: 547-555.).
High levels of polymorphism were revealed in soybean by the use of neutral SSR markers, for both the number of alleles per locus and gene diversity (Akkaya et al., 1992Akkaya, M. G.; Bhawat, A.; Cregan, P. B. 1992. Length polymorphisms of simple sequence repeat DNA in soybean. Genetics 132: 1131-1139.; Narvel et al., 2000Narvel, J. M.; Fehr, W. R.; Chu, W.; Grant, D.; Shoemaker, R. C. 2000. Simple sequence repeat diversity among soybean plant introductions and elite genotypes. Crop Science 40: 1452-1458.; Priolli et al., 2002Priolli, R. H. G.; Mendes Jr, C. T.; Arantes, N. E.; Contel, E. P. B. 2002. Characterization of Brazilian soybean cultivars using microsatellite markers. Genetics and Molecular Biology 25: 185-193.; Priolli et al., 2010Priolli, R. H. G.; Pinheiro, J. B.; Zucchi, M. I.; Bajay, M.; Vello, N. A. 2010. Genetic diversity among Brazilian soybean cultivars base on SSR loci and pedigree data. Brazilian Archives of Biology and Technology 53: 519-531.). In this study, using SSR markers and considering the parameters of BNF and protein content, we have also observed high variability amongst both modern germoplasms cultivated in Brazil and ancestral lines. This variability could be explored in soybean breeding programs. The SSR loci with both more than five alleles and Polymorphism index content (PIC) value over 0.6 would be worthy for genetic structure analysis and marker assisted selection (MAS) (Dong et al., 2013Dong, D.; Fu, X.; Yuan, F.; Chen, P.; Zhu, S.; Li, B.; Yang, Q.; Yu, X.; Zhu, D. 2013. Genetic diversity and population structure of vegetable soybean (Glycine max (L.) Merr.) in China as revealed by SSR markers. Genetic Resources and Crop Evolution 61: 173-183.).
The efficiency of utilization of SSR markers in studies of genetic diversity has been confirmed thanks to their co-dominant and multi-allelic nature (Dong et al., 2013Dong, D.; Fu, X.; Yuan, F.; Chen, P.; Zhu, S.; Li, B.; Yang, Q.; Yu, X.; Zhu, D. 2013. Genetic diversity and population structure of vegetable soybean (Glycine max (L.) Merr.) in China as revealed by SSR markers. Genetic Resources and Crop Evolution 61: 173-183.; Hou et al., 2011Hou, J.; Wang, C.; Hong, X.; Zhao, J.; Xue, C.; Guo, N.; Gai, J.; Xing, H. 2011. Association analysis of vegetable soybean quality traits with SSR markers. Plant Breeding 130: 444-449.; Priolli et al., 2002Priolli, R. H. G.; Mendes Jr, C. T.; Arantes, N. E.; Contel, E. P. B. 2002. Characterization of Brazilian soybean cultivars using microsatellite markers. Genetics and Molecular Biology 25: 185-193.). In this study, genotyping of 191 Brazilian soybean accessions with SSR markers allowed for the assessment of the population structure. PC analysis showed, in two-dimensional plots, that there was a tendency to cluster the accessions of soybean into two groups. According to Patterson et al. (2006)Patterson, N.; Price, A. L.; Reich, D. 2006. Population structure and eigenanalysis. PLoS Genetics 2: e190., PCA seems like a “black box”, whereas STRUCTURE and similar methods are based on an interpretable population genetics model. PCA largely fell out of favor with the introduction of the sophisticated cluster-based program STRUCTURE.
Comparing the distribution of soybean accessions by both the Neighbor-Joining tree and the analysis by STRUCTURE software, we have shown two highly consistent subgroups. Most of the accessions were distributed in either of the two groups or subpopulations, except for the exotic genotypes, which were mostly restricted to only one group. The choice of accessions was made according to the breeding program of each institution. Brazilian accessions and ST group genotypes were selected for disease resistance and yield, while group N consisted in cultivars with high protein content in grains, developed mainly for human consumption. Crossing of germplasm from different groups is highly recommended (Dong et al., 2013Dong, D.; Fu, X.; Yuan, F.; Chen, P.; Zhu, S.; Li, B.; Yang, Q.; Yu, X.; Zhu, D. 2013. Genetic diversity and population structure of vegetable soybean (Glycine max (L.) Merr.) in China as revealed by SSR markers. Genetic Resources and Crop Evolution 61: 173-183.). In addition, exchanges of gene pools could be useful for increasing genetic variability in soybean breeding (Wysmierski and Vello, 2013Wysmiersky, P. T.; Vello, N. A. 2013. The genetic base of Brazilian soybean cultivars: evolution over time and breeding implications. Genetics and Molecular Biology 4: 547-555.), being particularly relevant for the Brazilian germplasm, due to its narrow genetic basis.
To date, no study has been performed to investigate genetic diversity or population structure for the parameters of BNF and protein content in Brazilian cultivars. The great majority of soybean breeding programs in the country emphasize increased and stable grain yield and disease resistance (Hiromoto and Vello, 1986Hiromoto, D. M.; Vello, N. A. 1986. The genetic base of Brazilian soybean (Glycine max (L.) Merrill) cultivars. Revista Brasileira de Genética 2: 295-306.). Therefore, our results could be useful for the selection of divergent parental genotypes for use in soybean breeding programs and for the development of marker assisted selection aiming to improve the BNF and protein content of soybean, with high economic and environmental impacts. Finally, SSR analyses showed that there is variability in BNF and protein content traits amongst both modern germoplasms cultivated in Brazil and ancestral lines. This variability could be better explored in soybean breeding programs to improve BNF and protein content.
Acknowledgments
Project partially funded by CNPq (Brazilian National Council for Scientific and Technological Development), Projects RHAE (167565/2010-9), REPENSA (National Research Network on Agricultural Biodiversity and Sustainability) (562008/2010-1) and private company Soy Tech Seeds. A.R. Torres, A.K. Grunvald, T.B. Martins, M.A. Santos and N.G. Lemos received fellowships from CNPq. M. Hungria is also a research fellow from CNPq. The authors thank David Pot for help in diversity analysis and Dr. Allan R. J. Eaglesham for reviewing the manuscript. Approved for publication by the Editorial Board of Embrapa Soybean as manuscript 09/2013.
References
- Abdelnoor, R. V.; Barros, E. G.; Moreira, M. A. 1995. Determination of genetic diversity within Brazilian soybean germplasm using random amplified polymorphic DNA techniques and comparative analysis with pedigree data. Revista Brasileira de Genética 18: 265-276.
- Akkaya, M. G.; Bhawat, A.; Cregan, P. B. 1992. Length polymorphisms of simple sequence repeat DNA in soybean. Genetics 132: 1131-1139.
- Botstein, D.; White, R. L.; Skolmick, M.; Davis, R. W. 1980. Construction of a genetic linkage map in man using restriction fragment length polymorphism. American Journal of Human Genetics 32: 314-332.
- Breseghello, F.; Sorrels, M. E. 2006. Association mapping of kernel size and milling quality in wheat (Triticum aestivum L.) cultivars. Genetics 172: 1165-1177.
- Chung, J.; Babka, H. L.; Graef, G. L.; Staswick, P. E.; Lee, D. J.; Cregan, P. B.; Shoemaker, R. C.; Specht, J. E. 2003. The seed protein, oil, and yield QTL on soybean linkage group I. Crop Science 3: 1053–1067.
- Cregan, P. B.; Jarvik, T.; Bush, A. L.; Shoemaker, R. C.; Lark, K. G.; Kahler, A. L.; Kaya, N.; Toai T. T. van; Lohnes, D. G.; Chung, J.; Specht, J. E. 1999. An integrated genetic linkage map of the soybean genome. Crop Science 39: 1464-1491.
- Dong, D.; Fu, X.; Yuan, F.; Chen, P.; Zhu, S.; Li, B.; Yang, Q.; Yu, X.; Zhu, D. 2013. Genetic diversity and population structure of vegetable soybean (Glycine max (L.) Merr.) in China as revealed by SSR markers. Genetic Resources and Crop Evolution 61: 173-183.
- Evanno, G.; Regnaut, S.; Goudet, J. 2005. Detecting the number of clusters of individuals using the software STRUCTURE: a simulation study. Molecular Ecology 14: 2611-2620.
- Falush, D.; Stephens, M.; Pritchard, J. K. 2003. Inference of population structure using multilocus genotype data: linked loci and correlated allele frequencies. Genetics 164: 1567-1587.
- Gizlice, Z.; Carter, T. E.; Burton, J. W. 1994. Genetic base for North American public soybean cultivars released between 1947 and 1988. Crop Science 34: 1143-1151.
- Jolliffe, I. 2002. Principal Components Analysis. Springer-Verlag, New York, NY, USA.
- Hiromoto, D. M.; Vello, N. A. 1986. The genetic base of Brazilian soybean (Glycine max (L.) Merrill) cultivars. Revista Brasileira de Genética 2: 295-306.
- Hou, J.; Wang, C.; Hong, X.; Zhao, J.; Xue, C.; Guo, N.; Gai, J.; Xing, H. 2011. Association analysis of vegetable soybean quality traits with SSR markers. Plant Breeding 130: 444-449.
- Hungria, M.; Neves, M. C. P. 1987. Partitioning of nitrogen from biological and fertilizer in Phaseolus vulgaris Physiologia Plantarum 69: 55-63.
- Hungria, M.; Franchini, J. C.; Campo, R. J.; Crispino, C. C.; Moraes, J. Z.; Sibaldelli, R. N. R.; Mendes, I. C.; Arihara, J. 2006. Nitrogen nutrition of soybean in Brazil: contributions of biological N2 fixation and N fertilizer to grain yield. Canadian Journal of Plant Science 86: 927-939.
- Hwang, S.; Ray, J. D.; Cregan, P. B.; King, C. A.; Davies, M. K.; Purcell, L. C. 2014. Genetics and mapping of quantitative traits for nodule number, weight, and size in soybean Glycine max (L) Merr. Euphytica 195: 419-434.
- Israel, D.; Burton, J. W.; Wilson, R. F. 1985. Studies on genetic male-sterile soybeans. IV. Effect of male sterility and source of nitrogen nutrition on accumulation, partitioning, and transport of nitrogen. Plant Physiology 78: 762-767.
- Keim, P.; Olson, T. C.; Shoemaker, R. C. 1988. A rapid protocol for isolating soybean DNA. Soybean Genetic Newsletter 15: 150-152.
- Li, Y. H.; Smulders, M. J. M.; Chang, R. Z.; Qiu, L. J. 2011. Genetic diversity and association mapping in a collection of selected Chinese soybean accessions based on SSR marker analysis. Conservation Genetics 12: 1145-1157.
- Narvel, J. M.; Fehr, W. R.; Chu, W.; Grant, D.; Shoemaker, R. C. 2000. Simple sequence repeat diversity among soybean plant introductions and elite genotypes. Crop Science 40: 1452-1458.
- Nicolás, M. F.; Hungria, M.; Arias, C. A. A. 2006. Identification of quantitative trait loci controlling nodulation and shoot mass in progenies from two Brazilian soybean cultivars. Field Crops Research 95: 355-366.
- Patterson, N.; Price, A. L.; Reich, D. 2006. Population structure and eigenanalysis. PLoS Genetics 2: e190.
- Priolli, R. H. G.; Mendes Jr, C. T.; Arantes, N. E.; Contel, E. P. B. 2002. Characterization of Brazilian soybean cultivars using microsatellite markers. Genetics and Molecular Biology 25: 185-193.
- Priolli, R. H. G.; Pinheiro, J. B.; Zucchi, M. I.; Bajay, M.; Vello, N. A. 2010. Genetic diversity among Brazilian soybean cultivars base on SSR loci and pedigree data. Brazilian Archives of Biology and Technology 53: 519-531.
- Pritchard, J. K.; Stephens, M.; Donnelly, P. 2000. Inference of population structure using multilocus genotype data. Genetics 155: 945-959.
- Santos, M. A.; Nicolás, M. F.; Hungria, M. 2006. Identification of QTL associated with the symbiosis of Bradyrhizobium japonicum, B. elkanii and soybean = Identificação de QTL associados à simbiose entre Bradyrhizobium japonicum, B. elkanii e soja. Pesquisa Agropecuária Brasileira 41: 67-75 (in Portuguese, with abstract in English).
- Santos, M. A.; Geraldi, I. O.; Garcia, A. A. F.; Bortolatto, N.; Schiavon, A.; Hungria, M. 2013. Mapping of QTLs associated with biological nitrogen fixation traits in soybean. Hereditas 150: 17-25.
- Semagn, K.; Bjørnstad, A.; Xu, Y. 2010. The genetic dissection of quantitative traits in crops. Electronic Journal of Biotechnology. Available at: http://www.scielo.cl/pdf/ejb/v13n5/a16.pdf [Accessed May 13, 2014].
» http://www.scielo.cl/pdf/ejb/v13n5/a16.pdf - Song, Q. J.; Marek, L. F.; Shoemaker, R. C.; Lark, K. G.; Concibido, V. C.; Delannay, X.; Specht, J. E.; Cregan, P. B. 2004. A new integrated genetic linkage map of the soybean. Theoretical and Applied Genetics 109: 122-128.
- Tanya, P.; Srinives, P.; Toojinda, T.; Nakhon, P.; Vanavichit, A.; Lee, S. H. 2005. Identification of SSR markers associated with N2 fixation components in soybean [Glycine max (L) Merr.]. Korean Journal of Genetic 27: 351-359.
- United States Department of Agriculture [USDA]. 2014. Oilseeds world markers and trade. Available at: http://apps.fas.usda.gov/psdonline/circulars/oilseeds.pdf [Accessed May 5, 2014].
» http://apps.fas.usda.gov/psdonline/circulars/oilseeds.pdf - Wysmiersky, P. T.; Vello, N. A. 2013. The genetic base of Brazilian soybean cultivars: evolution over time and breeding implications. Genetics and Molecular Biology 4: 547-555.
-
Edited by: Antonio Augusto Franco Garcia
Publication Dates
-
Publication in this collection
Jan-Feb 2015
History
-
Received
30 Jan 2014 -
Accepted
15 July 2014


