Abstract
Soil respiration is a major component of the global carbon cycle which links ecosystems and the atmosphere. To evaluate the reaction of soil respiration after wetting, during a dry period, soil respiration and associated environmental factors were measured over a 24-h period, during the dry season in North Cameroon after wetting the soil. Over 24-h, soil respiration rates followed a quadratic curve during the day coming close to linear at night, while soil temperature and moisture together explained at least 73 % of the variations during the 24-h observed. These soil respiration rates increased during the morning, peaked between 11h00 and 13h00 and then decreased gradually to the minimum around 06h00. These observations were used to propose a method for estimating mean daytime and nighttime soil respiration after wetting the soil. The method proposed in this study has the advantage of being based on a small number of measurements and is, therefore, easier to implement for monitoring 24-h soil respiration after the first rains following a long dry period.
diel soil respiration; soil temperature; soil moisture
Introduction
Soil respiration (SR) is the one of the main carbon fluxes between terrestrial ecosystems and the atmosphere, second only to plant respiration. Several authors have estimated global SR as being in the range of 50-75 Pg carbon (Schimel, 1995Schimel, D.S. 1995. Terrestrial ecosystems and the carbon cycle. Global Change Biology 1: 77-91.; Schlesinger and Andrews, 2000Schlesinger, W.H.; Andrews, J.A. 2000. Soil respiration and the global carbon cycle. Biogeochemistry 48: 7-20.). It is important to relate the intensity of this flux to environmental factors and land use, and search for mitigation solutions.
Several studies have been conducted on SR (Teixeira et al., 2013Teixeira, D.D.B.; Bicalho, E.D.S.; Panosso, A.R.; Cerri, C.E.P.; Pereira, G.T.; La Scala Júnior, N. 2013. Spatial variability of soil CO2 emission in a sugarcane area characterized by secondary information. Scientia Agricola 70: 195-203.; Liang et al., 2014Liang, Y.; Bai, C.; Mu, L.; Zhou, M. 2014. Soil respiration in cucumber field under crop rotation in solar greenhouse. Scientia Agricola 71: 337-341.). In particular, they have shed light the diel variability of SR, i.e. involving a 24-h period that usually includes a day and the contiguous night (Sotta et al., 2004Sotta, E.D.; Meir, P.; Malhi, Y.; Hodnett, M.; Grace, J. 2004. Soil CO2 efflux in a tropical forest in the central Amazon. Global Change Biology 10: 601-617.). The authors reported a difference between nighttime and daytime fluxes together with high variability within a single period even(Sotta et al., 2004Sotta, E.D.; Meir, P.; Malhi, Y.; Hodnett, M.; Grace, J. 2004. Soil CO2 efflux in a tropical forest in the central Amazon. Global Change Biology 10: 601-617.). In general, the respiration of microorganisms increases in the morning with the increase in soil temperature, peaking at noon or early in the afternoon, and decreases throughout the night as the temperature drops (Hirano, 2005Hirano, T. 2005. Seasonal and diurnal variations in topsoil and subsoil respiration under snowpack in a temperate deciduous forest. Global Biogeochemical Cycles 19: GB2011.). However, other authors have reported no or negligible diel SR variations (Buchmann, 2000Buchmann, N. 2000. Biotic and abiotic factors controlling soil respiration rates in Picea abies stands. Soil Biology and Biochemistry 32: 1625-1635.; Widen and Majdi, 2001Widen, B.; Majdi, H. 2001. Soil CO2 efflux and root respiration at three sites in a mixed pine and spruce forest: seasonal and diurnal variation. Canadian Journal of Forest Research 31: 786-796.; Chevallier et al., 2006Chevallier, T.; Blanchart, E.; Albrecht, A.; Feller, C.; Bernoux, M. 2006. Impact of pasture establishment on CO2 emissions from a Vertisol: consequences for soil C sequestration (Martinique, West Indies). Canadian Journal of Soil Science 86: 779-782.;Betson et al., 2007Betson, N.R.; Gottlicher, S.G.; Hall, M.; Wallin, G.; Richter, A.; Hogberg, P. 2007. No diurnal variation in rate or carbon isotope composition of soil respiration in a boreal forest. Tree Physiology 27: 749-756.).
Some authors average measurements between 10h00 and 12h00 to give a value representative of the 24-h mean, while others use the average of the measurements taken early in the morning (6h00 to 9h00) as the minimum values and the measurements taken at the beginning of the afternoon (14h00 to 15h00) as the maximum values (Larionova et al., 1989Larionova, A.; Rozonova, L.; Samoylov, T. 1989. Dynamics of gas exchange in the profile of a gray forest soil. Soviet Soil Science 3: 104-110.; Fernandes et al., 2002Fernandes, S.A.P.; Bernoux, M.; Cerri, C.C.; Feigl, B.J.; Piccolo, M.C. 2002. Seasonal variation of soil chemical properties and CO2 and CH4 fluxes in unfertilized and P-fertilized pastures in an Ultisol of the Brazilian Amazon. Geoderma 107: 227-241.; Garcia-Montiel et al., 2004Garcia-Montiel, D.C.; Melillo, J.M.; Steudler, P.A.; Tian, H.; Neill, C.; Kicklighter, D.W.; Feigl, B.; Piccolo, M.; Cerri, C.C. 2004. Emissions of N2O and CO2 from terra firme forests in Rondônia, Brazil. Ecological Applications 14: 214-220.; Wang et al., 2014Wang, M.; Xingtu, L.; Jitao, Z.; Xiujun, L.; Guodong, W.; Xiaoyu, L.; Xinrui, L. 2014. Diurnal and seasonal dynamics of soil respiration at temperate Leymus Chinensis meadow steppes in western Songnen Plain, China. Chinese Geographical Science 24: 287-296.). In most studies, citations of previous studies that would justify these timeframes are lacking.
In view of the diversity of diel patterns observed, it appears necessary to study the diel pattern of SR in different contexts before proposing a sampling approach. This is particularly true of the Sudano-Sahelian region where, no such study has been carried out to determine the diel pattern of SR that follows the first rains. This study set out to monitor SR for 24 h after a rainfall event that followed a long dry season and to propose the most appropriate sampling strategy to capture variations and provide the best estimate of SR over 24 h. It also aimed to determine the relationship between SR and soil temperature and moisture.
Materials and Methods
This study was carried out during the dry season in North Cameroon at Garoua (09°19' N, 13°21' E) on land farmed by smallholders. The study area has a Sudano-Sahelian climate, with a single rainy season from mid-May to mid-October. Between 2003 and 2013, mean annual rainfall ranged from 900 to 950 mm according to unpublished records from a company called “Sodecoton – la Société de développement du coton” (The Cotton Development Corporation), made available by experimental stations in Garoua. The first rains usually occur in May with precipitation ranging from 3 mm to 20 mm. The mean minimum air temperature during the dry season is 21 °C and the mean maximum 39 °C. Cotton (Gossypium hirsutum L.) and cereals crops, particularly maize (Zea mays L.) have been cultivated in rotation in this area, since 2001. Soils are often tilled by hand with a hoe. This study was conducted before these soil management techniques were implemented. The soil type is a ferruginous tropical soil (Haplic Luvisol) according to the World Reference Base classification (FAO, 2006)Food and Agriculture Organization [FAO]. 2006. World reference base for soil resources 2006: a framework for international classification, correlation and communication. FAO, Rome, Italy. p. 408.. The soil was well drained, poor in total C (2.5 mg g−1 of C) and total N (0.30 mg g−1 of N), and very sandy in the top layer (0-20 cm), as detailed inHarmand et al. (2004)Harmand, J.M.; Njiti, C.F.; Bernhard-Reversat, F.; Puig, H. 2004. Aboveground and belowground biomass, productivity and nutrient accumulation in tree improved fallows in the dry tropics of Cameroon. Forest Ecology and Management 188: 249-265..
Experimental design
The experimental design included two plots located on the same site. These two plots were each 2 m × 2 m and were 5 m apart. On each plot, one measurement point was chosen in the middle for the time series. There had been no rainfall for the previous three months. Plots were bare and without cover at the time of sampling. These plots were wetted gradually for 0.5 h at 10 L m−2, the equivalent of 10 mm of rain. This quantity of water was adjudged to be suitable for simulating the first rains in the area and allows for wetting the top 10 cm of soil. Soil respiration measurements started 30 minutes after wetting.
Measurement of SR and environmental factors
Soil respiration was measured using an automated soil CO2 flux system with polyvinyl chloride (PVC) collars (10 cm in diameter and 8-cm high). On each collar, a time series was measured taking into account one repetition per plot. The first time series in the first plot was taken starting on Mar 16, 2014 and the second series in the second plot on Mar 23, 2014. For each time series, measurements began in the morning at 06h00 and were taken every hour for 24-h.
The infrared gas analyzer recorded the increase in CO2 concentration in the chamber every second. The measurement time was limited to 90 s to limit the increase in concentration of CO2 in the chamber. Soil collars were inserted 4-5-cm deep in the soil as recommended by Davidson et al. (2002)Davidson, E.; Savage, K.; Verchot, L.; Navarro, R. 2002. Minimizing artifacts and biases in chamber-based measurements of soil respiration. Agricultural and Forest Meteorology 113: 21-37.. This was deep enough to ensure that the collar was stable and minimize underestimation of SR due to lateral diffusion of CO2 (Davidson et al., 2002Davidson, E.; Savage, K.; Verchot, L.; Navarro, R. 2002. Minimizing artifacts and biases in chamber-based measurements of soil respiration. Agricultural and Forest Meteorology 113: 21-37.). These PVC collars were installed two days before the start of the SR measurements to allow the disturbed surfaces to re-stabilize.
The soil temperature and moisture near each collar were measured at the same time as the SR. The soil temperature was measured at a depth of 10 cm using a soil temperature thermistor probe connected to the infrared gas analyzer and soil moisture was measured in the top 6 cm of soil, using a capacitive sensor connected to the infrared gas analyzer.
Data analysis
All statistical analyses were performed using R (V.3.0.3) and Statistica V.8 (Statsoft Inc. 2008). Multiple linear regression analysis was used to evaluate the relationship between SR, soil temperature, soil moisture and time. Comparison of the difference between the two time series corresponding to each plot and concerning soil respiration, soil temperature and soil moisture were investigated using a student test.
Results
24-hour variations in SR, soil temperature and moisture
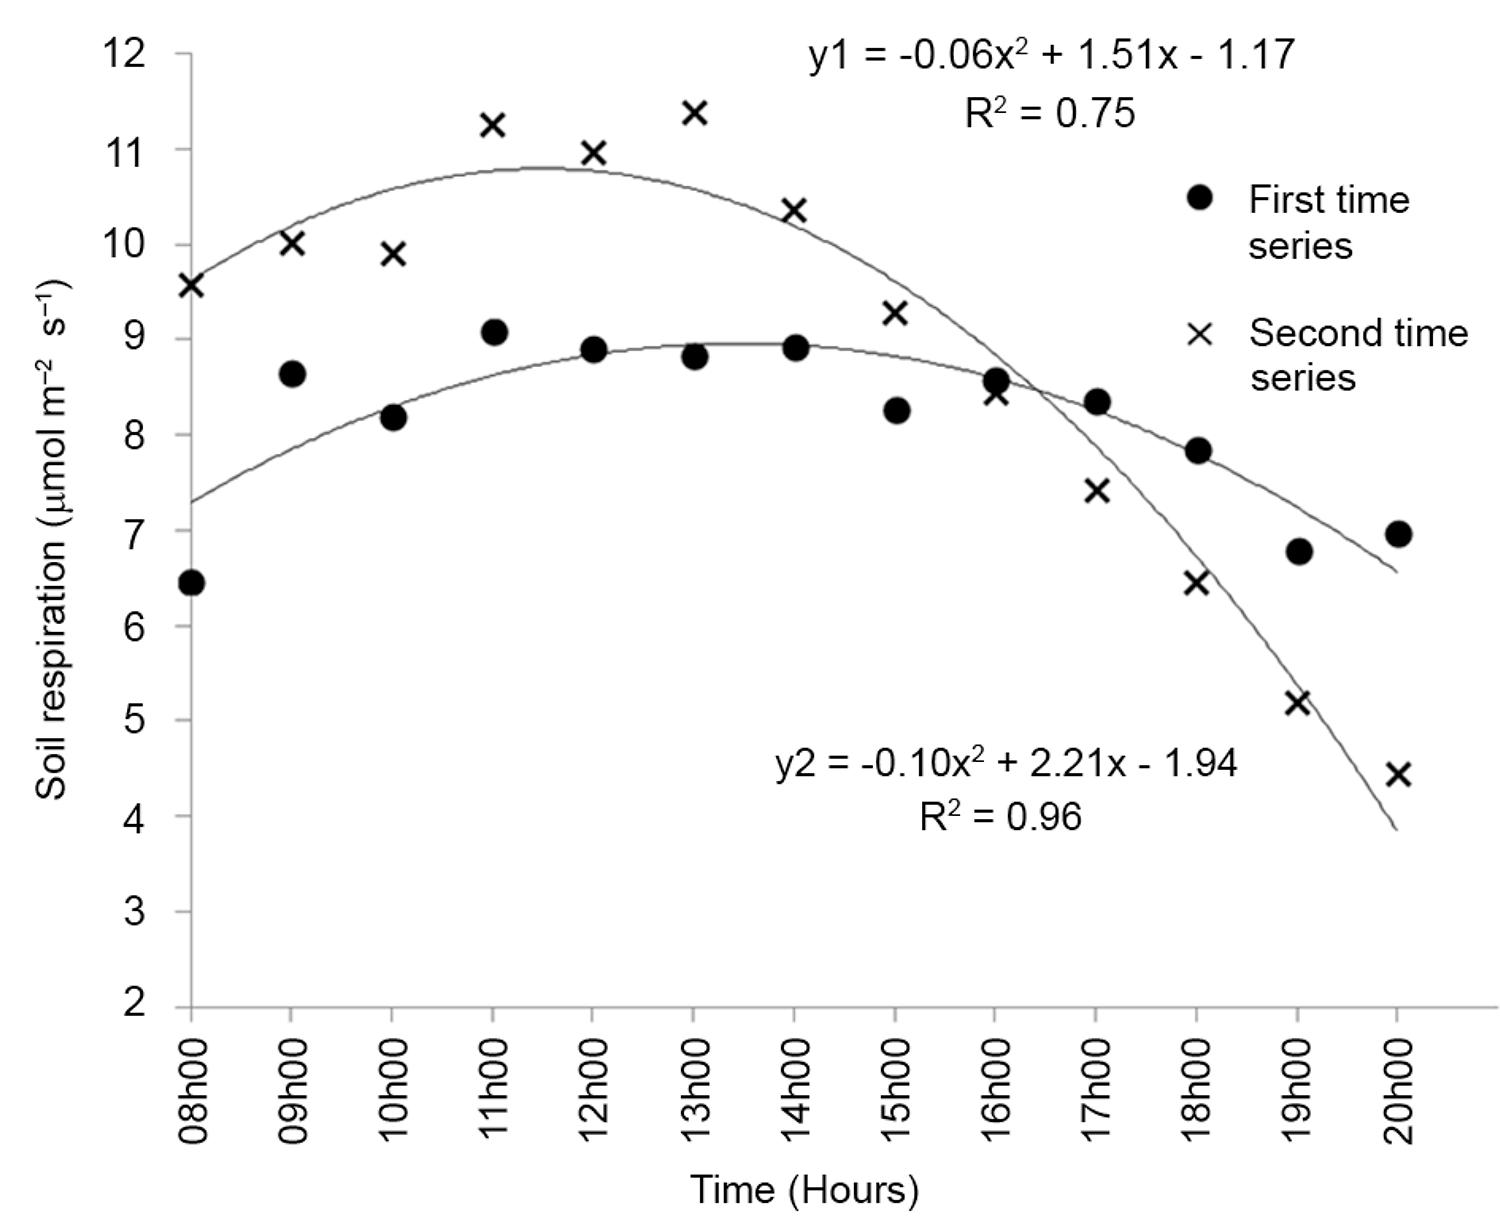
Soil respiration varied over 24 h for the two time series in the same site (Figure 1). Over the time series, the SR rates formed a curve during the day, coming close to linear at night. These SR rates increased in the morning, reached a maximum between 11h00 and 13h00, and then decreased gradually to the minimum around 06h00. Between the two time series, SR was not different (p > 0.05). The second time series had a maximum SR (11.29 µmol m−2 s−1) which was higher than the first series (9.10 µmol m−2 s−1), while minimum SR was lower in the second time series (2.04 µmol m−2s−1) compared to the first series (4.16 µmol m−2s−1). During the daytime, the mean rates of SR were 8.16 and 8.85 µmol m−2 s−1 of the first and second time series. The 24-h averages were 6.85 and 6.60 µmol m−2 s−1, for the first and second time series in the same site.
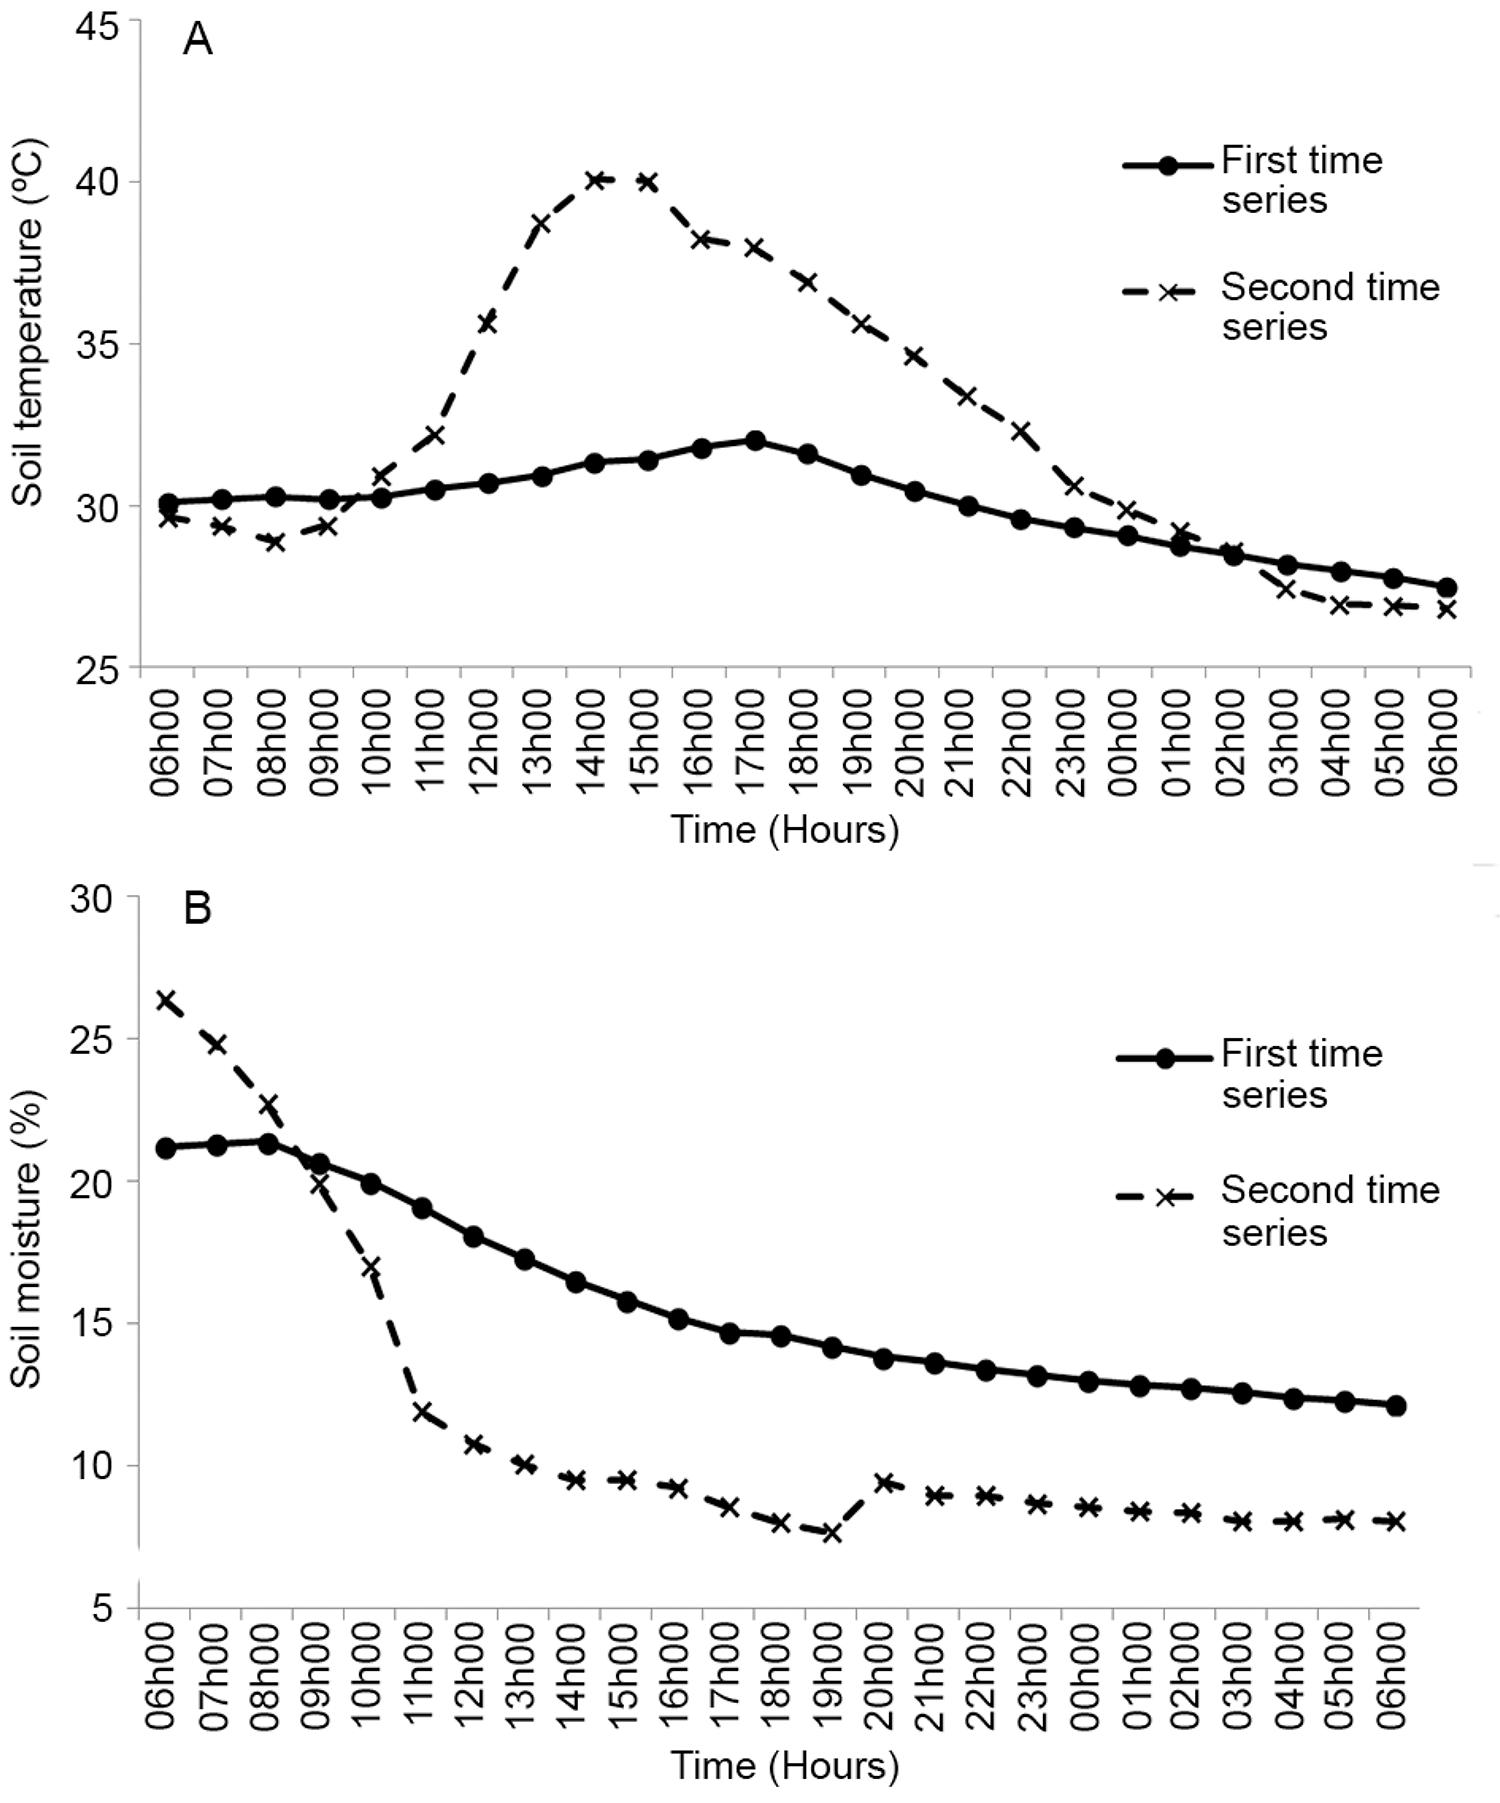
The soil temperatures at 10 cm varied over the 24-h for both the two time series (Figure 2A). Between these two time series, the soil temperature was different (p < 0.001) the average difference being 2.43 °C. The second time series had a maximum soil temperature (40.1 °C) which was higher than the first series (32.0 °C), while minimum soil temperature was lower in the second time series (26.8 °C) as compared to the first series (27.5 °C).
− 24-h variation of (A) soil temperature, (B) soil moisture during the first and second time series.
Soil moisture ,which varied over the 24-h and decreased over time (Figure 2B), was different between the two time series (p < 0.001). For both time series, the average soil moisture difference was 4 %. The second time series had a maximum soil moisture reading (26 %) higher than the first (21 %), while the minimum soil moisture reading was lower in the second times series (8 %) as compared to the first (13 %).
When estimating SR in the field the time series for the SR formed a curve during the daytime and were close to linear at nighttime, separate functions being used for each part of the day.
Polynomial functions
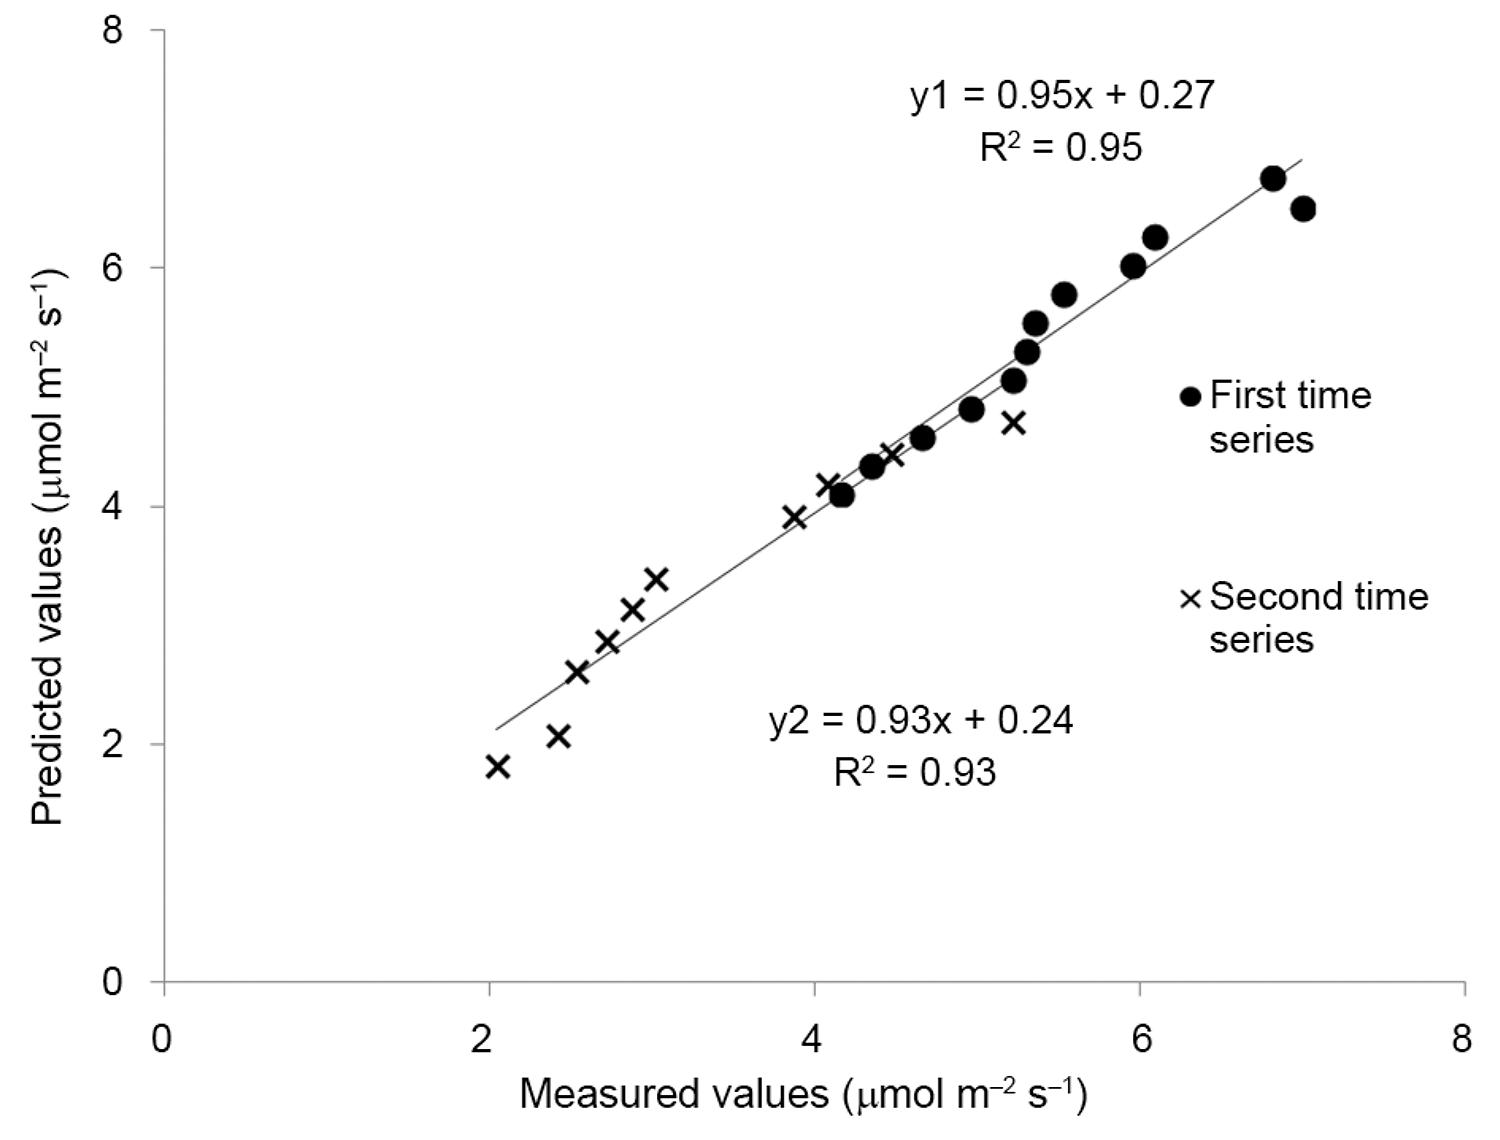
For both time series, the SR rates during the daytime (twelve hours starting from 08h00) were represented as second order polynomials (Figure 3). The functions were of the type SR = at2 + bt + c, where t is the time expressed in 24-hour format, in the range 8 to 20. All coefficients, except the constant term, were highly significant (p < 0.01), see Table 1. The values predicted by these functions were a good fit to the measured values (r2 = 0.75 and 0.96 for the first and second series, respectively) (Figure 4). The mean errors were -0.07 and 0.23 µmol m−2 s−1, i.e. less than 3 % of the mean observed SR observed.
Robustness of the polynomial functions
The polynomial functions were tested using a reduced number of data points to check their robustness.
The three measurements taken at 8h00, 14h00 and 20h00 were used to calculate second order polynomial functions providing a good fit between predicted and measured values. The functions were y1 = -0.06 ± 0.01x2 + 1.77 ± 0.35x - 3.70 ± 3.41 for the first time series and y2 = -0.09 ± 0.01x2 + 2.17 ± 0.30x -1.81 ± 1.92 for the second time series. The coefficients of each of these functions were well within the 95 % confidence interval of the coefficients based on the respective time series.
Linear functions
For both time series, the SR rates measured overnight allowed linear functions to be used (Figure 5). The functions were SR = at + b, where t is the time in hours with 19h00 being zero. The time periods overlapped so that the measurements for fitting the end of the quadratic were also used for determining the linear slope. All coefficients were highly significant (p < 0.01), see Table 1. The values predicted by these functions were a good fit to the measured values (r2 = 0.95 and 0.93 for the first and second series, respectively) (Figure 6). The mean errors were 0.13 and 0.27 µmol m−2 s−1, i.e. less than 8 % of the mean nighttime SR observed.
Robustness of the linear functions
The linear functions were tested using a reduced number of data points to check their robustness. The measurements taken at the beginning of the night period (19h00 and 20h00) and at the end of the night period (05h00 and 06h00) were used to calculate linear function and provided a good fit between predicted and measured values. The functions were y1 = -0.26 ± 0.02x + 7.02 ± 0.17 for the first time series and y2 = -0.26 ± 0.02x + 4.99 ± 0.18 for the second time series. The coefficients of each of these functions were well within the 95 % confidence interval of the coefficients based on the time series.
Effects on SR of soil temperature, soil moisture, and time of measurement
The soil temperature and soil moisture both affected the 24-hour variations of SR. Multiple linear regression of SR against both soil temperature and soil moisture produced a model (all coefficients having a p < 0.01) with r2 being 0.98 and 0.73 for the first and second time series respectively. The time of the measurement explained the remaining variation in the SR rates.
Discussion
24-h variation of SR, soil temperature and moisture
This study showed a 24-h variation in SR after wetting, during a dry period. This 24-h variation was obtained in agro-ecosystems in a temperate climate (Shi et al., 2006Shi, P.L.; Zhang, X.Z.; Zhong, Z.M.; Ouyang, H. 2006. Diurnal and seasonal variability of soil CO2 efflux in a cropland ecosystem on the Tibetan Plateau. Agricultural and Forest Meteorology 137: 220-233.), an arid climate (Li et al., 2011Li, Z.G.; Wang, X.J.; Zhang, R.H.; Zhang, J.; Tian, C.Y. 2011. Contrasting diurnal variations in soil organic carbon decomposition and root respiration due to a hysteresis effect with soil temperature in a Gossypium s. (cotton) plantation. Plant and Soil 343: 347-355.) and a Mediterranean climate (Xu and Qi, 2001Xu, M.; Qi, Y. 2001. Soil-surface CO2 efflux and its spatial and temporal variations in a young ponderosa pine plantation in northern California. Global Change Biology 7: 667-677.). These authors explain this process as a function of soil temperature because this is a variable that changes considerably in the course of a day (Rayment and Jarvis, 2000Rayment, M.; Jarvis, P. 2000. Temporal and spatial variation of soil CO2 efflux in a Canadian boreal forest. Soil Biology and Biochemistry 32: 35-45.). However, in our study, the soil moisture also changed considerably over 24 h which may have had a major effect on soil microbial activity. As a consequence, SR showed a diel cycle which is probably due to changes in soil temperature and soil moisture. The amplitude of the variation in SR is explained by the amplitude of the soil temperature and moisture during the day. The second time series had a maximum respiration higher than the first time series which is consistent with an increase in SR as the soil temperature increases. However, the SR rates during the nighttime seem to be more dependent on soil moisture.
Between the time series there was no difference in SR (p > 0.05). This could be explained by the fact that the measurements were carried out on the same site and there would be little variability in the soil carbon of the two plots. Between these two time series, the soil temperature was different (p < 0.05). This difference in soil temperature between the two time series may be related to the air temperature on the two days of measurements. The soil moisture difference between the two time series could be explained by the difference in soil temperature which was higher in the second time series and consequently produced low soil moisture.
Method for estimating the mean SR in the field
A second order polynomial function provided a close fit for the mean SR during the daytime. A second order polynomial calculated using SR measurements taken at 8h00, 14h00 and 20h00 gave a representative curve of the SR from 08h00 to 20h00, providing a close estimate of the average SR for the period. Other methods have been used to determine the mean daily SR in field conditions without paying particular attention to the occurrence of rainfall events (Table 2). In pastures, Fernandes et al. (2002)Fernandes, S.A.P.; Bernoux, M.; Cerri, C.C.; Feigl, B.J.; Piccolo, M.C. 2002. Seasonal variation of soil chemical properties and CO2 and CH4 fluxes in unfertilized and P-fertilized pastures in an Ultisol of the Brazilian Amazon. Geoderma 107: 227-241. measured the SR at 07h00, midday and 17h00 which correspond to the minimum, intermediate and maximum air and soil temperature. In the state of Rondonia, Brazil, the climate was humid tropical, with an annual precipitation of 2,200 mm and a dry season from Jun to Sep annual mean temperature was 25.5 °C with a seasonal variation less than 5 °C. The soil was an Ultisol, classified as Haplic Acrisol in the World Reference Base classification (FAO, 2006Food and Agriculture Organization [FAO]. 2006. World reference base for soil resources 2006: a framework for international classification, correlation and communication. FAO, Rome, Italy. p. 408.). In seven forests located in Rondônia, Garcia-Montiel et al. (2004)Garcia-Montiel, D.C.; Melillo, J.M.; Steudler, P.A.; Tian, H.; Neill, C.; Kicklighter, D.W.; Feigl, B.; Piccolo, M.; Cerri, C.C. 2004. Emissions of N2O and CO2 from terra firme forests in Rondônia, Brazil. Ecological Applications 14: 214-220. measured the SR in the early morning (between 06h00-09h00) and in the afternoon (14h00-15h00). In this region, mean annual temperatures have varied between 18.8 °C and 25 °C, with seasonal variations of less than 4 °C. The soil type was a Haplic Ferralsol according to the World Reference Base classification (FAO, 2006Food and Agriculture Organization [FAO]. 2006. World reference base for soil resources 2006: a framework for international classification, correlation and communication. FAO, Rome, Italy. p. 408.). Our results did not agree with those obtained in these ecosystems (Fernandes et al., 2002Fernandes, S.A.P.; Bernoux, M.; Cerri, C.C.; Feigl, B.J.; Piccolo, M.C. 2002. Seasonal variation of soil chemical properties and CO2 and CH4 fluxes in unfertilized and P-fertilized pastures in an Ultisol of the Brazilian Amazon. Geoderma 107: 227-241.; Garcia-Montiel et al., 2004Garcia-Montiel, D.C.; Melillo, J.M.; Steudler, P.A.; Tian, H.; Neill, C.; Kicklighter, D.W.; Feigl, B.; Piccolo, M.; Cerri, C.C. 2004. Emissions of N2O and CO2 from terra firme forests in Rondônia, Brazil. Ecological Applications 14: 214-220.). The difference between our results and others could be explained by differences in temperature variation, soil moisture (precipitation) and also soil variation between these regions and our study area. In our study, the use of the methods developed by these authors did not provide the best estimate of the mean daily value of SR. 08h00, 14h00 and 20h00 were the optimum times to measure SR for the purpose of estimating the mean daytime SR.
Soil respiration rates measured at 19h00, 20h00, 05h00 and 06h00 were used to estimate the mean SR during the night. A linear function provided a close fit for the mean SR during the night. The two measurements at the beginning and the end of the night provided the best estimates of the mean nighttime SR (Table 2). Taking measurements at night using a manual chamber is not usually practical. Using two measurements only at the beginning and end of the night makes it easier to estimate the mean nighttime SR. When considering the 24-h period, Wang et al. (2014)Wang, M.; Xingtu, L.; Jitao, Z.; Xiujun, L.; Guodong, W.; Xiaoyu, L.; Xinrui, L. 2014. Diurnal and seasonal dynamics of soil respiration at temperate Leymus Chinensis meadow steppes in western Songnen Plain, China. Chinese Geographical Science 24: 287-296. reported that SR rates measured between 07h00 and 09h00, or between 17h00 and 19h00, were similar and representative of the mean diel value. In our study, the averages proposed by Wang et al. (2014)Wang, M.; Xingtu, L.; Jitao, Z.; Xiujun, L.; Guodong, W.; Xiaoyu, L.; Xinrui, L. 2014. Diurnal and seasonal dynamics of soil respiration at temperate Leymus Chinensis meadow steppes in western Songnen Plain, China. Chinese Geographical Science 24: 287-296. were, for the first and second time series respectively, 7.57 and 9.82 µmol m−2 s−1 for the morning period and 7.68 and 6.38 µmol m−2 s−1 for the afternoon period. This approach would, therefore, fail in the case of the second time series. Furthermore, for the first time series, even though the two averages were similar, they were not both representative of the 24-h average (6.85 µmol m−2 s−1).
Effects on SR of soil temperature, soil moisture, and time of measurement
The diel variation of SR was explained by variations in the soil temperature and soil moisture, and the time of measurement. Soil temperature and moisture together explained at least 73 % of the 24-h variations observed. Our results did not agree with other studies which attribute 24-h variations to changes in soil temperature only (Xu and Qi, 2001Xu, M.; Qi, Y. 2001. Soil-surface CO2 efflux and its spatial and temporal variations in a young ponderosa pine plantation in northern California. Global Change Biology 7: 667-677.). These authors measured the diurnal variation of soil respiration in a Mediterranean climate. Annual precipitation was 1660 mm and the average daily temperature varied from 0.6 °C in Jan to 28.3 °C in July. The difference between our results and theirs’ could be explained by the differences in temperature variations between this region and our study area. In our study, the air temperature was high and varied from 21 °C to 39 °C. However, soil respiration is also correlated with soil moisture. This soil moisture varied over time.
Soil temperature and soil moisture were the two main factors that explain the diel variation of SR but they did not explain all the variations observed. After taking into account soil temperature and soil moisture, it is the time of measurement that appears to explain the residual variation. Therefore, SR appears to have a circadian rhythm. However, soil respiration after wetting may be related to physical aspects, not just biological. Indeed, the physical aspects such as soil porosity, influence the production and transport of CO2 emissions from soil (Šimůnek and Suarez, 1993Šimůnek, J.; Suarez, D.L. 1993. Modeling of carbon dioxide transport and production in soil. 1. Model development. Water Resources Research 29: 487-497.).
Our observations were used to propose a method for estimating the mean daytime and nighttime SR after wetting the soil. This method based on measurements at specific times over a 24-hour period appears to be applicable to the period when microbial activity is recovering after a dry period. However, measurements should be taken at the same times during the day to estimate the daily mean SR. Proxies such as temperature and soil moisture could be useful for predicting SR. However, a large dataset is required if the SR model is to be calibrated and validated.
Conclusion
Over 24-h, soil respiration rates followed a quadratic curve during the day coming close to linear at night. The method proposed here has the advantage of being based on a small number of measurements and is, therefore, easier to implement in the monitoring of SR after the first rains following a long dry period. These events are difficult to predict. The method also distinguishes between daytime and nighttime measurements, which can be useful for comparison with other field studies, most of which are limited to daytime measurements.
Acknowledgements
This research was partly financed by the Cameroon C2D project, International Cooperation Centre in Agronomic Research for Development (CIRAD), Research Institute for Development (IRD) and the Carbon Soils for Sustainable Agriculture in Africa (CaSA) network funded by the French Ministry of Foreign Affairs and International Development. In particular, we than Celestin Klassou, Marc Pansu and the Fabatropimed Project for field support. We also thank the anonymous reviewers for their valuable contributions.
References
- Betson, N.R.; Gottlicher, S.G.; Hall, M.; Wallin, G.; Richter, A.; Hogberg, P. 2007. No diurnal variation in rate or carbon isotope composition of soil respiration in a boreal forest. Tree Physiology 27: 749-756.
- Buchmann, N. 2000. Biotic and abiotic factors controlling soil respiration rates in Picea abies stands. Soil Biology and Biochemistry 32: 1625-1635.
- Chevallier, T.; Blanchart, E.; Albrecht, A.; Feller, C.; Bernoux, M. 2006. Impact of pasture establishment on CO2 emissions from a Vertisol: consequences for soil C sequestration (Martinique, West Indies). Canadian Journal of Soil Science 86: 779-782.
- Davidson, E.; Savage, K.; Verchot, L.; Navarro, R. 2002. Minimizing artifacts and biases in chamber-based measurements of soil respiration. Agricultural and Forest Meteorology 113: 21-37.
- Food and Agriculture Organization [FAO]. 2006. World reference base for soil resources 2006: a framework for international classification, correlation and communication. FAO, Rome, Italy. p. 408.
- Fernandes, S.A.P.; Bernoux, M.; Cerri, C.C.; Feigl, B.J.; Piccolo, M.C. 2002. Seasonal variation of soil chemical properties and CO2 and CH4 fluxes in unfertilized and P-fertilized pastures in an Ultisol of the Brazilian Amazon. Geoderma 107: 227-241.
- Garcia-Montiel, D.C.; Melillo, J.M.; Steudler, P.A.; Tian, H.; Neill, C.; Kicklighter, D.W.; Feigl, B.; Piccolo, M.; Cerri, C.C. 2004. Emissions of N2O and CO2 from terra firme forests in Rondônia, Brazil. Ecological Applications 14: 214-220.
- Harmand, J.M.; Njiti, C.F.; Bernhard-Reversat, F.; Puig, H. 2004. Aboveground and belowground biomass, productivity and nutrient accumulation in tree improved fallows in the dry tropics of Cameroon. Forest Ecology and Management 188: 249-265.
- Hirano, T. 2005. Seasonal and diurnal variations in topsoil and subsoil respiration under snowpack in a temperate deciduous forest. Global Biogeochemical Cycles 19: GB2011.
- Larionova, A.; Rozonova, L.; Samoylov, T. 1989. Dynamics of gas exchange in the profile of a gray forest soil. Soviet Soil Science 3: 104-110.
- Li, Z.G.; Wang, X.J.; Zhang, R.H.; Zhang, J.; Tian, C.Y. 2011. Contrasting diurnal variations in soil organic carbon decomposition and root respiration due to a hysteresis effect with soil temperature in a Gossypium s. (cotton) plantation. Plant and Soil 343: 347-355.
- Liang, Y.; Bai, C.; Mu, L.; Zhou, M. 2014. Soil respiration in cucumber field under crop rotation in solar greenhouse. Scientia Agricola 71: 337-341.
- Rayment, M.; Jarvis, P. 2000. Temporal and spatial variation of soil CO2 efflux in a Canadian boreal forest. Soil Biology and Biochemistry 32: 35-45.
- Schimel, D.S. 1995. Terrestrial ecosystems and the carbon cycle. Global Change Biology 1: 77-91.
- Schlesinger, W.H.; Andrews, J.A. 2000. Soil respiration and the global carbon cycle. Biogeochemistry 48: 7-20.
- Shi, P.L.; Zhang, X.Z.; Zhong, Z.M.; Ouyang, H. 2006. Diurnal and seasonal variability of soil CO2 efflux in a cropland ecosystem on the Tibetan Plateau. Agricultural and Forest Meteorology 137: 220-233.
- Šimůnek, J.; Suarez, D.L. 1993. Modeling of carbon dioxide transport and production in soil. 1. Model development. Water Resources Research 29: 487-497.
- Sotta, E.D.; Meir, P.; Malhi, Y.; Hodnett, M.; Grace, J. 2004. Soil CO2 efflux in a tropical forest in the central Amazon. Global Change Biology 10: 601-617.
- Teixeira, D.D.B.; Bicalho, E.D.S.; Panosso, A.R.; Cerri, C.E.P.; Pereira, G.T.; La Scala Júnior, N. 2013. Spatial variability of soil CO2 emission in a sugarcane area characterized by secondary information. Scientia Agricola 70: 195-203.
- Wang, M.; Xingtu, L.; Jitao, Z.; Xiujun, L.; Guodong, W.; Xiaoyu, L.; Xinrui, L. 2014. Diurnal and seasonal dynamics of soil respiration at temperate Leymus Chinensis meadow steppes in western Songnen Plain, China. Chinese Geographical Science 24: 287-296.
- Widen, B.; Majdi, H. 2001. Soil CO2 efflux and root respiration at three sites in a mixed pine and spruce forest: seasonal and diurnal variation. Canadian Journal of Forest Research 31: 786-796.
- Xu, M.; Qi, Y. 2001. Soil-surface CO2 efflux and its spatial and temporal variations in a young ponderosa pine plantation in northern California. Global Change Biology 7: 667-677.
Edited by
Publication Dates
-
Publication in this collection
Sep-Oct 2015
History
-
Received
04 Dec 2014 -
Accepted
02 Apr 2015