ABSTRACT
Cottonseed coproducts contain gossypol which can have specific effects upon the male reproductive system. We evaluated the reproductive development of male lambs close to puberty fed on three cotton coproducts. Twenty-four 5-month old male lambs received four diets: 20 % of dry matter intake of whole cottonseed (WCS), high oil cottonseed meal (CSC), cottonseed meal (CSM), and a control group (CTL) without any cottonseed coproducts. Free gossypol intake was 16.32, 6.98, 5.47 and 0 mg kg−1 BW−1 d−1 for WCS, CSC, CSM and CTL, respectively. Every 15 days, the animals were weighted and serum and semen samples were collected. After 95 days, testis samples were collected for analysis under light and transmission electron microscopes. The CTL group had higher testosterone concentrations than CSC at the end of the trial and lower total sperm defects, higher mass movement and higher scores for seminiferous epithelium than other treatments. The WCS and CSC groups showed higher levels of segmental aplasia lesion in sperm than other diets, which showed that high levels of gossypol led to higher occurrence of this lesion. Cottonseed coproducts had a negative impact on the reproductive system of pubertal lambs regardless of gossypol concentration. Therefore, the use of cottonseed coproducts to feed lambs earmarked for reproduction is not safe.
Keywords:
gossypol; sperm; testis; testosterone; lamb
Introduction
Brazilian cottonseed production in 2014 was 1,672.300 t and it is expected that production will grow at 3 % yr−1 until 2024 (MAPA, 2014Ministério da Agricultura, Pecuária e Abastecimento [MAPA]. 2014. Agrobusiness Projections: Brazil 2013/2014 a 2023/2024 - Long Term Projections = Projeções do Agronegócio: Brasil 2013/2014 a 2023/2024 - Projeções de Longo Prazo. MAPA/ACS, Brasília, DF, Brazil (in Portuguese).), which indicates abundant availability of cottonseed coproducts. This stands out as an alternative source of protein and energy for animal diets, which can reduce cost.
However, a major limitation for using these coproducts in animal nutrition is high levels of gossypol. Studies on humans (Coutinho, 2002Coutinho, E.M. 2002. Gossypol: a contraceptive for men. Contraception 65: 259-263.), monkeys (Shandilya et al., 1982Shandilya, L.; Clarkson, T.B.; Adams, M.R.; Lewis, J.C. 1982. Effects of gossypol on reproductive and endocrine functions of male cynomolgus monkeys (Macaca fascicularis). Biology of Reproduction 27: 241-252.) and rats (Chang et al., 1980Chang, M.; Gu, Z.; Saksena, S. 1980. Effects of gossypol on the fertility of male rats, hamsters and rabbits. Contraception 21: 461-469.; Oko and Hrudka, 1982Oko, R.; Hrudka, F. 1982. Segmental aplasia of the mitochondrial sheath and sequelae induced by gossypol in rat spermatozoa. Biology of Reproduction 26: 183-195., 1984bOko, R.; Hrudka, F. 1984b. Gossypol-induced early and delayed-effects in the seminiferous epithelium of the adult-rat. Contraceptive Delivery Systems 5: 335-356.) have indicated that gossypol can have particular effects upon the male reproductive system, resulting in impaired spermatogenesis and reduced sperm motility. The gossypol effect on the endocrine system is not clear and few studies have evaluated it (De Andrade et al., 2006De Andrade, S.F.; Oliva, S.U.; Klinefelter, G.R.; De Grava Kempinas, W. 2006. Epididymis-specific pathologic disorders in rats exposed to gossypol from weaning through puberty. Toxicol Pathology 34: 730-737.). Furthermore, gossypol is considered a promising drug for male contraception in humans (Coutinho, 2002Coutinho, E.M. 2002. Gossypol: a contraceptive for men. Contraception 65: 259-263.).
The toxicity level of gossypol is considered low in ruminants, because the rumen environment promotes binding of free gossypol to proteins, which renders it physiologically inactive (Reiser and Fu, 1962Reiser, R.; Fu, H. 1962. Mechanism of gossypol detoxification by ruminant animals. Journal of Nutrition 76: 215-8.). However, studies with ruminants have shown a wide variety of results, ranging from minimal (Chase et al., 1994Chase, C.; Bastidas, P.; Ruttle, J.; Long, C.; Randel, R. 1994. Growth and reproductive development in Brahman bulls fed diets containing gossypol. Journal of Animal Science 72: 445-452.) to severe pathological effects (Randel et al., 1992Randel, R.; Chase, C.; Wyse, S. 1992. Effects of gossypol and cottonseed products on reproduction of mammals. Journal of Animal Science 70: 1628-1638.; Chenoweth et al., 1994Chenoweth, P.; Risco, C.; Larsen, R.; Velez, J.; Tran, T.; Chase, C. 1994. Effects of dietary gossypol on aspects of semen quality, sperm morphology and sperm production in young Brahman bulls. Theriogenology 42: 1-13.). For example, whole cottonseed fed to deer was considered an efficient male contraceptive due to low semen quality during treatment and full recovery the following year (Gizejewski et al., 2008Gizejewski, Z.; Szafranska, B.; Steplewski, Z.; Panasiewicz, G.; Ciereszko, A.; Koprowski, H. 2008. Cottonseed feeding delivers sufficient quantities of gossypol as a male deer contraceptive. European Journal of Wildlife Research 54: 469-477.).
Certain studies using cotton coproducts failed to demonstrate a relationship between higher gossypol concentration and more severe seminal pathologies. This may indicate that the availability of free gossypol may differ between feedstuffs (Chase et al., 1994Chase, C.; Bastidas, P.; Ruttle, J.; Long, C.; Randel, R. 1994. Growth and reproductive development in Brahman bulls fed diets containing gossypol. Journal of Animal Science 72: 445-452.). The majority of gossypol toxicity and cottonseed coproduct feeding trials used postpubertal males. Few studies, mainly using bulls and rats (Chase et al., 1994Chase, C.; Bastidas, P.; Ruttle, J.; Long, C.; Randel, R. 1994. Growth and reproductive development in Brahman bulls fed diets containing gossypol. Journal of Animal Science 72: 445-452.; De Andrade et al., 2006De Andrade, S.F.; Oliva, S.U.; Klinefelter, G.R.; De Grava Kempinas, W. 2006. Epididymis-specific pathologic disorders in rats exposed to gossypol from weaning through puberty. Toxicol Pathology 34: 730-737.) and none with sheep, have evaluated the effect of feeding gossypol to prepubertal males. De Andrade et al. (2006)De Andrade, S.F.; Oliva, S.U.; Klinefelter, G.R.; De Grava Kempinas, W. 2006. Epididymis-specific pathologic disorders in rats exposed to gossypol from weaning through puberty. Toxicol Pathology 34: 730-737. argued that the pubertal phase is especially vulnerable and gossypol may provoke more damage. On the other hand, Chase et al. (1994)Chase, C.; Bastidas, P.; Ruttle, J.; Long, C.; Randel, R. 1994. Growth and reproductive development in Brahman bulls fed diets containing gossypol. Journal of Animal Science 72: 445-452. showed that gossypol did not affect semen quality at puberty, which demonstrates that the effect of feeding gossypol to prepubertal males on subsequent reproductive development is not clear. Therefore, we evaluated the effect of feeding three cotton coproducts with different gossypol concentrations on reproductive development in lambs close to puberty.
Materials and Methods
Animals, feeds and experimental design
Twenty-four Santa Inês male lambs with mean body weight (standard error) equal to 20.6 (± 1.9) kg and initial age of 5 months were housed in individual covered pens with a concrete floor. Animals were divided equally into four groups and fed the following diets (Table 1): whole cottonseed (WCS); pressure-extracted cottonseed meal with high oil (CSC); solvent-extracted cottonseed meal with low oil (CSM) and control (without cottonseed co-products, CTL).
Ingredients (g kg−1 of dry matter of concentrate), chemical composition (on dry matter basis) of each ingredient of diet and free gossypol content in the experimental concentrates.
The study was carried out in Brasília, Federal District, Brazil (15°47′ S; 47°56′ WGr, altitute of 1172 m). The University Animal Ethics Committee (protocol 33/2009) approved this experiment. The experimental period lasted 95 days and was preceded by an adaptation period of 14 days. The diets were elaborated according to NRC (2007) for a daily body weight gain of 200 g d−1 (Table 1). The ratio concentrate:forage was 50:50 in dry matter basis and Coast cross (Cynodon dactylon (L.) Pers) hay was used as forage. Mineral salt and urea were added to concentrate in the same amount for all groups. According to bromatological analysis of each diet ingredient, soybean oil was added to the concentrate in CSC, CSM and CTL, aiming to equalize the ether extract. The determination of free gossypol concentrations in the diet were achieved through the UV-VIS spectrophotometry method adapted from Wang (1987)Wang, M. 1987. Analysis of gossypol by high-performance liquid chromatography. Journal of Ethnopharmacology 20: 1-11..
The animals were fed twice daily, morning (8h00) and afternoon (17h00). The amount of feed offered was adjusted according to animal consumption, to achieve leftovers equal to 10 % of the feed offered. Animals were weighed fortnightly after 10 hours fasting.
Hormone assays
Fortnightly at 9h00, blood samples were collected to determine cortisol and free testosterone concentrations employing radioimmunoassay commercial kits (DPC Medlab Coat-A-Count). The raw data in cpm (counts per minute) obtained by gamma counter were analyzed by the logit-log plot develop by Rodbard and Lewald (1970)Rodbard, D.; Lewald, J. 1970. Computer analysis of radioligand assay and radioimmunoassay data. Acta Endocrinologica 65: S79-S103. cited by Geiger (1992)Geiger, P. 1992. Radioimmunoassay data handling and calculations with a graphics statistics computer-program. Biochemical Medicine and Metabolic Biology 48: 74-80.. All samples and standards were measured in duplicates. The ranges of calibration curves were 0.63 to 52 pg mL−1 for free testosterone and 1 to 46 µg 100 mL−1 for cortisol. The average intra-assay coefficient of variation was 10 % for testosterone and 5 % for cortisol, and inter-assay coefficients were 18 % for testosterone and 5 % for cortisol.
Seminal parameters
The scrotal size (circumference, length and width) was measured fortnightly. At the same time, semen samples were collected through eletroejaculation and seminal parameters evaluated according to the Manual for Andrological Examination and Semen Evaluation (BCAR − Brazilian College of Animal Reproduction). The volume, mass movement (0 to 5) and semen aspect were determined by observation in the collector tube. Then, under light microscopy, fresh sperm drop was evaluated for progressive motility (%) and vigor (0 to 5). Semen samples were fixed in buffered formal-saline (1 %) to evaluate sperm morphology and concentration under a contrast phase microscope (wet solution, 1000x). Sperm concentration was performed using a Neubauer chamber, adjusting the result to the dilution used. Morphology was evaluated by looking at 200 spermatozoa per sample to determine the proportion of abnormal spermatozoa: head shape defects (underdeveloped, irregular contour, neck, small and large heads), acrosome defects (reacted, vesicular, detached and bent), midpiece (cracked, gap, bent, thick, notch, broken, abaxial, irregular and pseudodroplet), and tail defects (simple and strongly bent, coiled, proximal and distal droplet as well as coiled around head) (Larsen and Chenoweth, 1990Larsen, R.; Chenoweth, P. 1990. Diadem crater defects in spermatozoa from 2 related angus bulls. Molecular Reproduction and Development 25: 87-96.; Chenoweth et al., 1994Chenoweth, P.; Risco, C.; Larsen, R.; Velez, J.; Tran, T.; Chase, C. 1994. Effects of dietary gossypol on aspects of semen quality, sperm morphology and sperm production in young Brahman bulls. Theriogenology 42: 1-13.).
Light microscopy analyses
At the end of the experimental period, the animals were slaughtered and samples of testis were collected. Four samples from each testis were stored in formaldehyde solution (10 %), then embedded in paraffin, cut at a thickness of 3 µm and stained with hematoxylin and eosin. Digital capture of images was performed under microscope coupled with a colored digital CCD camera. A total of five images were taken per animal and, from each image, five randomly chosen seminiferous tubules were analyzed, totaling 25 tubules analyzed per animal (McManus et al., 2010McManus, C.; Sasaki, L.C.B.; Louvandini, H.; Dias, L.T.; Teixeira, R.A.; Alves, J.M.; Lucci, C.M.; Marsiaj, P.H.P.; Murata, L.S. 2010. Histological evaluation of Santa Ines sheep testicles born in different seasons. Ciência Rural 40: 366-372 (in Portuguese, with abstract in English).). The diameter of tubule and lumen were measured at two points of each seminiferous tubule, using the MICAM® software (version 1.4). The seminiferous epithelium thickness was obtained by the difference between the lumen and tubule diameters.
Transmission electron microscopy analyses
Two testis samples (1 mm thick) from each animal were fixed in Karnovisky's fixative (2.5 % glutaraldehyde, 2 % paraformaldehyde, 0.1 M phosphate buffer, pH 7.2) and stored at 4 °C. Samples were rinsed in cacodylate buffer, cut into smaller pieces and post-treated in 1 % osmium tetroxide for 1 h, and uranyl acetate overnight at 4 °C. Tissue blocks were then dehydrated by exposure to graded concentrations of acetone (30, 50, 70, 90 and 100 %) and embedded in low viscosity resin. The ultrathin sections (80 nm) were placed on uncoated copper grids (200 mesh), counterstained with uranyl acetate and lead citrate. The sections were examined under a transmission electron microscope at 80 kV. Image analysis was carried out whereby three scores for each grid were given, without previous knowledge of animal identification to avoid bias. Sertoli cells were scored (1 to 10) according to shape, size, vacuolization degree, mitochondria and other abnormalities. Spermatogonial cell lineage (spermatogonia, spermatocytes and spermatids) received a score (1 to 10) which considered the presence of layers representing the seminiferous cycle stages and the integrity of cells (Wrobel et al., 1995Wrobel, K.; Reichold, J.; Schimmel, M. 1995. Quantitative morphology of the ovine seminiferous epithelium. Annals of Anatomy-Anatomischer Anzeiger 177: 19-32.; Steger and Wrobel, 1996Steger, K.; Wrobel, K. 1996. Postnatal development of ovine seminiferous tubules: an electron microscopical and morphometric study. Annals of Anatomy-Anatomischer Anzeiger 178: 201-213.). Lower scores meant a high number of defects. The spermatozoa in tubule lumen were evaluated for presence or absence (1 or 0) of segmental aplasia of the mitochondrial sheath (often abbreviated to SAMT) which is considered a gossypol-induced sperm abnormality (Oko and Hrudka, 1982Oko, R.; Hrudka, F. 1982. Segmental aplasia of the mitochondrial sheath and sequelae induced by gossypol in rat spermatozoa. Biology of Reproduction 26: 183-195.; Chenoweth et al., 2000Chenoweth, P.; Chase, C.; Risco, C.; Larsen, R. 2000. Characterization of gossypol-induced sperm abnormalities in bulls. Theriogenology 53: 1193-1203.).
Semen from the last collection in the experimental period was also collected for evaluation by transmission electron microscopy (TEM). The preparation procedure was similar to that used for the testis samples, except that a prior step was carried out where semen was embedded in a polymer. Spermatozoa were given a score (1 to 10) according to the number of abnormalities found (named forward as SIS). The highest score (10) meant that no sperm defects had been found. The mitochondrial sheaths were analyzed to identify the segmental aplasia (named forward as SAMS), so if this lesion was identified the grid received “1” and, if not, “0”.
Statistical analyses
The average daily weight gain (ADG) was obtained by linear regression of weight per day of experiment for each animal and angular coefficient (b) was used in the analysis of variance using the MIXED procedure from SAS® (Statistical Analysis System, version 9.3). ADG was submitted to a regression analysis considering the gossypol level, testing linear and quadratic effects.
The hormone results were analyzed as repeated measures using the MIXED procedure. Treatment (t), days of experiment (d) and interaction between them (t*d) were used as fixed effects and animal as a random variable.
Vigor and mass movement were analyzed by the Kruskal-Wallis test using the NPAR1WAY procedure of SAS®. The sperm pathologies were analyzed by MIXED procedure fitting as fixed effects: t, d and t*d; and animal (inside treatment) as random effect. Sperm volume, motility, concentration and scrotal size (circumference, length and width) were analyzed as repeated measures using the MIXED procedure. Regression analysis between these traits and the gossypol level in diet (linear and quadratic effect) was carried out. Finally, a factor analysis was used to verify the relationship between these variables.
Analysis of variance for seminiferous tubules measures was carried out using treatment, photo, tubule inside photo, and final weight of animal as fixed effects. Correlations, regression with the gossypol level in diet, and factor analysis were carried out. The scores obtained in testis and semen samples observed in TEM were evaluated using a logistic regression testing effect of treatment, using contrast between each pair of treatments, and also effect of the gossypol level in diet (linear, quadratic and cubic regression). Correlation and factor analysis also were applied to this data.
Normality of residuals and homogeneity of variance tests were performed on raw data. Transformations were carried out where necessary. The results of sperm pathologies and motility (percentages) were transformed using the arc sine of the square root. In all mixed model analyses, the covariance structure that best adjusted to data was chosen according to the lowest Akaike Information Corrected Criterion (AICC) and Bayesian Information Criterion (BIC). Means were compared by least square means when p < 0.05, using Tukey adjustment with PDIFF statement in SAS®.
Results
The estimated free gossypol (FG) intake per day was 16.32, 6.98, 5.47 and 0 mg kg of Body Weight−1 (BW) for WCS, CSC, CSM and CTL, respectively. Average daily weight gain (ADG) was 138 ± 8.0 g d−1, which did not differ between treatments (p > 0.05). Average dry matter intake (DMI) was 906 ± 14, 883 ± 14, 895 ± 14 and 843 ± 14 g d−1 for WCS, CSC, CSM and CTL, respectively. The DMI for CTL was lower (p < 0.05) than for other groups.
Free testosterone concentrations increased with time as expected, because the animals were in the pubertal period. At 90 days into the experiment, the CTL group had higher testosterone concentration than the CSC group (Figure 1A). Cortisol concentrations decreased with days into the experiment and there was no treatment effect (Figure 1B).
Free testosterone (A) and Cortisol (B) concentrations in serum from Santa Inês lambs fed with whole cottonseed (WCS), cottonseed meal with low oil (CSM), cottonseed meal with high oil (CSC) and a control without use of cottonseed (CTL). Different letters between treatments in the same experimental day means statistically significant difference between treatments (p < 0.05).
The volume ejaculated, sperm concentration and motility increased as animals grew, but was not affected by treatments (Figure 2). The scrotal size measures (circumference, length and wide) also increased according to time without treatment effect. The regressions of these traits with the gossypol level in the diet were not significant. The factor analysis also showed that the gossypol level was not related to these traits.
Least square means of volume ejaculated, sperm motility, sperm concentration and scrotal circumference from lambs receiving: whole cottonseed (WCS), high oil cottonseed meal (CSC), low oil cottonseed meal (CSM) and control (CTL) without cottonseed co-products. There was no difference in means between treatments (p > 0.05).
Sperm vigor was not affected by treatments. However, the animals from the CTL group showed higher scores for mass movement than the others. Animals from CSM and CSC groups had more head defects and WCS and CSM groups had higher number of coiled tail compared to CTL group. CTL group had the lowest total sperm defects (Table 2). Days of experiment and interaction (t*d) did not have significant effect on sperm pathologies. The factor analysis showed that the gossypol level in the diet was not related to any sperm pathologies (Figure 3).
Least square means of sperm defects* * Showed only sperm defects (pathologies) that had differences between treatments or had means above 1 %. (%) from Santa Inês lambs that received whole cottonseed (WCS), high oil cottonseed meal (CSC), low oil cottonseed meal (CSM) and control diet without cotton co-products (CTL).
Factor analysis of scrotal size measures, sperm pathologies, gossypol level in diet and immediate sperm traits from Santa Inês lambs fed with whole cottonseed, cottonseed meal with low oil, cottonseed meal with high oil and a control without use of cottonseed for 95 experimental days. The values between parentheses show the amount of variance explained by each factor. CONC: sperm concentration; MOT: sperm motility; SL: scrotal length; SW: scrotal width; SC: scrotal circumference; DAYS: days into experiment; GOS: gossypol level in diets; CRACKED: cracked midpiece; IRREG: irregular midpiece; PN, TN: partially and totally notch midpiece, respectively; COILED: coiled tail; CTH: coiled tail around head; TAIL: total tail defects; DEFECTS: total number of spermatozoa with defects.
The seminiferous tubule measures showed a significant treatment effect. The CSM group had the thickest seminiferous epithelium (Table 3). The regression and factor analyses showed that the gossypol level in the diet did not affect it. The factor analysis demonstrated that thicker seminiferous epithelium determine higher sperm concentrations in the ejaculated semen. There was a significant and positive correlation between sperm concentration and seminiferous tubule measures (0.27 < r < 0.44).
Least square means of tubule diameter, lumen diameter and seminiferous epithelium thickness (µm) of lambs fed with whole cottonseed (WCS), cottonseed meal with low oil (CSM), cottonseed meal with high oil (CSC) and a control without use of cottonseed (CTL).
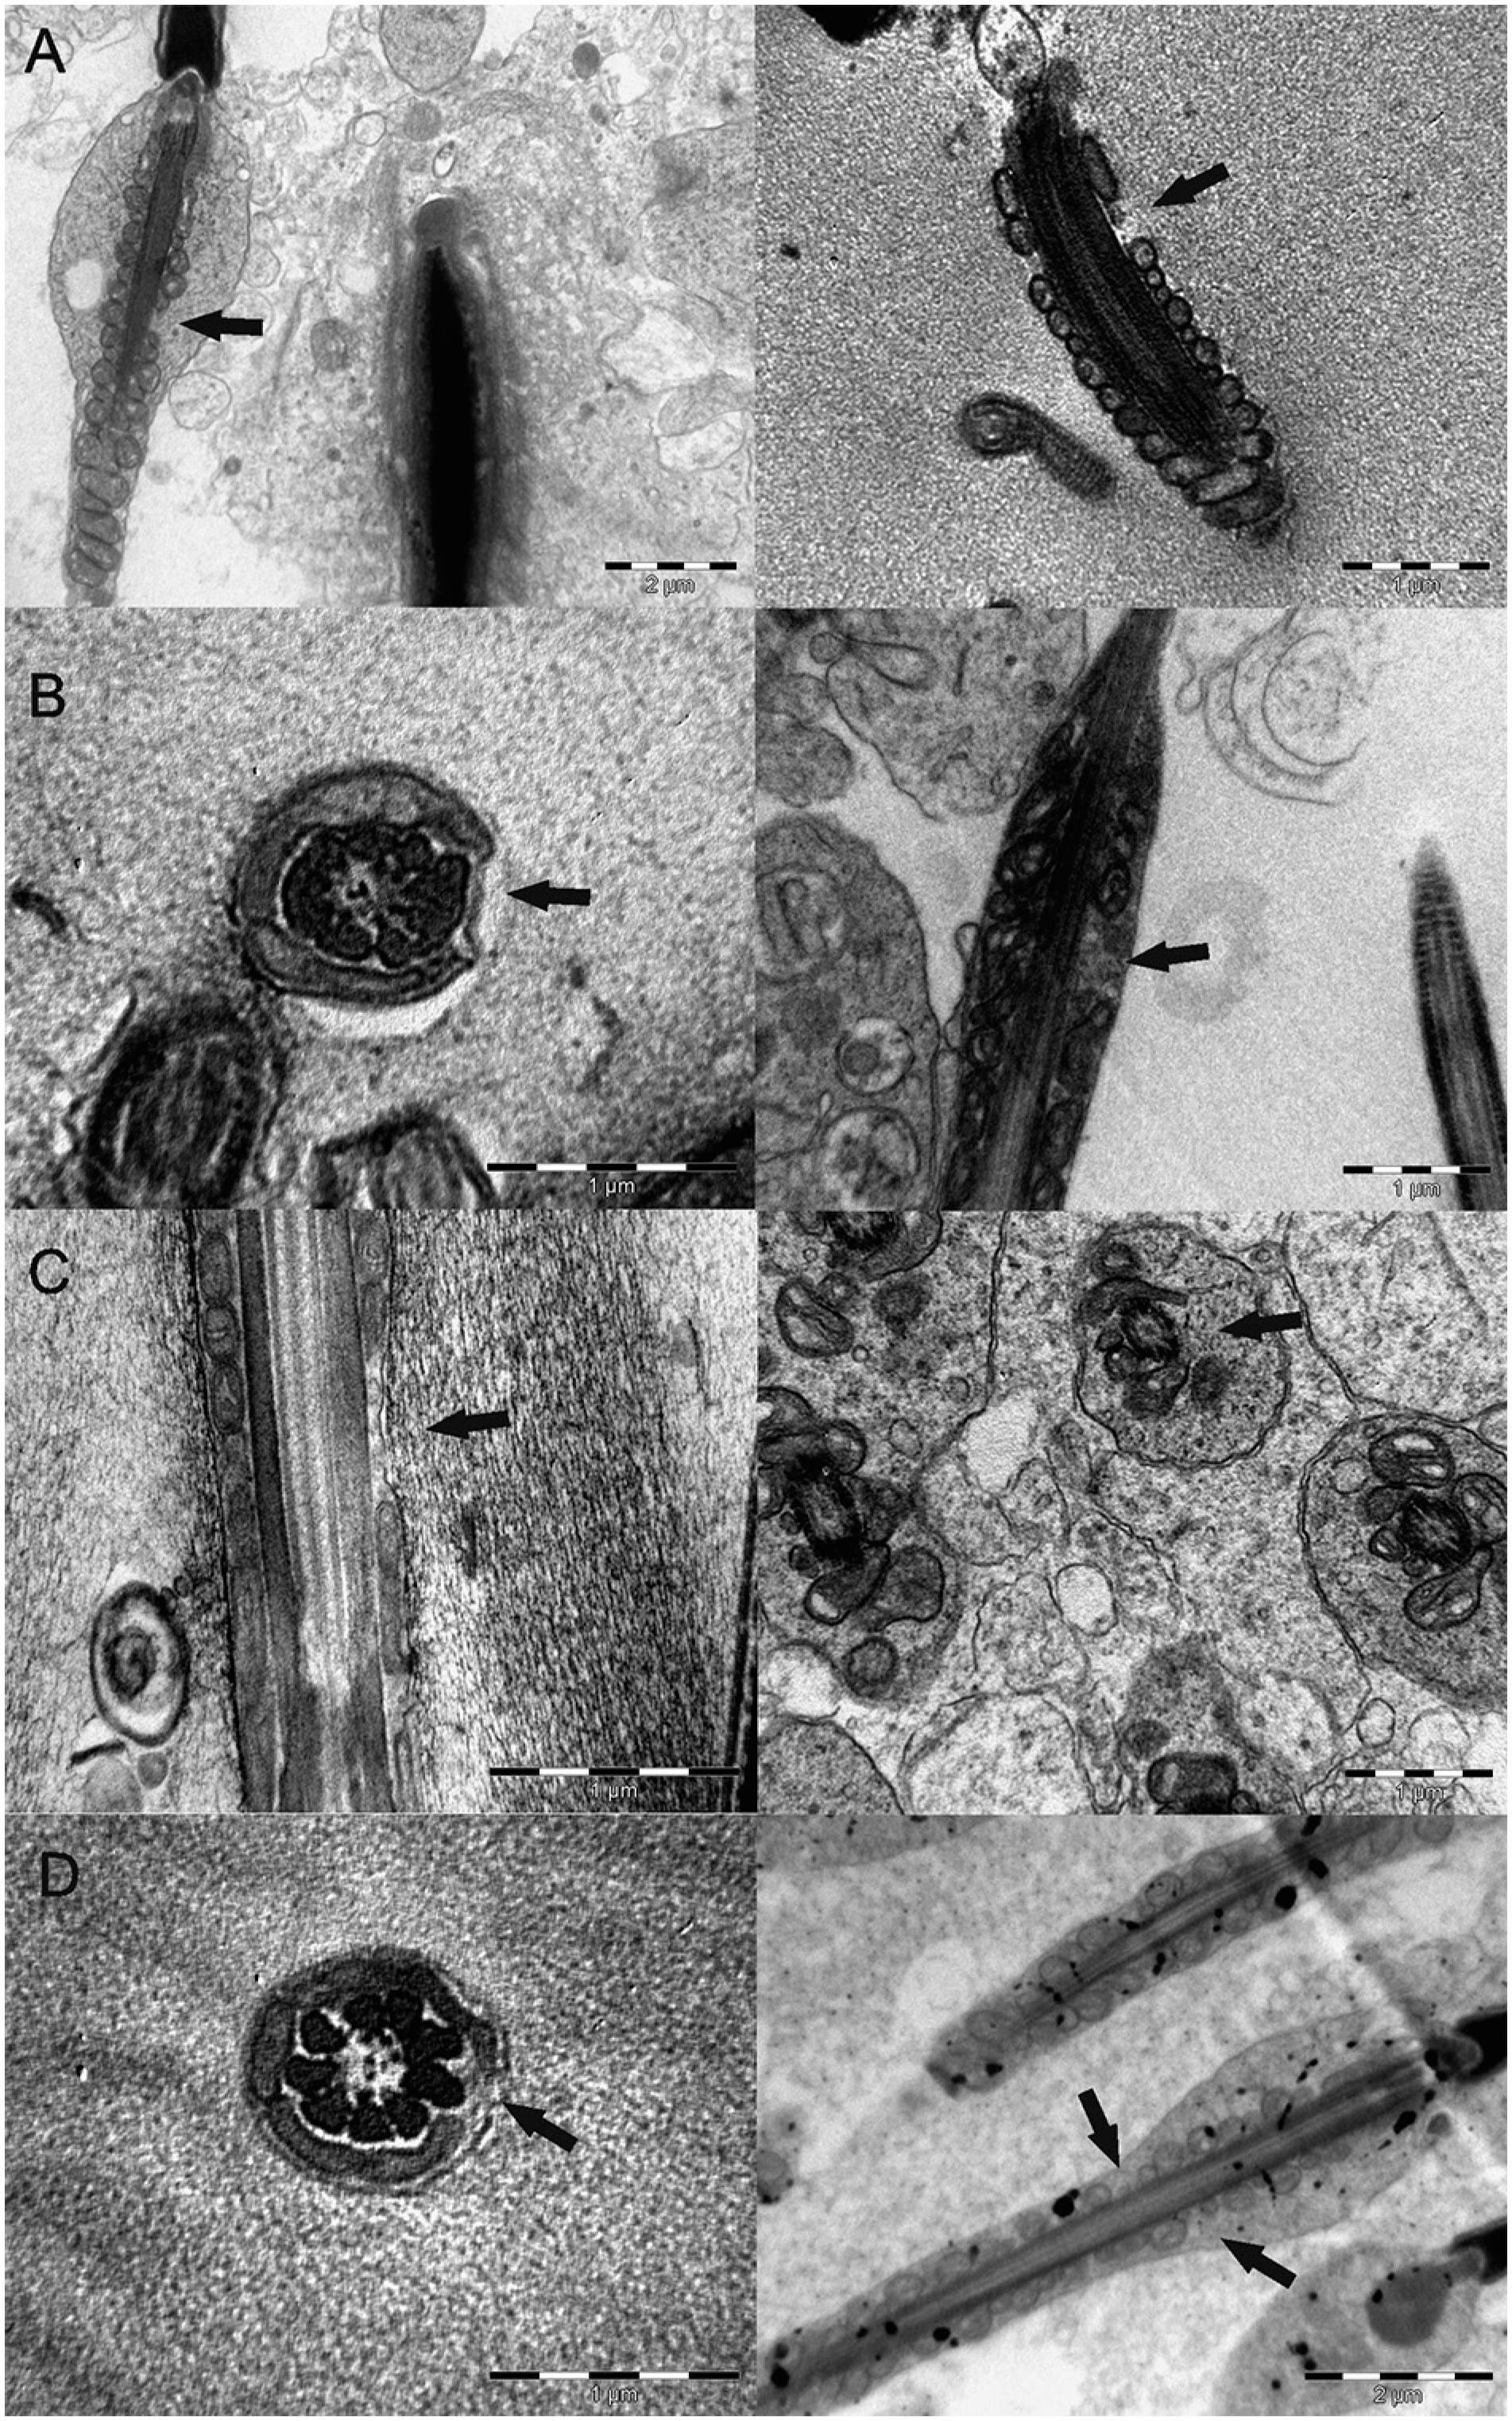
In relation to spermatozoa observed in TEM, the WCS and CSC group had lower scores for SIS than the CTL and CSM groups (odds ratios equal to 3.9 between WCS and CSC vs CTL, and odds ratios equal to 18.6 between WCS and CSC vs CSM). The logistic regression analyzing the SAMS (Figures 4A, B, C and D) showed that the CSM group differentiated from the WCS group (odds ratio = 14, modeling for non lesion probability, and p = 0.04 in contrast test). The contrast between CTL and CSM vs CSC and WCS also was significant. The contrast test analyzing effects of the gossypol level in the diet showed a linear trend (p = 0.08). Sixty-seven percent (67 %) of sperm evaluated from the WCS group had SAMS which were 13 % in the CSM group (Figure 4D).
Electron micrographs showing aplasia of mitochondrial sheath (arrows) in spermatazoa from lambs fed with whole cottonseed (A), cottonseed meal with high oil (B), cottonseed meal with low oil (C), and a control without use of cottonseed (D) for 95 experimental days.
Treatments and the gossypol level in diets did not influence the Sertoli cells score. The scores for seminiferous epithelium were higher in the CTL group compared to others (odds ratios = 2.96 to WCS vs CTL, 2.49 to CSC vs CTL and 2.20 to CSM vs CTL). The main alterations observed in spermatogonial lineage cells were vacuolization inter and intra cellular and lower cell size with decrease in cytoplasmic ground substance, which is similar to that found by Hoffer (1983)Hoffer, A. 1983. Effects of gossypol on the seminiferous epithelium in the rat: a light and electron-microscope study. Biology of Reproduction 28: 1007-1020.. The SAMT were not affect by treatments.
The scores for SIS and SAMS showed significant correlations with the seminiferous epithelium thickness (0.62; −0.49, respectively). The factor analysis (Figure 5) showed a group of variables formed by seminiferous tubule measures, sperm concentration, Sertoli and SIS scores, opposing SAMS. This demonstrated that the thicker epithelium led to higher scores for SIS and lower levels of mitochondrial sheath aplasia.
Factor analysis of sperm and testis traits observed in light and transmission electron microscopy from lambs fed with whole cottonseed, cottonseed meal with low oil, cottonseed meal with high oil and a control without use of cottonseed for 95 experimental days. The values between parentheses show the amount of variance explained by each factor. SIS: spermatozoa integrity in semen; SAMS: Segmental aplasia of mitochondrial sheath in spermatozoid observed in semen; Sertoli: score for Sertoli cells in testis; Epithelium: scores for seminiferous epithelium observed in transmission electron microscopy; SAMT: Segmental aplasia of mitochondrial sheath in spermatozoid observed in testis; TD: seminiferous tubule diameter; TL: seminiferous tubule lumen; SE: seminiferous epithelium thickness; SC: sperm concentration.
Discussion
To the best of our knowledge, this is the first study to evaluate the effect of feeding cottonseed co-products during the pubertal phase of male lambs. This study shows that cottonseed co-products can impair reproductive development in male lambs, regardless of gossypol concentration in diet.
Feeding up to 16.32 mg kg BW−1 d−1 of free gossypol did not impair lamb growth. Chase et al. (1994)Chase, C.; Bastidas, P.; Ruttle, J.; Long, C.; Randel, R. 1994. Growth and reproductive development in Brahman bulls fed diets containing gossypol. Journal of Animal Science 72: 445-452. showed that bulls fed whole cottonseed (60 mg kg BW−1 d−1 of free gossypol) from weaning through puberty had lower body weight gain and reached puberty at an older age than bulls fed cottonseed meal (6 mg kg BW−1 d−1) or soybean meal. These authors argue that, as puberty was reached at similar body weight and scrotal circumferences among treatments, delayed puberty in bulls fed whole cottonseed may have been due to a lower energy balance and it was not related to gossypol. Therefore, the main reason for the difference to the present study may be related to diet constitution. Our diets had an ether extract (EE) maximum equal to 8 %, while these other authors utilized close to 10 % of EE in a whole cottonseed diet, which may impair fiber digestibility and decrease forage consumption (NRC, 2007National Research Council [NRC]. 2007. Nutrient Requirements of Small Ruminants: Sheep, Goats, Cervids, and New World Camelids. The National Academies Press, Washington, DC, USA.).
The cottonseed diets did not affect scrotal size, sperm volume, motility, vigor and concentration in the present study, and these measures increased over time. In similar studies (Chase et al., 1994Chase, C.; Bastidas, P.; Ruttle, J.; Long, C.; Randel, R. 1994. Growth and reproductive development in Brahman bulls fed diets containing gossypol. Journal of Animal Science 72: 445-452.; Chenoweth et al., 1994Chenoweth, P.; Risco, C.; Larsen, R.; Velez, J.; Tran, T.; Chase, C. 1994. Effects of dietary gossypol on aspects of semen quality, sperm morphology and sperm production in young Brahman bulls. Theriogenology 42: 1-13.), gossypol also did not affect scrotal size, sperm quantity or quality. Cunha et al. (2012)Cunha, M.G.G.; Gonzalez, C.I.M.; Carvalho, F.F.R.; Soares, A.T. 2012. Effect of diets containing whole cottonseed on the quality of sheep semen. Acta Scientiarum Animal Sciences 34: 305-311. found that progressive motility and vigor of sperm cells were influenced by whole cottonseed, with a downward linear trend as the gossypol level in diets increased (6.8, 9.2 and 11.5 mg kg BW−1 d−1 of free gossypol). Dabrowski et al. (2000)Dabrowski, K.; Rinchard, J.; Lee, K.J.; Blom, J.H.; Ciereszko, A.; Ottobre, J. 2000. Effects of diets containing gossypol on reproductive capacity of rainbow trout (Oncorhynchus mykiss). Biology of Reproduction 62: 227-234., studying gossypol toxicity in fish, stated that the antifertility effect of gossypol is related to how efficiently gossypol crosses a general circulation-gonadal barrier. Therefore, different permeability of reproductive organs due to species, age and metabolic rate may explain different results of experiments using a similar gossypol dose.
The CSM group had greater seminiferous tubule diameter, low lumen and, consequently, thicker seminiferous epithelium than others. The gossypol concentration in diets did not influence the seminiferous tubule measures observed under light microscope. In a similar study (Chase et al., 1994Chase, C.; Bastidas, P.; Ruttle, J.; Long, C.; Randel, R. 1994. Growth and reproductive development in Brahman bulls fed diets containing gossypol. Journal of Animal Science 72: 445-452.), bulls fed cottonseed meal (6 mg kg BW−1 d−1 of free gossypol) had greater luminal diameters, thinner epithelial walls, and fewer germ cell layers than bulls fed whole cottonseed (60 mg kg BW−1 d−1 of free gossypol), which was unexpected due to higher free gossypol concentration in whole cottonseed than meal. In gossypol treated rats, sperm morphology was severely compromised, but the epithelium in testis appeared morphologically normal (Hoffer et al., 1987Hoffer, A.; Agarwal, A.; Meltzer, P.; Herlihy, P.; Naqvi, R.; Lindberg, M.; Matlin, S. 1987. Ultrastructural, fertility, and spermicidal studies with isomers and derivatives of gossypol in male hamsters. Biology of Reproduction 37: 909-924.; De Andrade et al., 2006De Andrade, S.F.; Oliva, S.U.; Klinefelter, G.R.; De Grava Kempinas, W. 2006. Epididymis-specific pathologic disorders in rats exposed to gossypol from weaning through puberty. Toxicol Pathology 34: 730-737.). Some authors argue that gossypol targets the epididymis, disturbing both the structure and function of this organ, and presumably disrupts sperm maturation without alterations in testis (De Andrade et al., 2006De Andrade, S.F.; Oliva, S.U.; Klinefelter, G.R.; De Grava Kempinas, W. 2006. Epididymis-specific pathologic disorders in rats exposed to gossypol from weaning through puberty. Toxicol Pathology 34: 730-737.). Therefore, there are controversial results for the impact of gossypol on seminiferous tubule measures. Moreover, the impact of these measures on sperm production and quality are not clear. In the present study, sperm concentration was higher with thicker seminiferous epithelium as shown by factor analysis.
The animals from the CTL group had a higher free testosterone concentration at 90 days than the CSC group. The gossypol level in diets was not related to free testosterone concentration because some animals fed diets with a higher level of gossypol also had a higher level of free testosterone (e.g. WCS opposite CSC). In a similar study, Chase et al. (1994)Chase, C.; Bastidas, P.; Ruttle, J.; Long, C.; Randel, R. 1994. Growth and reproductive development in Brahman bulls fed diets containing gossypol. Journal of Animal Science 72: 445-452. did not observe differences in testosterone concentrations between pubertal bulls fed diets containing gossypol and those fed soybean meal.
The effect of gossypol on the endocrine system is controversial. Several studies in monkeys and rats showed that gossypol reduced fertility without changes in testosterone, or other androgens, or luteinizing hormone (Shandilya et al., 1982Shandilya, L.; Clarkson, T.B.; Adams, M.R.; Lewis, J.C. 1982. Effects of gossypol on reproductive and endocrine functions of male cynomolgus monkeys (Macaca fascicularis). Biology of Reproduction 27: 241-252.; Wang et al., 1984Wang, J.M.; Gu, C.H.; Qian, Z.M.; Jing, G.W. 1984. Effect of gossypol on testicular blood flow and testosterone production in rats. Journal of Reproduction and Fertility 71: 127-133.; Soufir et al., 1989Soufir, J.C.; Radigue, C.; Dantec, M.C.; Garnier, D.; Jegou, B. 1989. Gossypol-induced modifications in the microenvironment of rat epididymal spermatozoa. Journal of Reproduction and Fertility 86: 427-434.). However, a number of studies in rats and deer indicated that gossypol has an inhibitory effect on testosterone production by the Leydig cell via a subsequent lesion in pregnenolone formation (Oko and Hrudka, 1984aOko, R.; Hrudka, F. 1984a. Comparison of the effects of gossypol, estradiol-17-beta and testosterone compensation on male-rat reproductive-organs. Biology of Reproduction 30: 1198-1207.; Gizejewski et al., 2008Gizejewski, Z.; Szafranska, B.; Steplewski, Z.; Panasiewicz, G.; Ciereszko, A.; Koprowski, H. 2008. Cottonseed feeding delivers sufficient quantities of gossypol as a male deer contraceptive. European Journal of Wildlife Research 54: 469-477.). In these studies, the antifertility effect of gossypol appears secondary to the decrease in testosterone synthesis (Oko and Hrudka, 1984aOko, R.; Hrudka, F. 1984a. Comparison of the effects of gossypol, estradiol-17-beta and testosterone compensation on male-rat reproductive-organs. Biology of Reproduction 30: 1198-1207.; De Peyster and Srebnik, 1988De Peyster, A.; Srebnik, H.H. 1988. Reproductive endocrine function in gossypol-treated male rats. International Journal of Fertility 33: 362-371.; Dabrowski et al., 2000Dabrowski, K.; Rinchard, J.; Lee, K.J.; Blom, J.H.; Ciereszko, A.; Ottobre, J. 2000. Effects of diets containing gossypol on reproductive capacity of rainbow trout (Oncorhynchus mykiss). Biology of Reproduction 62: 227-234.; El-Sharaky et al., 2010El-Sharaky, A.; Newairy, A.; Elguindy, N.; Elwafa, A. 2010. Spermatotoxicity, biochemical changes and histological alteration induced by gossypol in testicular and hepatic tissues of male rats. Food and Chemical Toxicology 48: 3354-3361.).
Udoh et al. (1992)Udoh, P.; Patil, D.; Deshpande, M. 1992. Histopathological and biochemical effects of gossypol acetate on pituitary-gonadal axis of male albino rats. Contraception 45: 493-509. reported that Sertoli and Leydig cells showed progressive regression due to gossypol administration. El-Sharaky et al. (2010)El-Sharaky, A.; Newairy, A.; Elguindy, N.; Elwafa, A. 2010. Spermatotoxicity, biochemical changes and histological alteration induced by gossypol in testicular and hepatic tissues of male rats. Food and Chemical Toxicology 48: 3354-3361. showed significant increases in the activities of testicular 17b-HSD and 17-ketostroid reductase in gossypol treated groups compared to the control group, which may lead to increased degradation of testosterone which may explain the reduction of serum testosterone concentrations. Moreover, it has been shown that gossypol interferes with key steroidogenic enzymes such as 5α-reductase and 3α-hydroxysteroid dehydrogenase in rat testis (Moh et al., 1993Moh, P.P.; Chang, G.C.J.; Brueggemeier, R.W.; Lin, Y.C. 1993. Effect of gossypol on 5-alpha-reductase and 3-mu-hydroxysteroid dehydrogenase-activities in adult-rat testes. Research Communications in Chemical Pathology and Pharmacology 82: 12-26.). Randel et al. (1992)Randel, R.; Chase, C.; Wyse, S. 1992. Effects of gossypol and cottonseed products on reproduction of mammals. Journal of Animal Science 70: 1628-1638., in a comprehensive review, affirmed that the effects of gossypol on testosterone concentrations are not consistent (i.e., no effect or decreased). According to De Andrade et al. (2006)De Andrade, S.F.; Oliva, S.U.; Klinefelter, G.R.; De Grava Kempinas, W. 2006. Epididymis-specific pathologic disorders in rats exposed to gossypol from weaning through puberty. Toxicol Pathology 34: 730-737., the great contradiction in the endocrinal effects of gossypol may be due to different animal species, different doses and times of treatment, or due to different administration routes.
The cortisol concentration did not differentiate between treatments and was also not related to testosterone. The hormone cortisol is the end product of the activation of the hypothalamus-pituitary-adrenal (HPA) axis and the hormone testosterone is secreted by activation of the hypothalamus-pituitary-gonadal (HPG) axis (van der Meij et al., 2012Van der Meij, L.; Almela, M.; Hidalgo, V.; Villada, C.; Ijzerman, H.; Van Lange, P.A.; Salvador, A. 2012. Testosterone and cortisol release among Spanish soccer fans watching the 2010 World Cup final. PLoS One 7: e34814.). Zilioli and Watson (2012)Zilioli, S.; Watson, N.V. 2012. The hidden dimensions of the competition effect: basal cortisol and basal testosterone jointly predict changes in salivary testosterone after social victory in men. Psychoneuroendocrinology 37: 1855-1865. commented on a significant interaction between the HPG and HPA axes status, so a high cortisol level can inhibit the release of testosterone. In this study, cortisol was used as an indicator of stress condition and to identify possibly high-cortisol animals, which could affect testosterone concentrations. Gossypol did not affect the cortisol concentrations, so the interaction between the HPG and HPA axes did not affect the results of the study.
Sperm pathologies showed that animals from the CTL group had a lower total of spermatozoa defects. The main sperm defects found in animals that receive cotton coproducts compared to the control group were isolated (detached) heads, coiled tail and proximal cytoplasmic droplet. In another study (Cunha et al., 2012Cunha, M.G.G.; Gonzalez, C.I.M.; Carvalho, F.F.R.; Soares, A.T. 2012. Effect of diets containing whole cottonseed on the quality of sheep semen. Acta Scientiarum Animal Sciences 34: 305-311.) using crescent concentrations of whole cottonseed fed to sheep (6.8, 9.2 and 11.5 mg kg BW−1 d−1 of free gossypol), the percentage of total defects increased linearly: for each 1 % increase of whole cottonseed in the diet, there was an increase of 0.2 % in total defects. In the morphological analyses, a greater occurrence of defects such as broken acrosome, folded tail, and strongly folded tail were seen (Cunha et al., 2012Cunha, M.G.G.; Gonzalez, C.I.M.; Carvalho, F.F.R.; Soares, A.T. 2012. Effect of diets containing whole cottonseed on the quality of sheep semen. Acta Scientiarum Animal Sciences 34: 305-311.).
Chenoweth et al. (1994)Chenoweth, P.; Risco, C.; Larsen, R.; Velez, J.; Tran, T.; Chase, C. 1994. Effects of dietary gossypol on aspects of semen quality, sperm morphology and sperm production in young Brahman bulls. Theriogenology 42: 1-13., studying bulls fed with whole cottonseed (16.4 mg kg BW−1 d−1 of free gossypol), observed an increased proportion of sperm midpiece abnormalities, which stabilized at 52 to 62 %. In rats that received gossypol daily (15 mg kg BW−1 d−1) from weaning through puberty, there was a significant increase in sperm with abnormal morphology in the vas deferens of treated animals, with the most frequent abnormality being isolated sperm heads (De Andrade et al., 2006De Andrade, S.F.; Oliva, S.U.; Klinefelter, G.R.; De Grava Kempinas, W. 2006. Epididymis-specific pathologic disorders in rats exposed to gossypol from weaning through puberty. Toxicol Pathology 34: 730-737.).
The sperm pathology and ultrastructural results of this study agree with Oko and Hrudka (1982)Oko, R.; Hrudka, F. 1982. Segmental aplasia of the mitochondrial sheath and sequelae induced by gossypol in rat spermatozoa. Biology of Reproduction 26: 183-195. who stated that there is a common pathogenic path linking many of the major sperm midpiece abnormalities with known spermatoxic effects of gossypol on the structural organization of the sperm midpiece in late spermatogenesis. Gossypol appears to cause damage to the mitochondrial sheath of cells during the latter phases of spermatogenesis, with lesions being first detected in elongating spermatids. Therefore, the types of lesion first observed at extragonadal sites suggested structural failure in already weakened structures, possibly exacerbated by the onset of sperm motility.
In ultrastructural studies, segmental aplasia of the mitochondrial sheath has been consistently identified with gossypol treatment in rats, monkeys, rabbits and bulls (Oko and Hrudka, 1982Oko, R.; Hrudka, F. 1982. Segmental aplasia of the mitochondrial sheath and sequelae induced by gossypol in rat spermatozoa. Biology of Reproduction 26: 183-195., 1984bOko, R.; Hrudka, F. 1984b. Gossypol-induced early and delayed-effects in the seminiferous epithelium of the adult-rat. Contraceptive Delivery Systems 5: 335-356.; Chenoweth et al., 2000Chenoweth, P.; Chase, C.; Risco, C.; Larsen, R. 2000. Characterization of gossypol-induced sperm abnormalities in bulls. Theriogenology 53: 1193-1203.). This lesion was considered to be pathognomonic for gossypol spermatoxicity (Oko and Hrudka, 1982Oko, R.; Hrudka, F. 1982. Segmental aplasia of the mitochondrial sheath and sequelae induced by gossypol in rat spermatozoa. Biology of Reproduction 26: 183-195.), which allows it to be differentiated from other causes of sperm axonemal disruption. In the present study, there was a linear trend between gossypol level in diet and segmental aplasia lesion in sperm. The WCS and CSC group showed higher levels of SAMS than CSM and CTL. However, we do not agree on categorization of this lesion as pathognomonic for gossypol spermatoxicity, because we found it in spermatozoa from the CTL group (Figure 4D). Others authors have also occasionally observed this lesion in bulls that did not receive cotton products (Burgess and Chenoweth, 1975Burgess, G.W.; Chenoweth, P.J. 1975. Mid-piece abnormalities in bovine semen following experimental and natural cases of bovine ephemeral fever. British Veterinary Journal 131: 536-544.).
In summary, the CTL group had the lowest total sperm defects and better seminiferous epithelium structure. When compared to the CTL group, CSM had more isolated head defects; WCS and CSM had more coiled tail defects, and CSC had more proximal cytoplasmic droplets. Animals from the CSC group had lower testosterone concentrations. WCS and CSC had lower SIS and a higher number of SAMS. Therefore, the overall reproductive status of CTL group was better than the others. Consequently, the cotton coproducts had a negative impact on it. However, the increase in gossypol concentration in the diet did not demonstrate a proportional increase in injuries. Probably, different feedstuffs (gossypol sources) led to different rumen functioning which can affect the free gossypol bioavailability, as described by Chase et al. (1994)Chase, C.; Bastidas, P.; Ruttle, J.; Long, C.; Randel, R. 1994. Growth and reproductive development in Brahman bulls fed diets containing gossypol. Journal of Animal Science 72: 445-452..
In ruminants, there are difficulties in controlling the amount of bioavailable gossypol. In studies where total gossypol concentrations in plasma were checked and adverse effects were found, the concentrations varied from 26.2 to 73.0 µg g−1 in treated bulls and no gossypol was detected in the plasma of control bulls (Chenoweth et al., 1994Chenoweth, P.; Risco, C.; Larsen, R.; Velez, J.; Tran, T.; Chase, C. 1994. Effects of dietary gossypol on aspects of semen quality, sperm morphology and sperm production in young Brahman bulls. Theriogenology 42: 1-13.). In contrast, another study on bulls where no qualitative or quantitative semen changes were detected following the feeding of cottonseed meal for 132 days, gossypol was not detected in the plasma nor in the other tissues of treated bulls (Jimenez et al., 1989Jimenez, D.A.; Chandler, J.E.; Adkinson, R.W.; Nipper, W.A.; Baham, A.; Saxton, A.M. 1989. Effect of feeding gossypol in cottonseed meal on growth, semen quality, and spermatogenesis of yearling Holstein bulls. Journal of Dairy Science 72: 1866-1875.). Moreover, there was a variation between individuals. In studies on humans, 15 % of men failed to suppress spermatogenesis, although they had similar plasma gossypol levels to the others who had sperm suppression (Coutinho, 2002Coutinho, E.M. 2002. Gossypol: a contraceptive for men. Contraception 65: 259-263.).
Conclusions
The cottonseed coproducts did not impair lamb growth. The cotton coproducts have a negative impact on the reproductive system of male pubertal lambs regardless of gossypol concentration (up to 16.32 mg kg BW−1 d−1). Therefore, we do not recommend feeding cotton coproducts to prepubertal male lambs if these animals are to be used for reproduction in the future.
Acknowledgements
NAP/MEPA – ESALQ/USP for providing support in transmission electron microscopy analyses. CNPq, MAPA, INCT-Pecuária, IFGOIANO and FAPESP for financial support and scholarships. The sponsors had no role in the design, data collection, analysis, interpretation or writing of this article.
References
- Burgess, G.W.; Chenoweth, P.J. 1975. Mid-piece abnormalities in bovine semen following experimental and natural cases of bovine ephemeral fever. British Veterinary Journal 131: 536-544.
- Chang, M.; Gu, Z.; Saksena, S. 1980. Effects of gossypol on the fertility of male rats, hamsters and rabbits. Contraception 21: 461-469.
- Chase, C.; Bastidas, P.; Ruttle, J.; Long, C.; Randel, R. 1994. Growth and reproductive development in Brahman bulls fed diets containing gossypol. Journal of Animal Science 72: 445-452.
- Chenoweth, P.; Chase, C.; Risco, C.; Larsen, R. 2000. Characterization of gossypol-induced sperm abnormalities in bulls. Theriogenology 53: 1193-1203.
- Chenoweth, P.; Risco, C.; Larsen, R.; Velez, J.; Tran, T.; Chase, C. 1994. Effects of dietary gossypol on aspects of semen quality, sperm morphology and sperm production in young Brahman bulls. Theriogenology 42: 1-13.
- Coutinho, E.M. 2002. Gossypol: a contraceptive for men. Contraception 65: 259-263.
- Cunha, M.G.G.; Gonzalez, C.I.M.; Carvalho, F.F.R.; Soares, A.T. 2012. Effect of diets containing whole cottonseed on the quality of sheep semen. Acta Scientiarum Animal Sciences 34: 305-311.
- Dabrowski, K.; Rinchard, J.; Lee, K.J.; Blom, J.H.; Ciereszko, A.; Ottobre, J. 2000. Effects of diets containing gossypol on reproductive capacity of rainbow trout (Oncorhynchus mykiss). Biology of Reproduction 62: 227-234.
- De Andrade, S.F.; Oliva, S.U.; Klinefelter, G.R.; De Grava Kempinas, W. 2006. Epididymis-specific pathologic disorders in rats exposed to gossypol from weaning through puberty. Toxicol Pathology 34: 730-737.
- De Peyster, A.; Srebnik, H.H. 1988. Reproductive endocrine function in gossypol-treated male rats. International Journal of Fertility 33: 362-371.
- El-Sharaky, A.; Newairy, A.; Elguindy, N.; Elwafa, A. 2010. Spermatotoxicity, biochemical changes and histological alteration induced by gossypol in testicular and hepatic tissues of male rats. Food and Chemical Toxicology 48: 3354-3361.
- Geiger, P. 1992. Radioimmunoassay data handling and calculations with a graphics statistics computer-program. Biochemical Medicine and Metabolic Biology 48: 74-80.
- Gizejewski, Z.; Szafranska, B.; Steplewski, Z.; Panasiewicz, G.; Ciereszko, A.; Koprowski, H. 2008. Cottonseed feeding delivers sufficient quantities of gossypol as a male deer contraceptive. European Journal of Wildlife Research 54: 469-477.
- Hoffer, A. 1983. Effects of gossypol on the seminiferous epithelium in the rat: a light and electron-microscope study. Biology of Reproduction 28: 1007-1020.
- Hoffer, A.; Agarwal, A.; Meltzer, P.; Herlihy, P.; Naqvi, R.; Lindberg, M.; Matlin, S. 1987. Ultrastructural, fertility, and spermicidal studies with isomers and derivatives of gossypol in male hamsters. Biology of Reproduction 37: 909-924.
- Jimenez, D.A.; Chandler, J.E.; Adkinson, R.W.; Nipper, W.A.; Baham, A.; Saxton, A.M. 1989. Effect of feeding gossypol in cottonseed meal on growth, semen quality, and spermatogenesis of yearling Holstein bulls. Journal of Dairy Science 72: 1866-1875.
- Larsen, R.; Chenoweth, P. 1990. Diadem crater defects in spermatozoa from 2 related angus bulls. Molecular Reproduction and Development 25: 87-96.
- Ministério da Agricultura, Pecuária e Abastecimento [MAPA]. 2014. Agrobusiness Projections: Brazil 2013/2014 a 2023/2024 - Long Term Projections = Projeções do Agronegócio: Brasil 2013/2014 a 2023/2024 - Projeções de Longo Prazo. MAPA/ACS, Brasília, DF, Brazil (in Portuguese).
- McManus, C.; Sasaki, L.C.B.; Louvandini, H.; Dias, L.T.; Teixeira, R.A.; Alves, J.M.; Lucci, C.M.; Marsiaj, P.H.P.; Murata, L.S. 2010. Histological evaluation of Santa Ines sheep testicles born in different seasons. Ciência Rural 40: 366-372 (in Portuguese, with abstract in English).
- Moh, P.P.; Chang, G.C.J.; Brueggemeier, R.W.; Lin, Y.C. 1993. Effect of gossypol on 5-alpha-reductase and 3-mu-hydroxysteroid dehydrogenase-activities in adult-rat testes. Research Communications in Chemical Pathology and Pharmacology 82: 12-26.
- National Research Council [NRC]. 2007. Nutrient Requirements of Small Ruminants: Sheep, Goats, Cervids, and New World Camelids. The National Academies Press, Washington, DC, USA.
- Oko, R.; Hrudka, F. 1982. Segmental aplasia of the mitochondrial sheath and sequelae induced by gossypol in rat spermatozoa. Biology of Reproduction 26: 183-195.
- Oko, R.; Hrudka, F. 1984a. Comparison of the effects of gossypol, estradiol-17-beta and testosterone compensation on male-rat reproductive-organs. Biology of Reproduction 30: 1198-1207.
- Oko, R.; Hrudka, F. 1984b. Gossypol-induced early and delayed-effects in the seminiferous epithelium of the adult-rat. Contraceptive Delivery Systems 5: 335-356.
- Randel, R.; Chase, C.; Wyse, S. 1992. Effects of gossypol and cottonseed products on reproduction of mammals. Journal of Animal Science 70: 1628-1638.
- Reiser, R.; Fu, H. 1962. Mechanism of gossypol detoxification by ruminant animals. Journal of Nutrition 76: 215-8.
- Rodbard, D.; Lewald, J. 1970. Computer analysis of radioligand assay and radioimmunoassay data. Acta Endocrinologica 65: S79-S103.
- Shandilya, L.; Clarkson, T.B.; Adams, M.R.; Lewis, J.C. 1982. Effects of gossypol on reproductive and endocrine functions of male cynomolgus monkeys (Macaca fascicularis). Biology of Reproduction 27: 241-252.
- Soufir, J.C.; Radigue, C.; Dantec, M.C.; Garnier, D.; Jegou, B. 1989. Gossypol-induced modifications in the microenvironment of rat epididymal spermatozoa. Journal of Reproduction and Fertility 86: 427-434.
- Steger, K.; Wrobel, K. 1996. Postnatal development of ovine seminiferous tubules: an electron microscopical and morphometric study. Annals of Anatomy-Anatomischer Anzeiger 178: 201-213.
- Udoh, P.; Patil, D.; Deshpande, M. 1992. Histopathological and biochemical effects of gossypol acetate on pituitary-gonadal axis of male albino rats. Contraception 45: 493-509.
- Van der Meij, L.; Almela, M.; Hidalgo, V.; Villada, C.; Ijzerman, H.; Van Lange, P.A.; Salvador, A. 2012. Testosterone and cortisol release among Spanish soccer fans watching the 2010 World Cup final. PLoS One 7: e34814.
- Wang, J.M.; Gu, C.H.; Qian, Z.M.; Jing, G.W. 1984. Effect of gossypol on testicular blood flow and testosterone production in rats. Journal of Reproduction and Fertility 71: 127-133.
- Wang, M. 1987. Analysis of gossypol by high-performance liquid chromatography. Journal of Ethnopharmacology 20: 1-11.
- Wrobel, K.; Reichold, J.; Schimmel, M. 1995. Quantitative morphology of the ovine seminiferous epithelium. Annals of Anatomy-Anatomischer Anzeiger 177: 19-32.
- Zilioli, S.; Watson, N.V. 2012. The hidden dimensions of the competition effect: basal cortisol and basal testosterone jointly predict changes in salivary testosterone after social victory in men. Psychoneuroendocrinology 37: 1855-1865.
Edited by
Publication Dates
-
Publication in this collection
Nov-Dec 2016
History
-
Received
29 Sept 2015 -
Accepted
23 Nov 2015