ABSTRACT
Ventilation systems are incorporated at intensive poultry farms to control environment conditions and thermal comfort of broilers. The ventilation system operates based on environmental data, particularly measured by sensors of temperature and relative humidity. Sensors are placed at different positions of the facility. Quality, number and positioning of the sensors are critical factors to achieve an efficient performance of the system. For this reason, a strategic positioning of the sensors associated to controllers could support the maintenance and management of the microclimate inside the facility. This research aims to identify the three most representative points for the positioning of sensors in order to support the ventilation system during the critical period from 12h00 to 15h00 on summer days. Temperature, relative humidity and wind speed were measured in four different tunnel ventilated barns at the final stage of the production cycle. The descriptive analysis was performed on these data. The Temperature and Humidity Index (THI) was also calculated. Then, the geostatistical analysis of THI was performed by GS+ and the position of sensors was determined by ordinary kriging. The methodology was able to detect the most representative points for the positioning of sensors in a case study (southeastern Brazil). The results suggested that this strategic positioning would help controllers to obtain a better inference of the microclimate during the studied period (the hottest microclimate), considered critical in Brazil. In addition, these results allow developing a future road map for a decision support system based on 24 h monitoring of the ventilation systems in broiler houses.
broiler farms; environmental control; geostatistics; ordinary kriging; welfare
Introduction
Livestock production, especially broiler rearing, in tropical countries is affected by the confluence of high temperature and relative humidity values, which hinder the production process (heat stress and mortality problems) when the animals are at the final stage of the production (Bustamante et al., 2013Bustamante, E.; García-Diego, F.J.; Calvet, S.; Estellés, F.; Beltrán, P.; Hospitaler, A.; Torres, A.G. 2013. Exploring ventilation efficiency in poultry buildings: the validation of computational fluid dynamics (CFD) in a cross-mechanically ventilated broiler farm. Energies 6: 2605-2623.; Nääs et al., 2010Nääs, I.A.; Romanini, C.E.B.; Salgado, D.D.A.; Lima, K.A.O.; Vale, M.M.; Labigalini, M.R.; Souza, S.R.L.; Menezes, A.G.; Moura, D.J. 2010. Impact of global warming on beef cattle production cost in Brazil. Scientia Agricola 67: 1-8.; Petracci et al., 2006Petracci, M.; Bianchi, M.; Cavani, C.; Gaspari, P.; Lavazza, A. 2006. Preslaughter mortality in broiler chickens, turkeys and spent hens under commercial slaughtering. Poultry Science 85: 1660-1664.; Renaudeau et al., 2012Renaudeau, D.; Collin, A.; Yahav, S.; Basilio, V.; Gourdine, J.L.; Collier, R.J. 2012. Adaptation to hot climate and strategies to alleviate heat stress in livestock production. Animal 6: 707-728.). The thermal environment represented by temperature, relative humidity, wind speed and solar radiation can endanger homeothermy, which plays a key role in broiler production by affecting productive response (feed efficiency and weight gain) and animal welfare (Khan et al., 2011Khan, R.U.; Naz, S.; Nikousefat, Z.; Tufarelli, V.; Javdani, M.; Rana, N.; Laudadio, V. 2011. Effect of vitamin E in heat-stressed poultry. World’s Poultry Science Journal 67: 469-478.; Razuki et al., 2011Razuki, W.M.; Mukhlis, S.A.; Jasim, F.H.; Hamad, R.F. 2011. Productive performance of four commercial broilers genotypes reared under high ambient temperatures. International Journal of Poultry Science 10: 87-92.; Roussan et al., 2008Roussan, D.A.; Khwaldeh, G.Y.; Haddad, R.R.; Shaheen, I.A.; Salameh, G.; Al Rifai, R. 2008. Effect of ascorbic acid, acetylsalicylic acid, sodium bicarbonate, and potassium chloride supplementation in water on the performance of broiler chickens exposed to heat stress. The Journal of Applied Poultry Research 17: 141-144.; Yahav et al., 2004Yahav, S.; Straschnow, A.; Luger, D.; Shinder, D.; Tanny, J.; Cohen, S. 2004. Ventilation, sensible heat loss, broiler energy, and water balance under harsh environmental conditions. Poultry Science 83: 253-258.). The ventilation system becomes an important factor to determine optimal conditions for livestock farms. Indeed, it is a key factor to ensure control of the microclimate inside the livestock building (Calvet et al., 2011Calvet, S.; Estellés, F.; Cambra-López, M.; Torres, A.G.; Van Den Weghe, H.F. 2011. The influence of broiler activity, growth rate, and litter on carbon dioxide balances for the determination of ventilation flow rates in broiler production. Poultry Science 90: 2449-2458.).
An inadequate design of the ventilation system (insufficient number of exhaust fans and a cooling area smaller than recommendations) or a wrong positioning of the sensors will provide no representative information for controllers. Consequently, the response of the automatic system (controllers) in terms of the number of exhaust fans to be switched on or off would be insufficient to reach the ideal environmental conditions (Miles et al., 2013Miles, D.M.; Brooks, J.P.; MacLaughlin, M.R.; Rowe, D.E. 2013. Broiler litter ammonia emissions near sidewalls, feeders, and waters. Poultry Science 92: 1693-1698.; Moore et al., 2011Moore, P.A.; Miles, D.; Burns, R.; Pot, D.; Berg, K.; Choif, I.H. 2011. Ammonia emission factors from broiler litter in barns, in storage, and after land application. Journal of Environmental Quality 40: 1395-1404.). The use and support of mathematical tools and computational techniques help to understand the operating conditions to achieve an effective control of the system (Kwon et al., 2015Kwon, K.S.; Lee, I.B.; Zhang, G.Q.; Ha, T. 2015. Computational fluid dynamics analysis of the thermal distribution of animal occupied zones using the jet-drop-distance concept in a mechanically ventilated broiler house. Biosystems Engineering 136: 51-68.; Mirzaee-Ghaleh et al., 2015Mirzaee-Ghaleh, E.; Omid, M.; Keyhani, A.; Dalvand, M.J. 2015. Comparison of fuzzy and on/off controllers for winter season indoor climate management in a model poultry house. Computers and Electronics in Agriculture 110: 187-195.; Rojano et al., 2015Rojano, F.; Bournet, P.E.; Hassouna, M.; Robin, P.; Kacira, M.; Choi, C.Y. 2015. Modeling heat and mass transfer of a broiler house using computational fluid dynamics. Biosystems Engineering 136: 25-38.). In this research, a solution is implemented by means of the strategic positioning of sensors. Thus, this study aims to identify the most representative points for the positioning of sensors of temperature and relative humidity in order to support the ventilation system (controllers) inside the broiler house during the period from 12h00 to 15h00 in the summer, considered as a critical period for Brazilian growers. The positioning of the sensors was obtained by using the geostatistical analysis with software GS+ (Robertson, 1998) and the maps of spatial distribution of variables were developed through the software Surfer (Golden Software, 1999) and software Sanos (Van Groenigen et al., 1999Van Groenigen, J.W.; Siderius, W.; Stein, A. 1999. Constrained optimization of soil sampling for minimization of the kriging variance. Geoderma 87: 239-259.). A three-step methodological approach is followed to obtain the strategic positions to place the sensors.
Materials and Methods
Broiler farms
The experiments were carried out in four poultry facilities, located in the municipality of Amparo, São Paulo State, Brazil (Latitude 22º42’04" S, Longitude 46º45’52" W; 674 m above sea level) and in the municipality of Socorro, São Paulo State (Latitude 22º35’29" S, Longitude 46º31’44" W, 752 m above sea level). According to the international system of Köppen, the predominant climate in this region is characterized as Cwa (dry winter and hot summer), with an average air temperature 22 °C in the hot season and 18 °C in the cold season (Alvares et al., 2013Alvares, C.A.; Stape, J.L.; Sentelhas, P.C.; Moraes, G.; Leonardo, J.; Sparovek, G. 2013. Köppen's climate classification map for Brazil. Meteorologische Zeitschrift 22: 711-728.).
The following broiler houses (tunnel-ventilation) were monitored: Blue House (BH) type; Dark House (DH) type; Double Wide House (DWH) type; and Solid Wall (SW) type. These farms have ventilation systems with negative pressure. The roof is made of fiber cement; they have automatic feeding and drinking lines, built-up litter from the second batch and the same commercial strain (Cobb Vantress 500). However, there are differences in platform locations, dimensions, lateral isolation, pad cooling, number of exhaust fans and flock density:
Blue House - dimensions: length, 90 m; width, 17 m; sidewall height 2.5 m; roof 23 %; ten exhaust fans (diameter 1.38 m) installed; no cooling pad system; curtain polyethylene material for lateral isolation (blue color inside, light gray color outside); and flock density 15 bird m−2.
Dark House - dimensions: length, 150 m; width, 20 m; sidewall height 2.9 m; roof 22 %; sixteen exhaust fans (diameter 1.3 m) installed; cooling pad system made with brick ceramic; the lateral isolation material is curtain polyethylene (black color inside, silver color outside); and flock density 12 bird m−2.
Double Wide House - dimensions: length, 160 m; width, 24.5 m; sidewall height 2.4 m; roof 21 %; fifteen exhaust fans (diameter 1.3 m) installed; cooling pad system made with cellulose; curtain polyethylene material for lateral isolation (black color inside, silver color outside); and flock density 12 bird m−2.
Solid Wall - dimensions: length, 120 m; width, 20 m; sidewall height 3 m; roof 22 %; sixteen exhaust fans (diameter 1.38 m) installed; cooling pad system made of cellulose; cement blocks for lateral isolation and flock density 13 bird m−2.
The methodological approach
The methodology is divided into a framework of three steps (Step 1: Pre-processing, Step 2: Processing and Step 3: Post-processing). The pre-processing consists of the measurement of dry bulb temperature (DBT: Dry Bulb Temperature - °C), relative humidity (RH: Relative Humidity - %), and wind speed (WS: Wind Speed - m s−1) data inside the facilities, along with the calculation of the Temperature and Humidity Index (THI). The processing step refers to data analysis using descriptive statistics (temperature, relative humidity, and wind speed), geostatistics (THI) (GS+ software) by the method of kriging (Surfer software) and the use of space simulation algorithm (Sanos software). Finally, the step of post-processing is based on determining the X and Y coordinates of the three representative points for positioning of sensors of temperature and relative humidity that will support the ventilation system controller (Figure 1) in future experiments.
− The three-step methodological approach. DBT = dry bulb temperature; RH = relative humidity; WS = wind speed; THI = temperature and humidity index; BH = blue house facility; DH = dark house facility; DWH = double wide house facility; SW = solid wall facility.
Step 1: Pre-Processing - Data measurement and THI
The experimental design contains four units (broiler farms), each with a different building typology. The process of collecting data was independent for each facility on different dates, but during the same summer season. The data also were divided according to the phase of the rearing process: ages 28, 35 and 42 days. The data were not measured simultaneously in the three studied phases. For instance, a farm could be at the 28-d phase during a date "x", but another farm could be at a different phase of the rearing process on a date “y”, with "x" different from "y". The units were treated statistically independently.
Data on DBT, RH, and WS were measured during the most critical and representative period of the day (from 12h00 to 15h00) according to Brazilian conditions in a typical summer season. During this period, birds can show acute heat stress, especially on the final phase of broiler rearing (Curi et al., 2014Curi, T.M.R.C.; Vercellino, R.A.; Massari, J.M.; Souza, Z.M.; Moura, D.J. 2014. Geostatistic to evaluate the environmental control in different ventilation systems in broiler houses. Engenharia Agrícola 34: 1062-1074 (in Portuguese, with abstract in English).). The most adverse climatic conditions are commonly observed around 14h00. For this reason, data were measured around this time in 52 equidistant points (Figure 2) by using only one sensor for temperature and wind speed and another for relative humidity: one hot wire anemometer was used to collect temperature and wind speed measurements and one thermal hygrometer sensor, for relative humidity. It is important to mention that the acquisition of data lasted approximately 40 min for the 52 positions where the data was instantaneously measured. These 40 min contain a representative sample of the mentioned critical period. Indeed, this time contains almost 67 % (40 of 60 min) of that critical hour labeled as 14h00. The use of a representative and single period can also be observed in other studies aimed at monitoring and evaluating thermal conditions in broiler rearing facilities for preliminary purposes (Curi et al., 2014Curi, T.M.R.C.; Vercellino, R.A.; Massari, J.M.; Souza, Z.M.; Moura, D.J. 2014. Geostatistic to evaluate the environmental control in different ventilation systems in broiler houses. Engenharia Agrícola 34: 1062-1074 (in Portuguese, with abstract in English).; Lima et al., 2015Lima, N.D.S.; Garcia, R.G.; Nääs, I.A.; Caldara, F.R.; Pons, P. 2015. Model-predicted ammonia emission from two broiler houses with different rearing systems. Scientia Agricola 72: 393-399.).
− Schematic representation of 52 equidistant points used for measurements of the thermal variables inside the facilities. P1 = first point to measurement of the climatic variables; P52 = last point to measurement of the climatic variables; X = coordinate in axis X; Y = coordinate in axis Y.
For the whole set of farms, the data were collected at the same height (bird heights, 0.30 m from the ground). The monitoring of thermal conditions (DBT, RH and WS) for each farm was performed weekly at bird age of 28, 35 and 42 days as mentioned before.
In addition, this research used a numerical method to correct the temporal delay of variables between each measurement (from the first to the last point – Figure 2). The method to fit this delay is described in Gabriel Filho et al. (2011)Gabriel Filho, L.R.A.; Pereira, D.F.; Barato, F.F.; Magalhães, M.M. 2011. Method of numerical correction of errors occasioned by delay of records during the monitoring of environmental variables of interest for animal production. Engenharia Agrícola 31: 835-846.. The proposed method approximates the recorded values with time delays to the expected moment of interest, as if the data were measured simultaneously in all spatially distributed time points:
where: D represents values of the environmental variable, T is the time required to measure the variable D. Thus, any value of D measure in time T can be calculated to estimate values for in .
The Temperature and Humidity Index (THI) (Thom, 1959Thom, E.C. 1959. The discomfort index. Weatherwise 12: 57-60.) was calculated by Equation 2 (with temperature and relative humidity datasets). This index quantifies thermal comfort of broilers. It is interpreted as follows: "Comfort" – 64 < THI ≤ 74; "Warning" – 74 < THI ≤ 78; and "Dangerous" – THI > 78 (Menezes et al., 2010Menezes, A.G.; Nääs, I.A.; Baracho, M.S. 2010. Identification of critical points of thermal environment in broiler production. Revista Brasileira de Ciência Avícola 12: 21-29.).
THI = DBT + (0.36 × DPT) + 41.5 (Eq. 2)
where: DBT represents dry bulb temperature (°C) and DPT represents dew point temperature (°C).
Step 2: Processing - Data analysis
Climatic variables (temperature, relative humidity and wind speed) were evaluated by the classical statistical analysis using the Statistical Analysis System, version 9.2 (SAS® software) through mean and standard deviation in order to obtain an average profile of the current thermal conditions in the facilities. These statistics refer to values for each facility in terms of the 52 positions during the critical hour (14h00) for the three studied phases of the rearing process.
Simultaneously, the geostatistical analysis of THI (supported by GS+ software) was performed and considered as future input to determine the strategic points for positioning the sensors. The spatial dependence is analyzed by semivariogram fitting of THI, based on the assumption of intrinsic stationary process (Vieira et al., 1983Vieira, S.R.; Hatfield, J.L.; Nielsen, D.R.; Biggar, J.W. 1983. Geostatistical theory and application to variability of some agronomical properties. Hilgardia 51: 1-75.), which is estimated by Equation 3:
where: N(h) denotes the set of pairs of observation Z(xi) and Z(xi + h) separated by a lag distance h. The semivariogram is represented by the relation versus h. The semivariogram parameters of a theoretic model labeled as nugget “C0”; sill “C0 + C1”; and range “a” can be calculated from adjusting the mathematical model from. The spatial dependence (C0 (C0 + C1−1)) of attributes was analyzed according to Cambardella et al. (1994)Cambardella, C.A.; Moorman, T.B.; Novak, J.M.; Parkin, T.B.; Arlen, D.L.; Turco, R.F.; Konopka, A.E. 1994. Field-scale variability of soil properties in central Iowa soils. Soil Science Society of America Journal 58: 1501-1511., who considers the strong structured spatial dependence of semivariogram when presenting a nugget effect < 25 % of sill, mild ranging from 25 % to 75 % and weak if > 75 %. The semivariogram models were spherical, exponential and Gaussian, adjusted by software GS+, version 7. Afterward, these models were used to develop kriged maps (kriging) – Surfer software. The semivariogram model was selected taking into account the higher correlation coefficient (R2) that was obtained by the cross-validation method.
Step 3: Post-Processing - Determination of strategic positions for sensors
The results of the geostatistical analysis (semivariogram model, range) were used as inputs in Sanos Software to identify and obtain the research goal, that is, the most three representative points (positions in X and Y coordinate – Figure 2) to a future placement of the sensors in each broiler farm. The method used in Sanos makes a selection from 52 positions to obtain the most three representative positions by an Optimization Criterion, called as Ordinary Kriging (Van Groenigen et al., 1999Van Groenigen, J.W.; Siderius, W.; Stein, A. 1999. Constrained optimization of soil sampling for minimization of the kriging variance. Geoderma 87: 239-259.).
The decision to select three and not more than three points is due to economic reasons (costs) and the characteristics of the studied farms with negative pressure of ventilation systems. Each point requires two sensors (temperature and relative humidity) and negative pressure ventilation systems have three well-defined temperature zones (lower temperatures next to air inlet, middle temperatures around center of the house and higher temperatures close to exhaust fans). Therefore, this choice of three points matches with these prerogatives.
Results and Discussion
Environmental conditions - Descriptive analysis
After checking the thermal environment of each broiler house for the different bird ages evaluated during the research (Table 1), the critical period (14h00) and 52 positions inside the facilities, the results (average) are listed as follows.
For temperature, none of the studied facilities achieved the ideal conditions according to literature recommendations (Cobb-Vantress, 2012Cobb-Vantress. 2012. Broiler management guide. Available at:http://www.cobb-vantress.com/docs/default-source/management-guides/broiler-management-guide.pdf [Accessed Mar 07, 2016]
http://www.cobb-vantress.com/docs/defaul...
; Nicholson et al., 2004Nicholson, F.A.; Chambers, B.J.; Walker, A.W. 2004. Ammonia emissions from broiler litter and laying hen manure management systems. Biosystems Engineering 89: 175-185.). The ideal values of temperature are between 21 and 23 °C, between 19 and 21 °C and 18 °C for birds at 28, 35, and 42 days old, respectively. At 28 days of age, the Solid Wall broiler house presented the lowest temperature (25.4 °C), followed by the Dark House (26.7 °C), the Blue House (28.8 °C) and the Double Wide House (28.9 °C), respectively. At 35 days of age, the lowest temperature was registered in the Double Wide House (24.1 °C), followed by the Dark House (24.4 °C) and the Solid Wall (27.4 °C). Finally, at 42 days of age, the broiler house of type Dark House (24.2 °C) presented the lowest temperature, followed by the Solid Wall (25.4 °C), the Double Wide House (27.1 °C) and the Blue House (29.9 °C), respectively. These temperatures outside the ideal values can lead to significant economic losses due to poor growth rate, decreased feed efficiency and mortality (Donkoh, 1989Donkoh, A. 1989. Ambient temperature: a factor affecting performance and physiological response of broiler chickens. International Journal of Biometeorology 33: 259-265.; Nääs et al., 2014Nääs, I.A.; Garcia, R.G.; Caldara, F.R. 2014. Infrared thermal image for assessing animal health and welfare. Journal of Animal Behaviour and Biometeorology 2: 66-72.).
Relative humidity had a similar behavior to temperature, that is, almost all facilities presented a range of relative humidity with values higher than 77 % for each bird age stage, values that are absolutely outside the limits recommended by the literature for ideal conditions. The ideal values for relative humidity are between 50 and 65 % for birds at 28 days of age and between 50 and 70 % for birds at 35 and 42 days of age (Cobb-Vantress, 2012Cobb-Vantress. 2012. Broiler management guide. Available at:http://www.cobb-vantress.com/docs/default-source/management-guides/broiler-management-guide.pdf [Accessed Mar 07, 2016]
http://www.cobb-vantress.com/docs/defaul...
; Baracho et al., 2011Baracho, M.S.; Nääs, I.A.; Nascimento, G.R.; Cassiano, J.A.; Oliveira, K.R. 2011. Surface temperature distribution in broiler houses. Revista Brasileira de Ciência Avícola 13: 177-182.). An exception was the facility Blue House (unused pad cooling) where humidity was lower than 50 % for measurements for birds at 28 and 42 days of age. It had the ideal condition (52 %) when birds were 35 days old.
A similar irregular situation occurred with wind speed. In almost all sets of experiments, the four studied facilities did not present reasonable values (between 1.5 and 2.5 m s−1) according to literature recommendations (Cobb-Vantress, 2012Cobb-Vantress. 2012. Broiler management guide. Available at:http://www.cobb-vantress.com/docs/default-source/management-guides/broiler-management-guide.pdf [Accessed Mar 07, 2016]
http://www.cobb-vantress.com/docs/defaul...
; Yahav et al., 2001Yahav, S.; Straschnow, A.; Vax, E.; Razpakovski, V.; Shinder, D. 2001. Wind speed alters broiler performance under harsh environmental conditions. Poultry Science 80: 724-726.). Two exceptions were observed: the Blue House (at 28 days of age) with wind speed 1.60 m s−1 and the Double Wide House (at 42 days of age) with a wind speed of 1.50 m s−1. Meanwhile, the rest of cases were outside the ideal range. At 28 days of age, the mean values are: the Dark House (1.2 m s−1), the Double Wide House (0.8 m s−1) and the Solid Wall (0.4 m s−1), respectively. At 35 days of age, the highest value was observed for the Dark House (1.30 m s−1), followed by the Blue House (1.2 m s−1), the Solid Wall (0.9 m s−1) and the Double Wide House (0.8 m s−1). Finally, at 42 days of age, the Blue House registered (1.3 m s−1), the Dark House (1.2 m s−1) and the Solid Wall (1.2 m s−1), respectively.
The evaluated facilities in this study have automatic controllers in the ventilation system. However, it was observed that the values of measured variables are outside the recommended range for ideal conditions in broiler rearing. Information received by controllers was inadequate to manage both the appropriate number of exhaust fans and their operation time (switch on/off the ventilation system). Therefore, a better strategy must be implemented to improve the performance of the ventilation systems in relation to the thermal conditions observed inside the broiler houses.
The environmental data (Table 1) indicate an extreme overall condition of the microclimate that is not suitable for broiler rearing during the most critical period and for the three phases (28, 35, and 42 days old). It seems that the response of the ventilation systems is not efficient enough to ensure an adequate microclimate inside the facilities. Ventilation systems are necessary to reduce temperature, therefore, they should be re-dimensioned. Controllers require representative and accurate information of the climatic conditions inside the facilities to infer the adequate response: the activation of the appropriate number of exhaust fans and evaporative panels need to mitigate the current problem. A new and more precise positioning of sensors could support controllers in this task. If automatic response of the ventilation system is improved during the hottest hours, the system could adapt itself to other less severe environmental adversities (heat episodes) than those observed in these experiments.
The descriptive analysis shows a clear deficiency in the ventilation system that is persistent in these broiler houses (Bustamante et al., 2013Bustamante, E.; García-Diego, F.J.; Calvet, S.; Estellés, F.; Beltrán, P.; Hospitaler, A.; Torres, A.G. 2013. Exploring ventilation efficiency in poultry buildings: the validation of computational fluid dynamics (CFD) in a cross-mechanically ventilated broiler farm. Energies 6: 2605-2623.). Actually, birds in these facilities (Dark House, Double Wide House, and Solid Wall) remained under thermal stress, that is, the temperature was above 20 °C, as recommended by the Broiler Management Guide by Cobb-Vantress (2012)Cobb-Vantress. 2012. Broiler management guide. Available at:http://www.cobb-vantress.com/docs/default-source/management-guides/broiler-management-guide.pdf [Accessed Mar 07, 2016]
http://www.cobb-vantress.com/docs/defaul...
, at the final production stage with possible negative consequences in feed conversion and weight of the bird.
THI - Thermal Comfort Index and geostatistics
Semivariograms for the four types of facilities were calculated and adjusted, as shown in Table 2. The best BH model was the Gaussian model and for DH, the spherical model. For the facility DWH, the exponential model was fitted at 28 and 42 days of age and spherical model at 35 days of age. For the SW, semivariograms were fitted to the Gaussian model at 35 and 42 days of age. At 28 days of age, the semivariogram reflected “pure nugget effect”. In this case, the variability THI quantified by the semivariogram is attributed to the random effect, that is, nothing is concluded about the spatial dependence (Vieira et al., 1983Vieira, S.R.; Hatfield, J.L.; Nielsen, D.R.; Biggar, J.W. 1983. Geostatistical theory and application to variability of some agronomical properties. Hilgardia 51: 1-75.).
The range is the distance at which the sampling points are spatially dependent on each other (Journel and Huijbregts, 1991Journel, A.G.; Huijbregts, C.J. 1991. Mining Geostatistics. Academic Press, London, UK.), that is, points located in an area with a radius smaller than or equal to the range of similar points. For birds at 28 days old, the longest range was obtained at facility DWH (22.8 m), followed by DH (15.9 m) and BH (15.1 m). At 35 days old, DWH presented the longest range (22.8 m), followed by DH (17.5 m), SW (14.7 m), and BH (13.7 m) respectively. Finally, at 42 days of age, DWH again presented the greatest value (56.7 m), followed by DH (18.4 m), BH (17.5 m) and SW (15.1 m).
All facilities have a high spatial dependence (< 25 %) in relation to THI, an exception occurred at DWH (when birds were 42 days old), in that case the value was 41 % (Table 2). The greater the spatial dependence (C0 (C0+C1−1)), the lower the contribution of the nugget effect on data variability and, then, the kriging is better.
The coefficient of determination (R2) had values higher than a minimum of 0.75 in almost all the facilities and for each bird age. Only at DWH, at 35 days of age, the coefficient of determination was lower than 0.75 (0.662). All variables presented coefficient of determination (R2) above 0.75, that is, the adjusted models explained 75 % of the variability in the values of estimated semivariance.
The need for an effective control and understanding of the internal environment in broiler houses is the main reason to use different mathematical and computational methods such as the geostatistics analysis (Chowdhury et al., 2013Chowdhury, S.; Themudo, G.E.; Sandberg, M.; Ersbøll, A.K. 2013. Spatio-temporal patterns of Campylobacter colonization in Danish broilers. Epidemiology and Infection 141: 997-1008.; Miles et al., 2008Miles, D.M.; Rowe, D.E.; Owens, P.R. 2008. Winter broiler litter gases and nitrogen compounds: temporal and spatial trends. Atmospheric Environment 42: 3351-3363.; Miragliotta et al., 2006Miragliotta, M.Y.; Nääs, I.A.; Manzione, R.L.; Nascimento, F.F. 2006. Spatial analysis of stress conditions inside broiler house under tunnel ventilation. Scientia Agricola 63: 426-432.; Pereira et al., 2012Pereira, P.A.; Yanagi Junior, T.; Silva, J.P.; Lima, R.R.; Campos, A.T.; Abreu, L.H.P. 2012. Technical evaluation of artificial lighting systems for broiler houses. Engenharia Agrícola 32: 1011-1024.).
Strategic positioning of sensors
Maps from THI data (Surfer® 8.0 Software) describe graphically the thermal conditions inside the facilities. The three representative points obtained from the ordinary kriging algorithm indicate the best-differentiated geospatial positions (points X, Y) where sensors should be appropriately placed (Pereira et al., 2013Pereira, G.T.; Souza, Z.M.; Teixeira, D.B.; Montanari, R.; Marques Júnior, J. 2013. Optimization of the sampling scheme for maps of physical and chemical properties estimated by kriging. Revista Brasileira de Ciência do Solo 37: 1128-1135.). Figures in this subsection are colored with three main colors and their degradation: red, yellow and green, an analogy with the TLP meaning (Traffic Light Panel). Green color codifies thermal comfort, yellow is for warning situation, and red color codifies dangerous conditions related to the THI index. This TLP association has been used as a potential tool to support decisions after statistical analysis and data mining applications (Gibert et al., 2008Gibert, K.; Garcia-Rudolph, A.; Rodriguez-Silva, G. 2008. The role of KDD support-interpretation tools in the conceptualization of medical profiles. Acta Informatica Medica 16: 178-182.; Gibert et al., 2012Gibert, K.; Conti, D.; Vrecko, D. 2012. Assisting the end-user to the interpretation of profiles for decision support: an application to WWTP. Environmental Engineering and Management Journal 11: 931-944.; Gibert and Conti, 2014Gibert, K.; Conti, D. 2014. On the understanding of profiles by means of post-processing techniques: an application to financial assets. International Journal of Computer Mathematics 73: 807-820.).
For birds at 28 days of age (Figure 3) at BH, thermal conditions, according to the classification of the THI index, described warning conditions in about 78 % of the total area. The framework suggested that two sensors should be placed close to the middle of the facility and the last one next to the right side wall. At DH, about 90 % of its total area is in warning conditions and 10 % in dangerous conditions (regions of right and left side next to air inlet and the cooling pad). In this case, sensors should be placed in three regions (differentiated by their temperatures) according to previous experiences and works (Miragliotta et al., 2006Miragliotta, M.Y.; Nääs, I.A.; Manzione, R.L.; Nascimento, F.F. 2006. Spatial analysis of stress conditions inside broiler house under tunnel ventilation. Scientia Agricola 63: 426-432.). The facility DWH had the worst conditions for broiler production. In the whole area (100 %), thermal comfort was in dangerous conditions. Sensors should be positioned across the longitudinal area between the sides and the middle zone following the direction of the X axis coordinate. At facility SW, it was not possible to establish the most representative positions to place sensors due to the “pure nugget effect”.
− Temperature and Humidity Index Distribution and Positioning of Sensors in each facility (summer season, 14h00, birds 28 days old). THI = temperature and humidity index.
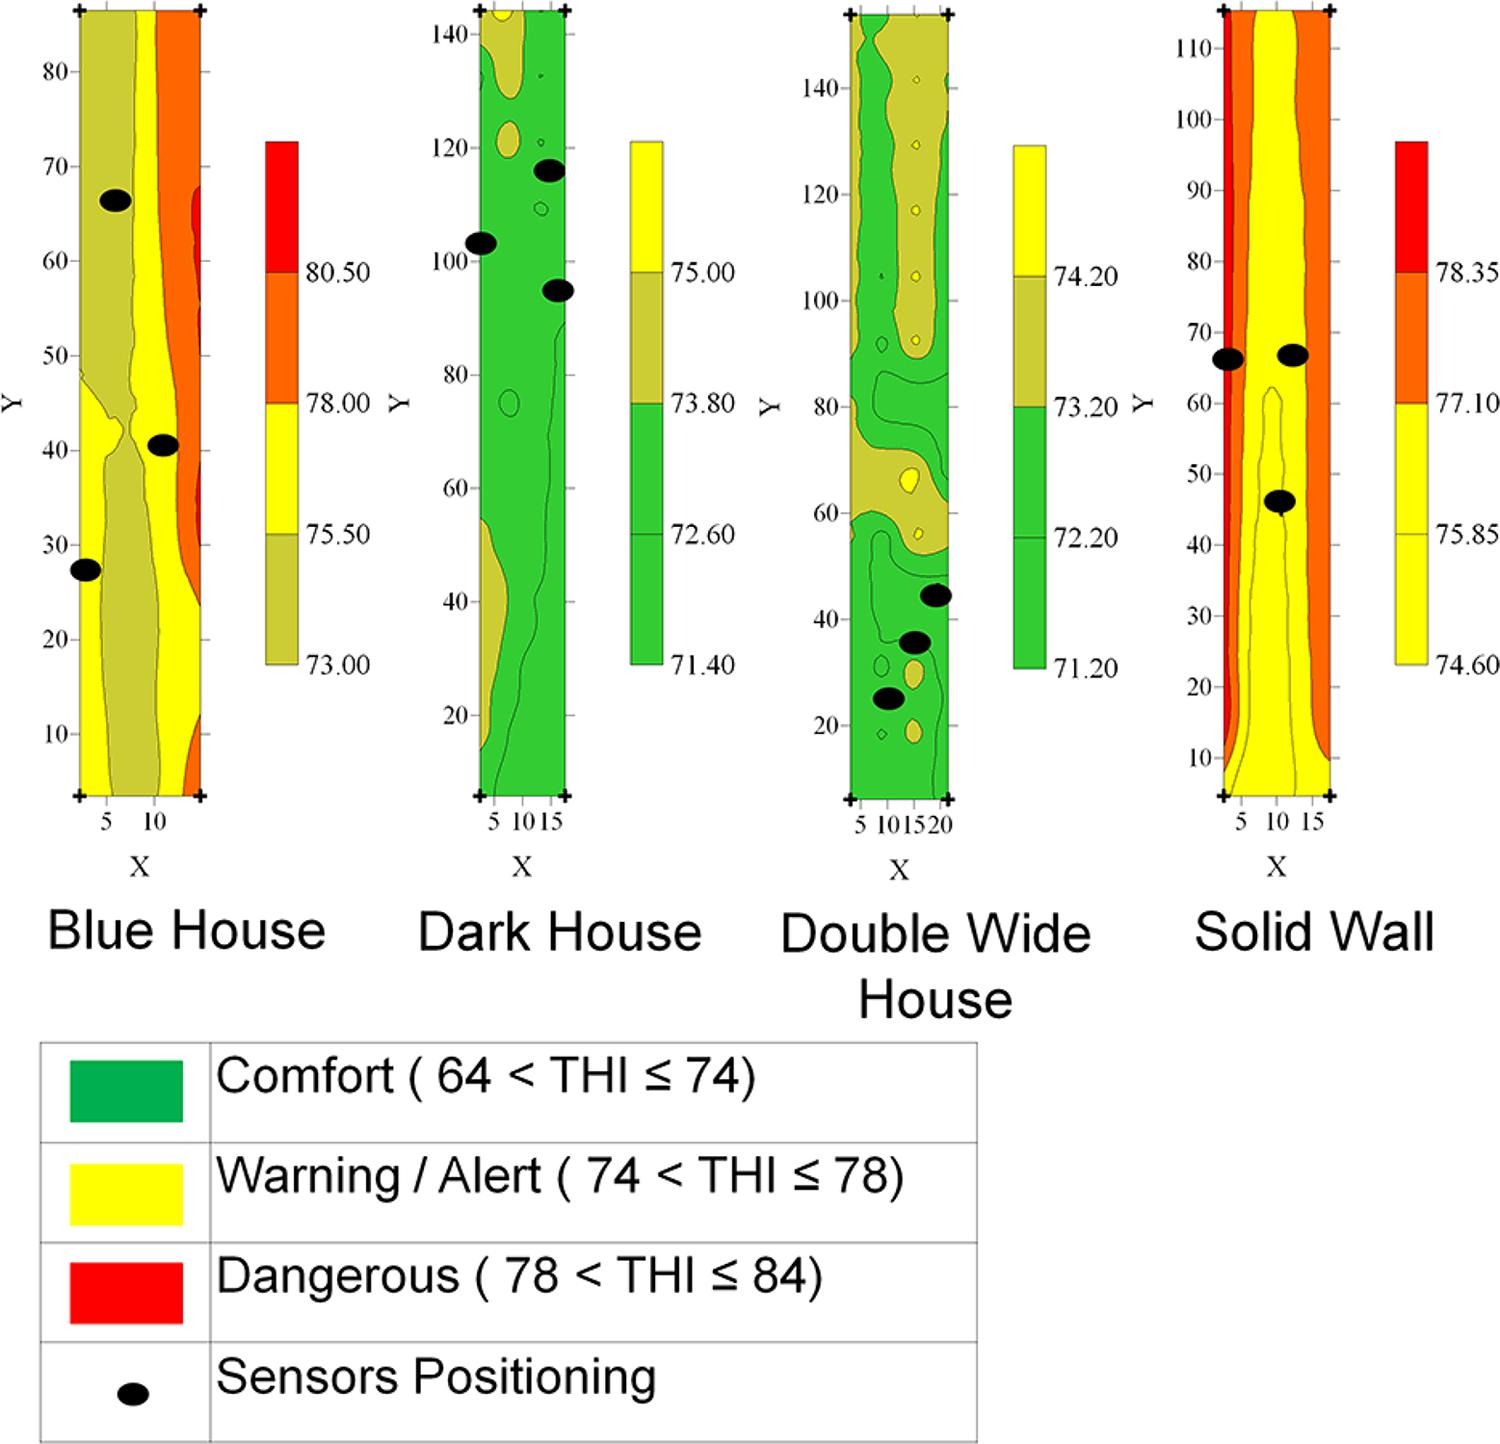
For birds at 35 days of age (Figure 4), the results were: the BH facility had 33 % of its total area in comfort conditions, 65 % in warning conditions and 2 % in dangerous conditions. Therefore, two sensors should be positioned in the zones identified as warnings (air inlet - left corner and in the center of the facility) and a third sensor at the transition space between the comfort and the warning areas (next to exhaust fans). The DH facility presented 87 % of comfort conditions. In this case, sensors should be placed next to exhaust fans at the corners (side walls). The DWH facility presented 80 % of its total area in comfort conditions. Sensors are close to the air inlet zone. At SW facility (73 % of its total area is in warning conditions), sensors should be placed in the middle zone, one in the center (in warning conditions) and the other two at the sides where dangerous conditions were detected.
− Temperature and Humidity Index Distribution and Positioning of Sensors in each facility (summer season, 14h00, birds 35 days old). THI = temperature and humidity index.
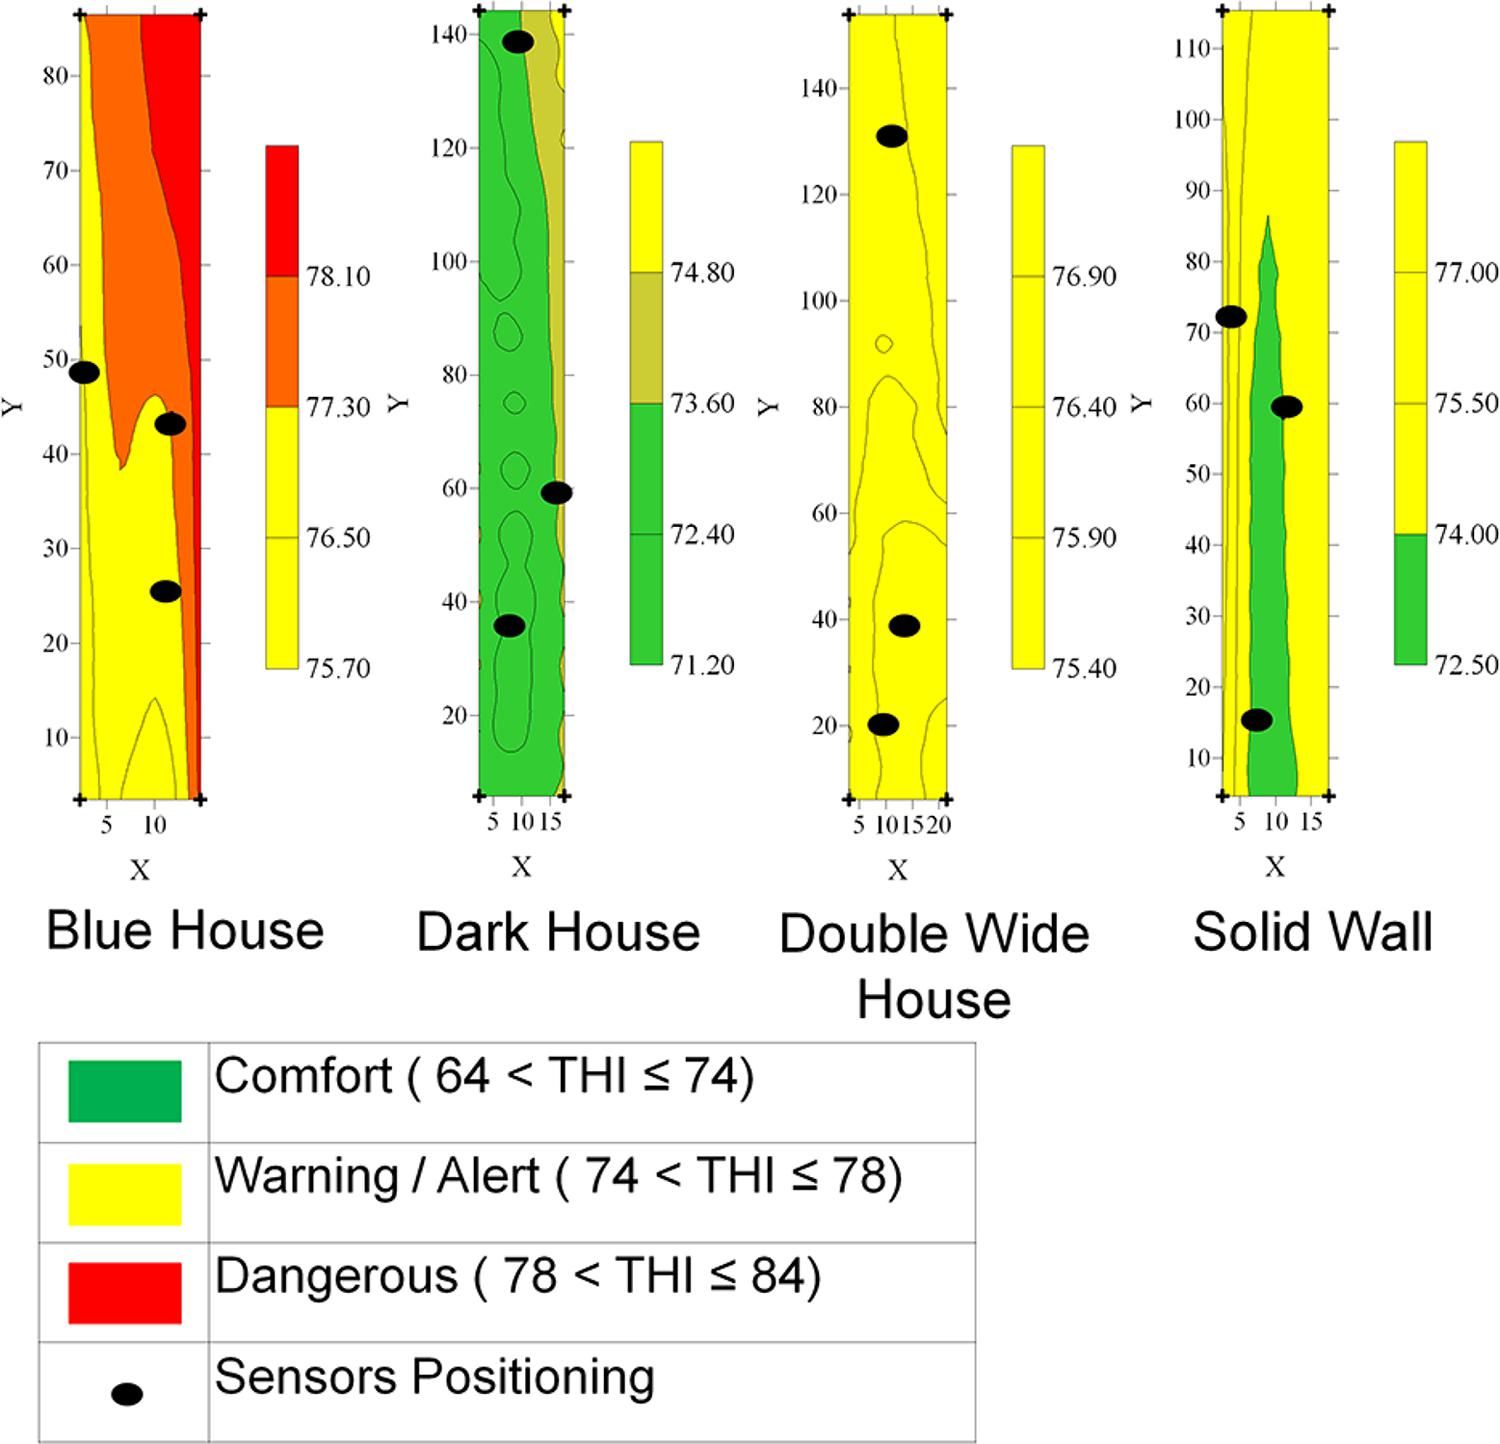
Finally, for birds at 42 days of age (Figure 5), the configuration of sensors positioning is described as follows: The BH facility is in warning conditions (air inlet zone) and in dangerous conditions (33 % of the total area) next to exhaust fans. Sensors should be positioned at the warning zones and the transition zone (between the warning and the dangerous conditions). DH presented about 80 % of its total area in comfort status. Two sensors should be positioned in the transition zone (from comfort to warning zone) and a third one close to the air inlet zone. The entire area of DWH facility is in warning conditions. Sensors should be placed following the direction of the Y axis, two sensors close to the air inlet zone and one next to exhaust fans. Only 17 % of the total area of SW is in a good status (air inlet zone) and 83 % in warning conditions. One sensor should be positioned at the comfort zone, a second one at the transition zone and the last one at the warning zone (left sidewall).
− Temperature and Humidity Index Distribution and Positioning of Sensors in each facility (summer season, 14h00, birds 42 days old). THI = temperature and humidity index.
The use of X and Y coordinates (Table 3) allows to identify the location of the main representative points. This would help a better monitoring of thermal conditions for each facility at each bird age in future experiments.
Considering the assessment of the points recommended by the optimization algorithm (ordinary kriging) and grouping the total results for the whole cycle (28, 35, and 42 days old) by means of a superposition of each map (three maps for each facility and 9 sensors positions) and dividing the maps into five main areas (air inlet, air outlet, right and left side lateral areas, and middle area), some important results are listed as follows. Sensors positions in BH occupied two significant regions, 78 % (7 of 9 sensor positions) was labeled to be positioned in the center of barn and 22 % near the left side. For DH, four regions were representative (55 % of sensors positions were detected in the center, 23 % near the right side, 11 % near the left side and 11 % near the air outlet). In DWH, three regions were identified for sensor positioning (55 % of the 9 sensor positions should be in the center area of the facility, 33 % near air inlet and 12 % near air outlet). Finally, for SW, three main regions are suggested to place the sensors (50 % in the center of the barn, 33 % near the left side and 17 % near the air inlet).
Based on the global results described in the previous paragraph and considering the actual conditions of the facilities, a final overview is presented. Sensors located at inlet areas described the behavior of the inlet air due to the changes and performance of the pad cooling. Sensors located at sidewalls demonstrated how external conditions influence internal conditions, once the isolating material is not the most adequate (Carvalho et al., 2012Carvalho, T.M.R.; Moura, D.J.; Souza, Z.M.; Souza, G.S.; Bueno, L.G.F.; Lima, K.A.O. 2012. Use of geostatistics on broiler production for evaluation of different minimum ventilation systems during brooding phase. Revista Brasileira de Zootecnia 41: 194-202.; Menegali et al., 2013Menegali, I.; Tinôco, I.F.; Carvalho, C.D.; Souza, C.D.F.; Martins, J.H. 2013. Behavior of environmental variables on minimum ventilation systems for the production of broiler chickens. Revista Brasileira de Engenharia Agrícola e Ambiental 17: 106-113 (in Portuguese, with abstract in English).). In addition, sidewalls are affected by the orientation of the building in relation to sun radiation. Sensors in the middle area of the barn are already a common strategy that has been used in automatic ventilation systems (most automatic systems have sensors located at the middle of the facility without taking into consideration the lateral sidewalls). Then, this methodological approach has shown to be efficient to detect the different positions that describe the environment conditions inside the broiler houses (for the four types of studied facilities) during a critical and representative period (climatic conditions in southeastern Brazilian in the summer season). Unsuitable thermal conditions were detected during the three phases of the rearing process at the four facilities with measurements that were registered at different dates. The strategic positioning of sensors could be adopted in the future for a feasible solution oriented to support controllers. A better control for the ventilation system could be achieved due to correct position of the sensors. When accurate information is sent to controllers, the ventilation system has a better response and the performance improvement is more feasible.
Conclusions
The three-step methodological approach was proven to be efficient to detect the most representative points for sensors positioning. Sensors in these positions could send accurate information to automatic controllers of the ventilation systems in the four facilities studied during the research. It is a preliminary solution that needs to be evaluated empirically by means of two future works: (1) Comparison of microclimate conditions with the current positioning for sensors versus the proposal of this new strategic positioning, during the same critical period (from 12h00 to 15h00 with more samples and statistical tests), and (2) monitoring proposal with samples of 24 h (all day long) in order to validate whether this new positioning is able to describe accurately the microclimate inside the facilities as well as verify if the performance of the ventilation system is also improved.
The hypothesis is to apply the approach developed in this research because it does not require further economic efforts to invest (only changes for the current positioning of sensors are suggested). The objective is to implement a robust decision support system for the control of ventilation systems in broiler houses in Brazil, often affected negatively during the summer season.
Acknowledgments
The authors would like to thank the Brazilian National Council for Scientific and Technological Development (CNPq) and the São Paulo State Foundation for Research Support (FAPESP) for important financial support.
References
- Alvares, C.A.; Stape, J.L.; Sentelhas, P.C.; Moraes, G.; Leonardo, J.; Sparovek, G. 2013. Köppen's climate classification map for Brazil. Meteorologische Zeitschrift 22: 711-728.
- Baracho, M.S.; Nääs, I.A.; Nascimento, G.R.; Cassiano, J.A.; Oliveira, K.R. 2011. Surface temperature distribution in broiler houses. Revista Brasileira de Ciência Avícola 13: 177-182.
- Bustamante, E.; García-Diego, F.J.; Calvet, S.; Estellés, F.; Beltrán, P.; Hospitaler, A.; Torres, A.G. 2013. Exploring ventilation efficiency in poultry buildings: the validation of computational fluid dynamics (CFD) in a cross-mechanically ventilated broiler farm. Energies 6: 2605-2623.
- Calvet, S.; Estellés, F.; Cambra-López, M.; Torres, A.G.; Van Den Weghe, H.F. 2011. The influence of broiler activity, growth rate, and litter on carbon dioxide balances for the determination of ventilation flow rates in broiler production. Poultry Science 90: 2449-2458.
- Cambardella, C.A.; Moorman, T.B.; Novak, J.M.; Parkin, T.B.; Arlen, D.L.; Turco, R.F.; Konopka, A.E. 1994. Field-scale variability of soil properties in central Iowa soils. Soil Science Society of America Journal 58: 1501-1511.
- Carvalho, T.M.R.; Moura, D.J.; Souza, Z.M.; Souza, G.S.; Bueno, L.G.F.; Lima, K.A.O. 2012. Use of geostatistics on broiler production for evaluation of different minimum ventilation systems during brooding phase. Revista Brasileira de Zootecnia 41: 194-202.
- Chowdhury, S.; Themudo, G.E.; Sandberg, M.; Ersbøll, A.K. 2013. Spatio-temporal patterns of Campylobacter colonization in Danish broilers. Epidemiology and Infection 141: 997-1008.
- Cobb-Vantress. 2012. Broiler management guide. Available at:http://www.cobb-vantress.com/docs/default-source/management-guides/broiler-management-guide.pdf [Accessed Mar 07, 2016]
» http://www.cobb-vantress.com/docs/default-source/management-guides/broiler-management-guide.pdf - Curi, T.M.R.C.; Vercellino, R.A.; Massari, J.M.; Souza, Z.M.; Moura, D.J. 2014. Geostatistic to evaluate the environmental control in different ventilation systems in broiler houses. Engenharia Agrícola 34: 1062-1074 (in Portuguese, with abstract in English).
- Donkoh, A. 1989. Ambient temperature: a factor affecting performance and physiological response of broiler chickens. International Journal of Biometeorology 33: 259-265.
- Gabriel Filho, L.R.A.; Pereira, D.F.; Barato, F.F.; Magalhães, M.M. 2011. Method of numerical correction of errors occasioned by delay of records during the monitoring of environmental variables of interest for animal production. Engenharia Agrícola 31: 835-846.
- Gibert, K.; Conti, D. 2014. On the understanding of profiles by means of post-processing techniques: an application to financial assets. International Journal of Computer Mathematics 73: 807-820.
- Gibert, K.; Conti, D.; Vrecko, D. 2012. Assisting the end-user to the interpretation of profiles for decision support: an application to WWTP. Environmental Engineering and Management Journal 11: 931-944.
- Gibert, K.; Garcia-Rudolph, A.; Rodriguez-Silva, G. 2008. The role of KDD support-interpretation tools in the conceptualization of medical profiles. Acta Informatica Medica 16: 178-182.
- Journel, A.G.; Huijbregts, C.J. 1991. Mining Geostatistics. Academic Press, London, UK.
- Khan, R.U.; Naz, S.; Nikousefat, Z.; Tufarelli, V.; Javdani, M.; Rana, N.; Laudadio, V. 2011. Effect of vitamin E in heat-stressed poultry. World’s Poultry Science Journal 67: 469-478.
- Kwon, K.S.; Lee, I.B.; Zhang, G.Q.; Ha, T. 2015. Computational fluid dynamics analysis of the thermal distribution of animal occupied zones using the jet-drop-distance concept in a mechanically ventilated broiler house. Biosystems Engineering 136: 51-68.
- Lima, N.D.S.; Garcia, R.G.; Nääs, I.A.; Caldara, F.R.; Pons, P. 2015. Model-predicted ammonia emission from two broiler houses with different rearing systems. Scientia Agricola 72: 393-399.
- Medeiros, C.M.; Baêta, F.C.; Oliveira, R.F.M.; Tinôco, I.F.F.; Albino, L.F.T.; Cecon, P.R. 2005. Environmental thermal index of productivity for broiler chickens. Revista Brasileira de Engenharia Agrícola e Ambiental 9: 660-665 (in Portuguese, with abstract in English).
- Menegali, I.; Tinôco, I.F.; Carvalho, C.D.; Souza, C.D.F.; Martins, J.H. 2013. Behavior of environmental variables on minimum ventilation systems for the production of broiler chickens. Revista Brasileira de Engenharia Agrícola e Ambiental 17: 106-113 (in Portuguese, with abstract in English).
- Menezes, A.G.; Nääs, I.A.; Baracho, M.S. 2010. Identification of critical points of thermal environment in broiler production. Revista Brasileira de Ciência Avícola 12: 21-29.
- Miles, D.M.; Brooks, J.P.; MacLaughlin, M.R.; Rowe, D.E. 2013. Broiler litter ammonia emissions near sidewalls, feeders, and waters. Poultry Science 92: 1693-1698.
- Miles, D.M.; Rowe, D.E.; Owens, P.R. 2008. Winter broiler litter gases and nitrogen compounds: temporal and spatial trends. Atmospheric Environment 42: 3351-3363.
- Miragliotta, M.Y.; Nääs, I.A.; Manzione, R.L.; Nascimento, F.F. 2006. Spatial analysis of stress conditions inside broiler house under tunnel ventilation. Scientia Agricola 63: 426-432.
- Mirzaee-Ghaleh, E.; Omid, M.; Keyhani, A.; Dalvand, M.J. 2015. Comparison of fuzzy and on/off controllers for winter season indoor climate management in a model poultry house. Computers and Electronics in Agriculture 110: 187-195.
- Moore, P.A.; Miles, D.; Burns, R.; Pot, D.; Berg, K.; Choif, I.H. 2011. Ammonia emission factors from broiler litter in barns, in storage, and after land application. Journal of Environmental Quality 40: 1395-1404.
- Nääs, I.A.; Garcia, R.G.; Caldara, F.R. 2014. Infrared thermal image for assessing animal health and welfare. Journal of Animal Behaviour and Biometeorology 2: 66-72.
- Nääs, I.A.; Romanini, C.E.B.; Salgado, D.D.A.; Lima, K.A.O.; Vale, M.M.; Labigalini, M.R.; Souza, S.R.L.; Menezes, A.G.; Moura, D.J. 2010. Impact of global warming on beef cattle production cost in Brazil. Scientia Agricola 67: 1-8.
- Nicholson, F.A.; Chambers, B.J.; Walker, A.W. 2004. Ammonia emissions from broiler litter and laying hen manure management systems. Biosystems Engineering 89: 175-185.
- Pereira, G.T.; Souza, Z.M.; Teixeira, D.B.; Montanari, R.; Marques Júnior, J. 2013. Optimization of the sampling scheme for maps of physical and chemical properties estimated by kriging. Revista Brasileira de Ciência do Solo 37: 1128-1135.
- Pereira, P.A.; Yanagi Junior, T.; Silva, J.P.; Lima, R.R.; Campos, A.T.; Abreu, L.H.P. 2012. Technical evaluation of artificial lighting systems for broiler houses. Engenharia Agrícola 32: 1011-1024.
- Petracci, M.; Bianchi, M.; Cavani, C.; Gaspari, P.; Lavazza, A. 2006. Preslaughter mortality in broiler chickens, turkeys and spent hens under commercial slaughtering. Poultry Science 85: 1660-1664.
- Razuki, W.M.; Mukhlis, S.A.; Jasim, F.H.; Hamad, R.F. 2011. Productive performance of four commercial broilers genotypes reared under high ambient temperatures. International Journal of Poultry Science 10: 87-92.
- Renaudeau, D.; Collin, A.; Yahav, S.; Basilio, V.; Gourdine, J.L.; Collier, R.J. 2012. Adaptation to hot climate and strategies to alleviate heat stress in livestock production. Animal 6: 707-728.
- Rojano, F.; Bournet, P.E.; Hassouna, M.; Robin, P.; Kacira, M.; Choi, C.Y. 2015. Modeling heat and mass transfer of a broiler house using computational fluid dynamics. Biosystems Engineering 136: 25-38.
- Roussan, D.A.; Khwaldeh, G.Y.; Haddad, R.R.; Shaheen, I.A.; Salameh, G.; Al Rifai, R. 2008. Effect of ascorbic acid, acetylsalicylic acid, sodium bicarbonate, and potassium chloride supplementation in water on the performance of broiler chickens exposed to heat stress. The Journal of Applied Poultry Research 17: 141-144.
- Thom, E.C. 1959. The discomfort index. Weatherwise 12: 57-60.
- Van Groenigen, J.W.; Siderius, W.; Stein, A. 1999. Constrained optimization of soil sampling for minimization of the kriging variance. Geoderma 87: 239-259.
- Vieira, S.R.; Hatfield, J.L.; Nielsen, D.R.; Biggar, J.W. 1983. Geostatistical theory and application to variability of some agronomical properties. Hilgardia 51: 1-75.
- Yahav, S.; Straschnow, A.; Luger, D.; Shinder, D.; Tanny, J.; Cohen, S. 2004. Ventilation, sensible heat loss, broiler energy, and water balance under harsh environmental conditions. Poultry Science 83: 253-258.
- Yahav, S.; Straschnow, A.; Vax, E.; Razpakovski, V.; Shinder, D. 2001. Wind speed alters broiler performance under harsh environmental conditions. Poultry Science 80: 724-726.
Edited by
Publication Dates
-
Publication in this collection
Mar-Apr 2017
History
-
Received
24 Sept 2015 -
Accepted
03 June 2016