ABSTRACT
The present work analyzes the effectiveness of windbreaks against wind erosion through the study of streamline patterns and turbulent flow by means of sonic anemometry and sediment traps. To this end, windbreaks composed of plastic meshes (7.5 m long and 0.7 m tall) were used. Windbreaks are a good means to reduce wind erosion, as they produce a positive effect on the characteristics of air currents that are related to wind erosion processes. Due to their ease of installation and dismantling, plastic meshes are widely used in areas where they are not required permanently. In our study, the use of a mesh of 13 × 30 threads cm−2 and 39 % porosity resulted in an average reduction of 85 % in face velocity at a height of 0.4 m and a distance of 1 m from the windbreak. The turbulence intensity i increased behind the windbreak because the reduction of mean of air speed on the leeside caused by the flow of air through the windbreak. Fluctuation levels, however, remained stable. The mean values of turbulence kinetic energy k decreased by 65 % to 86 % at a distance of 1 m from the windbreak and at a height of 0.4 m. The windbreak reduces erosion and sediment transportation 2 m downwind (2.9 times the windbreak height). Nevertheless, sediment transportation was not reduced at a height of 1.0 m and the effect of the windbreak was not observed at a distance of 6 m downwind (8.6 m times the windbreak height).
Keywords
streamline patterns; semiarid environment; turbulent flow; energy levels; olive
Introduction
Windbreaks are barriers used to reduce and redirect wind. The aerodynamic effects of windbreaks make them an excellent tool as protective barriers against soil erosion caused by wind. The ability of windbreaks to protect against soil erosion by wind is of particular relevance in semiarid regions, where the wind moves enormous amounts of soil, resulting thus in ecological imbalance (Lozano et al., 2013Lozano, F.J.; Soriano, M.; Martinez, S.; Asensio, C. 2013. The influence of blowing soil trapped by shrubs of fertility in Tabernas District (SE, Spain). Land Degradation & Development 24: 575-581.). Several authors have studied the relationships between wind speed and wind erosion, and the influence of soil typology and vegetation (López et al., 2000López, M.V.; Gracia, R.; Arrue, J.L. 2000. Effects of reduced tillage on soil surface properties affecting wind erosion in semiarid fallow lands of Central Aragon. European Journal of Agronomy 12: 191-199.; Liu et al., 2003Liu, L.Y.; Shi, P.J.; Zou, X.Y.; Gao, S.Y.; Yan, P.; Li, X.Y.; Dong, Z.B.; Wang, J.H. 2003. Short-term dynamic of wind erosion of three newly cultivated grassland soils in Northern China. Geoderma 115: 55-64.; Li et al., 2004Li, L.R.; Zhao, L.Y.; Zhang, T.H. 2004. Wind erosion and airborne dust deposition in farmland during spring in the Horqin Sandy Land of eastern inner Mongolia, China. Soil and Tillage Research 75: 121-130.).
Windbreaks exert a drag force that results in a net loss of momentum in the airflow and a change of the mean velocity. Plant cover presents a porous obstacle to the approaching airflow, similar to windbreaks, forcing air to flow through the porous obstacle at a reduced speed and accelerate over the top (Molina-Aiz et al., 2006Molina-Aiz, F.D.; Valera, D.L.; Alvarez, A.J.; Madueño, A. 2006. A wind tunnel study of airflow through horticultural crops: determination of the drag coefficient. Biosystems Engineering 93: 447-457.). The aerodynamic effect is commonly expressed in terms of the resistance to the flow, or by used a dimensionless quantity such as a drag coefficient (Jacobs, 1985Jacobs, A.F.G. 1985. The normal force coefficient on a thin closed fence. Boundary-Layer Meteorology 32: 329-335.). Thus, many studies have been carried out to determine the natural windbreak drag coefficient (Guan et al., 2003Guan, D.; Zhang, Y.; Zhu, T. 2003. A wind-tunnel study of windbreak drag. Agricultural Forest Meteorology 118: 75-84., 2009; Lu et al., 2013Lu, Y.; Guan, Z.; Gurgenci, H.; Zou, Z. 2013. Windbreak walls reverse the negative effect of crosswind in short natural draft dry cooling towers into a performance enhancement. International Journal of Heat and Mass Transfer 63: 162-170.). Meshes are widely used in agricultural engineering, as not only windbreaks, but also as insect-proof screens to protect crops, among other uses. Research has focused on the analysis of windbreak geometric characteristics (Alvarez et al., 2006Alvarez, A.J.; Valera, D.L.; Molina-Aiz, F.D. 2006. A method for the analysis of geometric characteristics of protection screens. Acta Horticulturae 719: 557-564., 2012Alvarez, A.J.; Oliva, R.; Valera, D.L. 2012. Software for the geometric characterisation of insect-proof screens. Computers and Electronics in Agriculture 82: 134-144.), their aerodynamic behavior in wind tunnels (Valera et al., 2006Valera, D.L.; Molina-Aiz, F.D.; Álvarez, A.J. 2006. Aerodynamic analysis of several insect-proof screens used in greenhouses. Spanish Journal of Agricultural Research 4: 273-279.) and in the field by means of anemometry (Molina-Aiz et al., 2009Molina-Aiz, F.D.; Valera, D.L.; Peña, A.A.; Gil, J.A.; López, A. 2009. A study of natural ventilation in an Almería-type greenhouse with insect screens by means of tri-sonic anemometry. Biosystems Engineering 104: 224-242., 2011Molina-Aiz, F.D.; Valera, D.L.; López, A. 2011. Airflow at the openings of a naturally ventilated Almería-type greenhouse with insect-proof screens. Acta Horticulturae 893: 545-552.), in addition to their effect on both the microclimate (Molina-Aiz et al., 2012aMolina-Aiz, F.D.; Valera, D.L.; López, A.; Álvarez, A.J. 2012a. Analysis of cooling ventilation efficiency in a naturally ventilated Almería-type greenhouse with insect screens. Acta Horticulturae 927: 551-558.; López et al., 2014López, A.; Valera, D.L.; Molina-Aiz, F.D.; Peña, A.; Marín, P. 2014. Microclimate evaluation of a new design of insect-proof screen in a Mediterranean greenhouse. Spanish Journal of Agricultural Research 4: 273-279.) and the crop (Molina-Aiz et al., 2012bMolina-Aiz, F.D.; Valera, D.L.; Escamirosa, C.; López, A.; Álvarez, A.J. 2012b. Effects of insect-proof screens used in greenhouse on microclimate and fruit yield of tomato (Solanum lycopersicum L.) in a Mediterranean climate. Acta Horticulturae 927: 707-714.). Moreover, the deterioration of the windbreak materials because of meteorological conditions in the field has also been analyzed in the scientific literature (López et al., 2013López, A.; Valera, D.L.; Molina-Aiz, F.D.; Peña, A.; Marín, P. 2013. Field analysis of the deterioration after some years of used of four insect-proof screens utilized in Mediterranean greenhouses. Spanish Journal of Agricultural Research 11: 958-967.).
Several synthetic windbreaks with different porosity degrees have been tested in a wind tunnel for their ability to reduce wind velocity (Cornelis and Gabriels, 2005Cornelis, W.M.; Gabriels, D. 2005. Optimal windbreak design for wind-erosion control. Journal of Arid Environments 61: 315-332.) with the objective to determine their effect against wind erosion (Dong et al., 2007Dong, Z.; Luo, W.; Qian, G.; Wang, H. 2007. A wind tunnel simulation of the mean velocity fields behind upright porous fences. Agricultural and Forest Meteorology 146: 82-93.; Wang et al., 2013Wang, X.; Wang, G.; Lang, L.; Hua, T.; Wang, H. 2013. Aeolian transport and sandy desertification in semiarid China: a wind tunnel approach. Land Degradation & Development 24: 605-612.). Simulation models have also been developed to this end (Yeh et al., 2010Yeh, C.P.; Tsai, C.H.; Yang, R.J. 2010. An investigation into the sheltering performance of porous windbreaks under various wind directions. Journal of Wind Engineering & Industrial Aerodynamics 98: 520-532.; Giannoulis et al., 2013Giannoulis, A.; Mistriotis, A.; Papardaki, N.; Briassoulis, D. 2013. Airflow around artificial windbreaks with elastic support. Acta Horticulturae 1008: 63-68.), but there is a lack of knowledge regarding the real behavior of windbreaks in the field as a means of protection against wind erosion.
Materials and Methods
The present work uses sonic anemometry to determine the streamline patterns of a windbreak installed in a typical Mediterranean olive field and its effectiveness against wind erosion through the analysis of turbulent flow. In these areas and after tillage, these hapli-chromic Luvisols (IUSS Working Group WRB, 2014; FAO, 2015Food and Agriculture Organization of the United Nations (FAO). 2015. World Reference Base for Soil Resource 2014. International soil classification system for naming soils and creating legends for soil maps. FAO, Rome, Italy. (World Soil Resources Reports, 106).) are susceptible to wind erosion, but soon, they tend to be stabilized by surface crusting. Installing removable windbreaks following tillage is a common practice to allow the formation of surface crusts, mainly morning dew, and thus reduce erosion.
Site and windbreak description
The measurements were carried out in an arid zone (37°07′ N, 2°18′ W, altitude 570 m) in the southeastern province of Almería, Spain, close to the Tabernas Desert, one of the few examples of true semi-deserts in Europe. The study site was characterized by highly erosive torrential rainfalls. The measurements were performed in an olive field with trees planted in rows with a spacing of 7 m and 5 m between trees (Figure 1A). Table 1 shows the weather conditions during the 2-hour experiments (with sonic anemometers), carried out on a typical sunny day. Measurement tests were performed under prevailing northeasterly wind in the site and stable weather conditions.
Olive field in Tabernas (Spain) with an anti-erosion windbreak. Anemometers around the windbreak (A); Situation of the three windbreaks used during the experimental tests (B).
Weather conditions at 3.25 m of height (average values ± standard deviation) u0, wind velocity (m s−1) and θ, wind direction (°). T, air temperature (°C); HR, relative air humidity (%); R, shortwave radiation (W m−2).
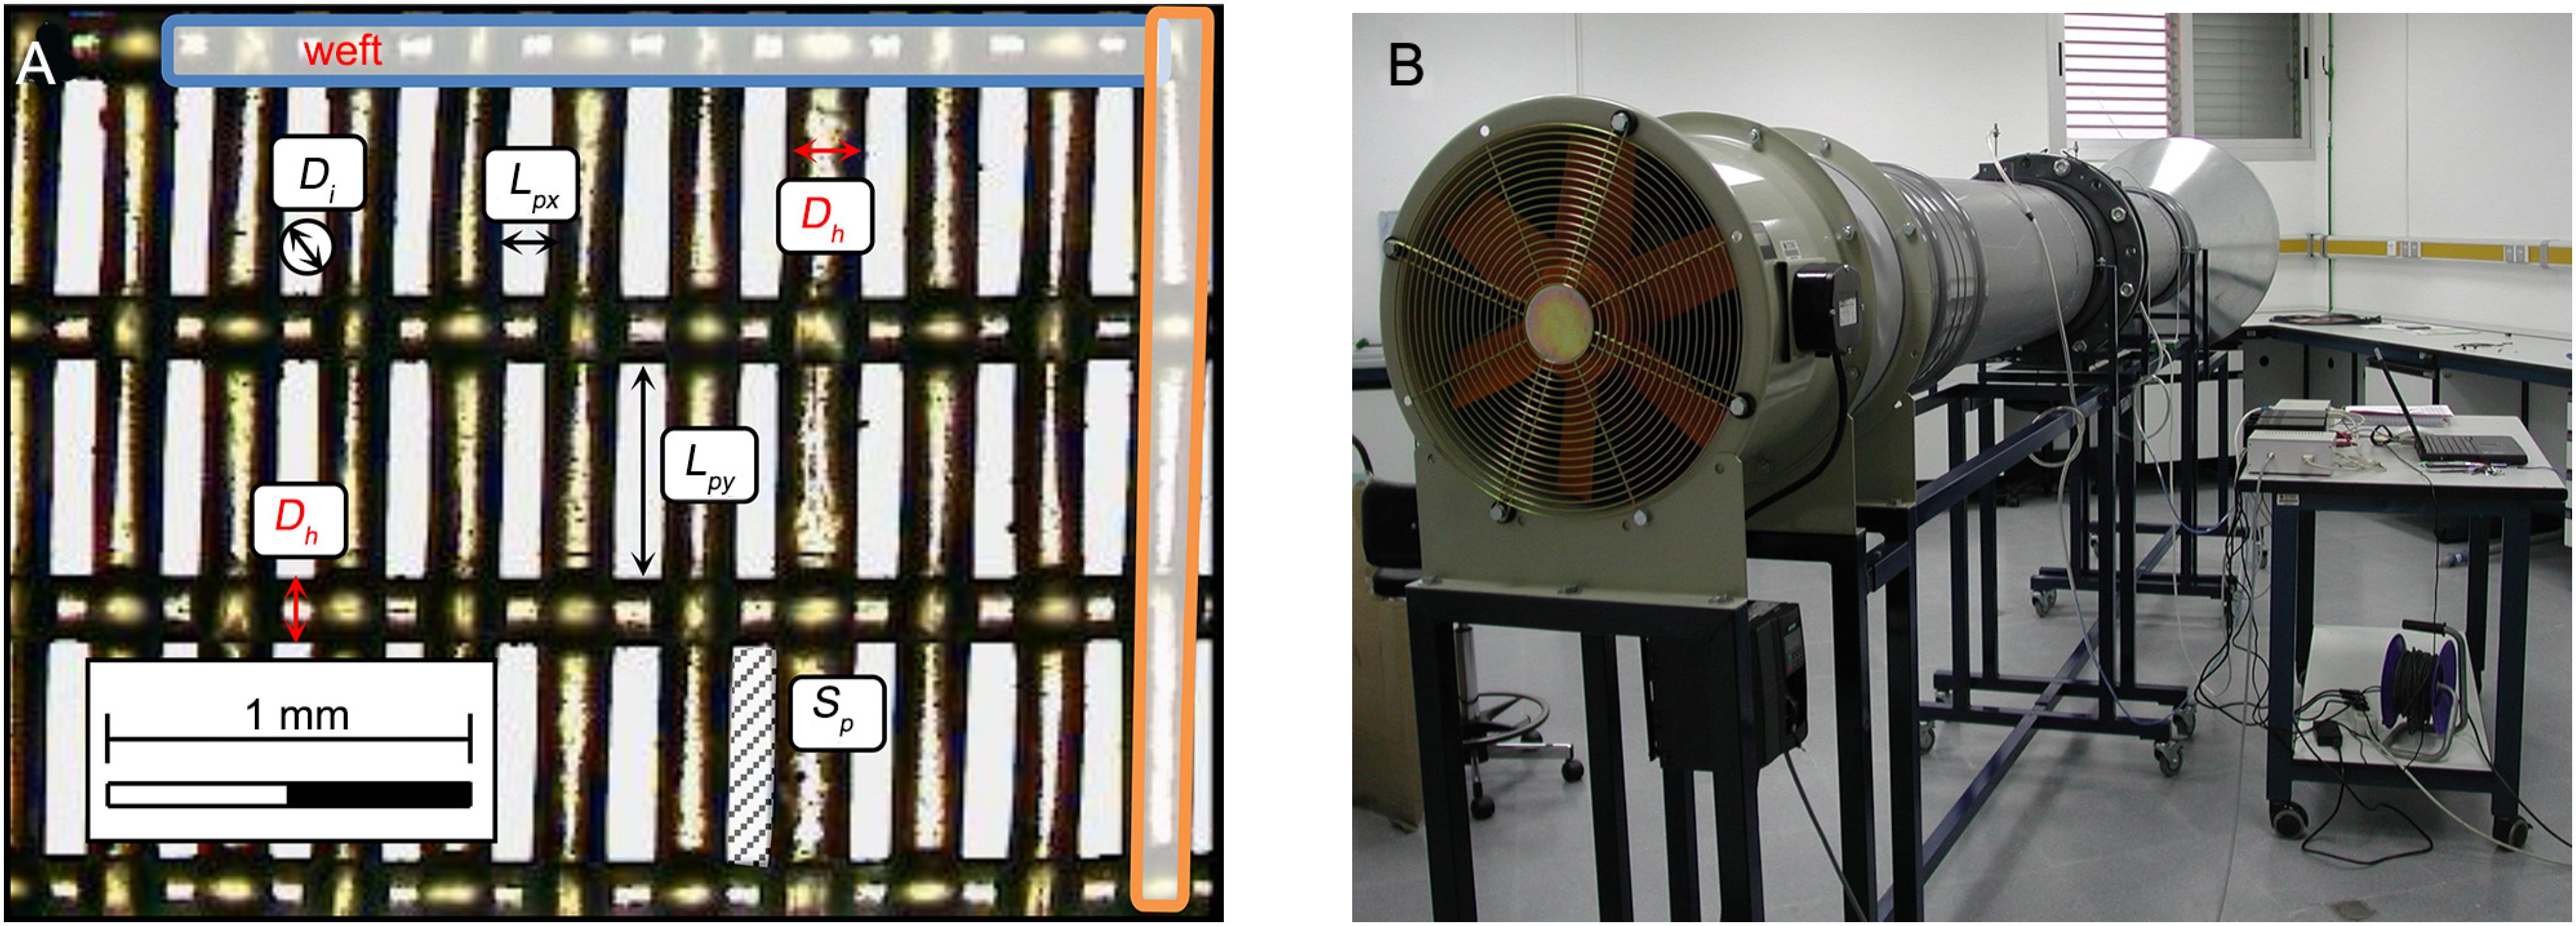
For the geometric characterization of the mesh (Figure 2A), specific software (Valera et al., 2006Valera, D.L.; Molina-Aiz, F.D.; Álvarez, A.J. 2006. Aerodynamic analysis of several insect-proof screens used in greenhouses. Spanish Journal of Agricultural Research 4: 273-279.; Álvarez et al., 2012Alvarez, A.J.; Oliva, R.; Valera, D.L. 2012. Software for the geometric characterisation of insect-proof screens. Computers and Electronics in Agriculture 82: 134-144.) was used. Further details on the methodology can be found in Álvarez et al. (2012)Alvarez, A.J.; Oliva, R.; Valera, D.L. 2012. Software for the geometric characterisation of insect-proof screens. Computers and Electronics in Agriculture 82: 134-144.. The average diameter of the threads Dh, in the wind mesh was 165.5 ± 7.0 μm, and windbreak porosity φ was 0.390 ± 0.006 (Table 2). This porosity value is slightly higher than 0.2-0.3 recommended by Raine and Stevenson (1977)Raine, J.K.; Stevenson, D.C. 1977. Wind protection by model fences in simulated atmospheric boundary layer. Journal of Wind Engineering and Industrial Aerodynamics 2: 159-180. and 0.20-0.35 proposed by Cornelis and Gabriels (2005)Cornelis, W.M.; Gabriels, D. 2005. Optimal windbreak design for wind-erosion control. Journal of Arid Environments 61: 315-332.. Windbreak aerodynamic characteristics were also determined by performing tests in a wind tunnel (Figure 2B) (Molina-Aiz et al., 2006Molina-Aiz, F.D.; Valera, D.L.; Alvarez, A.J.; Madueño, A. 2006. A wind tunnel study of airflow through horticultural crops: determination of the drag coefficient. Biosystems Engineering 93: 447-457.; Valera et al., 2006Valera, D.L.; Molina-Aiz, F.D.; Álvarez, A.J. 2006. Aerodynamic analysis of several insect-proof screens used in greenhouses. Spanish Journal of Agricultural Research 4: 273-279.; López et al., 2014López, A.; Valera, D.L.; Molina-Aiz, F.D.; Peña, A.; Marín, P. 2014. Microclimate evaluation of a new design of insect-proof screen in a Mediterranean greenhouse. Spanish Journal of Agricultural Research 4: 273-279.) equipped with an auto-tuning PI automatic control system based on an open hardware and software platform (Espinoza et al., 2015Espinoza, K.; Valera, D.L.; Torres, J.A.; López, A.; Molina-Aiz, F.D. 2015. An auto-tuning PI control system for an open-circuit low-speed wind tunnel designed for greenhouse technology. Sensors 15: 19723-19749.). The following parameters were obtained: Kp, mesh permeability (m2); Y, inertial factor; and Fφ, pressure drop coefficient (Table 2). Further details on the methodology used for the tests in the wind tunnel can be found in Espinoza et al. (2015)Espinoza, K.; Valera, D.L.; Torres, J.A.; López, A.; Molina-Aiz, F.D. 2015. An auto-tuning PI control system for an open-circuit low-speed wind tunnel designed for greenhouse technology. Sensors 15: 19723-19749. and López et al. (2016)López, A.; Molina-Aiz, F.D.; Valera, D.L.; Peña, A. 2016. Wind tunnel analysis of the airflow through insect-proof screens and comparison of their effect when installed in a Mediterranean greenhouse. Sensors 16: 690.. Wind meshes of 13 × 30 threads cm−2, 7.5 m long and 0.7 m tall (Figure 1B) were used in order to prevent wind erosion. They were arranged in alternating bands, at a distance of 10 m between windbreaks (Figures 3 and 4B), and placed in the perpendicular direction to the main natural wind. Three windbreaks were used to perform the analysis of the airflow patterns and the erosion test of sediment traps (Figure 4B). Sediment traps were placed in all three windbreaks, although the study of the airflow patterns was focused on the middle one (Figure 3).
Digital microscope image of the mesh used as a windbreak and geometric parameters determined using the specific software (A) and wind tunnel used for the aerodynamic characterization of the mesh (B).
Geometric characteristics (average values ± standard deviation) and aerodynamic properties of the mesh. Df and Dr are the thread densities according to the manufacturer and measurement, respectively (threads cm−2). φ = porosity (m2 m−2); Lpx and Lpy, the lengths of the pore (μm) in the direction of the weft and warp, respectively; Dh = diameter of the threads (μm); Di = diameter of the inside circumference of the pore (μm); Sp = area of the pore (mm2); e = thickness (μm); a, b and c are the coefficients of the polynomial fit from the wind tunnel tests; R2 = the fit determination coefficient; Kp = mesh permeability (m2); Y = inertial factor; Fφ = pressure drop coefficient due to the presence of a windbreak.
Sediment traps placed at different heights (40, 70 and 100 cm) (A), location of sediment traps around the three windbreaks in the typical olive field (B).
Experimental setting and instrumentation
Climatic conditions were recorded by means of a portable meteorological station at 3.75 m of height (Figure 3) provided by a DAVIS 7911 cup anemometer (measurement range 0 to 78 m s−1, accuracy ±5 % and resolution 0.09 m s−1). The wind direction at the meteorological station was measured with a vane (accuracy ±7° and resolution 1.4°). Solar radiation was measured with a LI-200SA pyranometer sensor. This photovoltaic-based sensor covers a limited spectral range (400-1100 nm) and has accuracy of ±5 %. These three sensors were connected to an autonomous data logger.
The three components of air velocity around one of the windbreaks (the middle one, Figures 3 and 4B) were measured with two 3D sonic anemometers (accuracy ±0.04 m s−1 and resolution 0.001 m s−1). These were placed perpendicularly to the windbreak center, one on either side of the mesh at a distance of 1 m. Measurements were also taken at 2 and 3 m from the center of the mesh, always with the anemometer placed perpendicularly to the mesh. Additional measurements were taken 1.25 m from each end of the windbreak at a distance of 1 m. To complete the study, data were recorded at three heights: 0.40 m, 0.70 m and 1 m at each of the above-mentioned measurement points. 3D anemometers were moved and placed in each position and measurements were performed by the sonic anemometer for each point at a sampling rate of 10 Hz for 3 min. Other authors have also used anemometers to measure winds around a thick hedge (Tuzet and Wilson, 2007Tuzet, A.; Wilson, J.D. 2007. Measured winds about a thick hedge. Agricultural and Forest Meteorology 145: 195-205.).
Ten 2D sonic anemometers (accuracy 2 % and resolution 0.01 m s−1) were also used for data collection. These anemometers were placed around the same windbreak at a height of 0.40 m at the measurement points shown in Figure 3.
Data from all sonic anemometers were recorded by two CR3000 Microloggers, with a data registration frequency of 10 Hz (Shilo et al., 2004Shilo, E.; Teitel, M.; Mahrer, Y.; Boulard, T. 2004. Air-flow patterns and heat fluxes in roof-ventilated multi-span greenhouse with insect-proof screens. Agricultural and Forest Meteorology 122: 3-20.; Valera et al., 2006Valera, D.L.; Molina-Aiz, F.D.; Álvarez, A.J. 2006. Aerodynamic analysis of several insect-proof screens used in greenhouses. Spanish Journal of Agricultural Research 4: 273-279.; López et al., 2011López, A.; Valera, D.L.; Molina-Aiz, F.D. 2011. Sonic anemometry to measure natural ventilation in greenhouses. Sensors 11: 9820-9838., 2014López, A.; Valera, D.L.; Molina-Aiz, F.D.; Peña, A.; Marín, P. 2014. Microclimate evaluation of a new design of insect-proof screen in a Mediterranean greenhouse. Spanish Journal of Agricultural Research 4: 273-279.) and 1 Hz (López et al., 2011López, A.; Valera, D.L.; Molina-Aiz, F.D. 2011. Sonic anemometry to measure natural ventilation in greenhouses. Sensors 11: 9820-9838., 2014López, A.; Valera, D.L.; Molina-Aiz, F.D.; Peña, A.; Marín, P. 2014. Microclimate evaluation of a new design of insect-proof screen in a Mediterranean greenhouse. Spanish Journal of Agricultural Research 4: 273-279.) for the 3D and 2D sonic anemometers, respectively.
Airflow analysis
Ultrasonic anemometers are able to determine the air velocity vector and are widely used to evaluate turbulence parameters such as mean air velocity and its orthogonal components, turbulence intensity and integral length scale (López et al., 2011López, A.; Valera, D.L.; Molina-Aiz, F.D. 2011. Sonic anemometry to measure natural ventilation in greenhouses. Sensors 11: 9820-9838.). In this work, the following parameters were calculated and studied: Mean and Turbulent Air Velocity (Cebeci, 2004Cebeci, T. 2004. Analysis Of Turbulent Flows. Elsevier Science, San Diego, CA, USA.), Turbulence Intensity and Macroscale (Hinze, 1975Hinze, J.O. 1975. Turbulence. McGraw-Hill, New York, NY, USA.; Melikov et al., 1990Melikov, A.K.; Langkilde, G.; Derbiszewski, B. 1990. Airflow characteristic in the occupied zone of rooms with displacement ventilation. ASHRAE Transactions 96: 555-563.; Heber et al., 1996Heber, A.J.; Boon, C.R.; Peugh, M.W. 1996. Air patterns and turbulence in an experimental livestock building. Journal of Agricultural Engineering Research 64: 209-226.; Boulard et al., 2000Boulard, T.; Wang, S.; Haxaire, R. 2000. Mean and turbulent air flows and microclimatic patterns in an empty greenhouse tunnel. Agricultural and Forest Meteorology 100: 169-181.) and Discrete Energy Spectrum (Stull, 1988Stull, R.B. 1988. An Introduction to Boundary Layer Meteorology. Kluwer Academics, Dordrecht, The Netherlands.; Heber et al., 1996Heber, A.J.; Boon, C.R.; Peugh, M.W. 1996. Air patterns and turbulence in an experimental livestock building. Journal of Agricultural Engineering Research 64: 209-226.; Ouyang et al., 2006Ouyang, Q.; Dai, W.; Li, H.; Zhu, Y. 2006. Study on dynamic characteristics of natural and mechanical wind in built environment using spectral analysis. Build and Environment 41: 418-426.).
Erosion test with sediment traps and windbreak
To measure the ability of the windbreak to reduce wind erosion, three groups of six sediment traps were installed from 10h00 on 20/09/2013 to 20h00 on 26/09/2013 (Figures 4A and B). The mean weather conditions for the duration of the sediment collection tests were: air temperature 20.7 °C (maximum 28.1 and minimum 14.7 °C), relative humidity 72 % (maximum 98 and minimum 37 %), wind speed 1.3 m s−1 and direction 83° from north, where 65° was the orientation perpendicular to the windbreaks. No rain was registered during the tests.
The sediment traps were placed at a height of 40 cm, 70 cm and 1 m above de soil surface (Figure 4A), and at a distance of 2, 4 and 6 m from the windbreak, perpendicular to it, both upwind and downwind. Traps allowed collecting fractions of airborne sand, silt and clay (Figure 4B). The particle traps (Fryrear BSNE, adapted for a fixed wind direction), located at the same height as the adhesive plates (Asensio et al., 2015Asensio, C.; Lozano, FJ.; Ortega, E.; Kikvidze, Z. 2015. Study on the effectiveness of an agricultural technique based on Aeolian deposition in semiarid environment. Environmental Engineering Management Journal 14: 1143-1150.), were used to retain the dust, which was subsequently analyzed in order to quantify the loss.
Dry sieving and the Robinson pipette method were used to evaluate particle size distribution after eliminating organic matter with H2O2 (30 %) and dispersion by agitation with sodium hexametaphosphate (10 %) (Gee and Bauder, 1986Gee, G.W.; Bauder, J.W. 1986. Particle-size analysis. p. 383-411. In: Klute, A., ed. Methods of soil analysis. Part I. Physical and mineralogical methods. American Society of Agronomy, Madison, WI, USA. (Agronomy Monographs).). The sand fraction was separated by wet sieving, oven-dried, and later fractionated by dry sieving. The following classification (United States Department of Agriculture - USDA) was used: very coarse sand SVC (2000-1000 μm); coarse sand SC (1000-500 μm); medium sand SM (500-250 μm); fine sand SF (250-100 μm); very fine sand SVF (100-50 μm); coarse silt StC (50-20 μm); fine silt StF (20-2 μm); clay CL (< 2 μm).
Results and Discussion
The proposed methodology allowed to perform an in-depth study on the airflow characteristics around the windbreak to determine the airflow pattern, the drop in each component of the velocity vector produced by the windbreak, the variation in the turbulence intensity and the energy density spectra. Moreover, the influence of the acrylic windbreaks on sediment transport was analyzed in order to determine the effectiveness of windbreaks to reduce the effects of wind erosion. This type of mesh is easy to remove once the dew is formed a surface crust, a phenomenon that helps prevent erosion and the loss of fertile soil.
Airflow characteristics
The windbreaks were placed in the aisles between the rows of olive trees, almost perpendicular to the northeasterly winds that prevailed during the test (Figures 1A and B). Figures 5A, B, C and Figure 6 show the reduction in air velocity downwind caused by the windbreak. The minimum values of air velocity were reached downwind at the measuring points closer to the windbreak. This is in agreement with the results of other authors who reported a reduction of the air velocity caused by the windbreak up to a distance of between 5 and 8 times the height of the windbreak (Brandle et al., 2006Brandle, J.R.; Zhou, X.; Hodges, L. 2006. How Windbreaks Work. University of Nebraska, Lincoln, NE, USA. (Extension EC1763).; College of Agricultural Sciences, 2015College of Agricultural Sciences. 2015. Windbreaks. Penn State Extension. Available at: http://extension.psu.edu/plants/plasticulture/production-details/windbreaks (Accessed Dec 10, 2015)
http://extension.psu.edu/plants/plasticu...
). In our case, the height of the windbreak was 0.7 m and a significant reduction of the windbreak effect at a distance of 3 m (4.3 times the height of the windbreak) in comparison to the reduction observed at 1 m.
Polar histograms of the air velocity around windbreak in the XY plane at heights of 0.4 m (A), 0.7 m (B) and 1 m (C).
Measurement points 1, 2 and 3 of the 2D anemometers were placed in locations with the greatest windbreak effect (Figure 3 and Table 3). They recorded an average reduction of 90 % in the component of air velocity perpendicular to the mesh, ux’ whereas the average reduction of all measurement points was 59 %. For these measurement points, the average reduction in the u component of the air velocity was 57 %. At points 4a and 4b, located at the greatest distance from the windbreak, the ux component was reduced by only 12 %, while the uy component was greater on the leeward side of the mesh. This effect is related to the fact that air velocity increases on passing the windbreak edge (Dong et al., 2007Dong, Z.; Luo, W.; Qian, G.; Wang, H. 2007. A wind tunnel simulation of the mean velocity fields behind upright porous fences. Agricultural and Forest Meteorology 146: 82-93.; Guan et al., 2009Guan, D.; Zhong, Y.; Jin, C.; Wang, A.; Wu, J.; Shi, T.; Zhu, T. 2009. Variation in wind speed and surface shear stress from open floor to porous parallel windbreaks: a wind tunnel study. Journal of Geophysical Research 114: 1-13.). This is appreciable in the values of ux at points 5a and 5b, 1 m from the windbreak edge, where the maximum values recorded during the test were attained (Table 3).
Air velocity (average values ± standard deviation) in front (points “a”) and behind (points “b”) the windbreak, measured with 2D anemometers (0.4 m height, 1 m from the windbreak).
The measurements obtained with the 3D anemometer at 1 m from the mesh and at a height of 0.4 m reflect an average reduction in ux of 84 %. At 2 m from the mesh, a further reduction of this drop (80 %) was recorded, while it decreased to 47 % at 3 m. No general pattern was observed for the drop in the uy and uz components (Table 4).
Air velocity (average values ± standard deviation) in front (points “a”) and behind (points “b”) the windbreak, measured with 3D anemometers. D = distance to the windbreak.
Similarly, reduction in air velocity was observed at the points closer to the upper edge of the windbreak and at greater distances from it. For illustration, at the 3D anemometer measurement points located at 1 m from the mesh and at a height of 0.7 m the average reduction in ux was 64 %, with negligible reduction on the windward side, while the average reduction was 45 % and 58 % at 2 m and 3 m, respectively. The greatest reduction in ux was observed at 3 m and it could be possibly due to the presence, both upwind and downwind, of other elements that were interfering with the measurements, such as the olive tree orchard itself. Indeed, the effect of the mesh on wind speed was found to be lower when measured at a greater height. As regards to uy, a considerable reduction in air velocity was registered at points I and II (1 m from the mesh), but lower values were registered at all other points (Table 4). As for uz, the reduction in air velocity was considerable at all measurement points.
The measurements taken at a height of 1 m, i.e. above the windbreak, appear to indicate that there is no significant effect on face velocity at that height (Table 4). There is, however, a certain change of the air velocity components, particularly in the YZ plane, due to the creation of eddies as the air passes through and over the windbreak.
Turbulence flow characteristics
The turbulence intensity i increased behind the windbreak due to the reduction of the average values of air velocity on the leeward side because of the air passing through the mesh (Table 5), whereas the fluctuation levels, measured as the standard deviation of air velocity, remained stable. Nevertheless, the level of turbulent kinetic energy and the scales of turbulence are the most important aspects for analysis, as they are responsible for the capacity of the air to transport substances and are therefore highly linked to wind erosion.
Intensity of turbulence i in front (points “a”) and behind (points “b”) the windbreak, measured with 3D anemometers. D = distance to the windbreak.
Energy levels and measures of turbulence scales
The mean values of turbulence kinetic energy k (Table 6) decreased by 65 % to 86 % at a distance of 1 m from the windbreak and a height of 0.4 m. A decrease of 50 % and 15 % was registered at a distance of 2 m and 3 m from the windbreak, respectively, indicating thus that the mesh windbreaks contribute positively to preventing wind erosion.
Turbulence kinetic energy k and the turbulence energy dissipation rate ε in front (points “a”) and behind (points “b”) the anti-erosion mesh, measured with 3D anemometers. D = distance to the windbreak.
At a height of 0.7 m, the effect of the windbreak to reduce the energy of the airflow is much less pronounced. Indeed, the energy actually increases by passing through the mesh at point Vb at the end of the windbreak most exposed to the wind (Table 6), which is likely due to the eddies formed at this location. Above the windbreak, at a height of 1.0 m, there is a general ized increase in the airflow energy, which is probably due to the increase in velocity as the air overcomes the barrier (Table 6).
The macroscale represents the dimension of the most energetic eddies that have a significant effect on the air mixture and therefore on ventilation (Tanny et al., 2008Tanny, J.; Haslavsky, V.; Teitel, M. 2008. Airflow and heat flux through the vertical opening of buoyancy-induced naturally ventilated enclosures. Energy and Buildings 40: 637-646.). There was an overall reduction in the value of the macroscale (larger eddies, with more energy and greater capacity to transport particles) at heights of 0.4 and 0.7 m. This behavior is of great interest to reduce wind erosion. The most significant reduction is in component x, which is perpendicular to the windbreak (Table 7).
Macroscale Li (m) in front of (points “a”) and behind (points “b”) the anti-erosion mesh, measured with 3D anemometers. D = distance to the anti-erosion mesh.
Discrete energy spectrum
Breaking down the time series into components of frequency allowed to observe how eddies of different scales contribute to overall turbulence (Figure 7). The energy density spectra shown in the figures of this section were obtained by calculating the average spectrum obtained by the 3D sonic anemometers placed at 1 m from either side of the windbreak at each of the 5 measurement points. The power spectrum exponent β equal to −5/3 is typical of natural airflows, corresponding to an isotropic distribution of turbulence. Therefore, it was easier to appreciate the differences between the spectra at each point. The energy density spectra showed that energy is reduced significantly, at low frequency, at a height of 0.4 m (Figure 7A), to a lesser extent at 0.7 m (Figure 7B), and not at all at 1 m (Figure 7C), i.e. above the windbreak. Most energy of natural airflow is contained in larger eddies at low frequency, corresponding with the Energy-Containing Range. The windbreak (at a height of 0.4 m) reduced the energy at low frequency, i.e. larger eddies, but not at high frequency, i.e. smaller eddies.
Energy density spectra for the air velocity u, at heights 0.4 m (A), 0.7 m (B) and 1 m (C); and for ux (D), uy (E) and uz (F), at 0.4 m height. Positions Ila in front of windbreak (Figure 2).
 ) (see positions in
  ) and IIb behind the windbreak (
This reduction occurs almost exclusively in the ux (Figure 7D) component due to the laminating effect that the windbreak exerts on the airflow passing through it. The reduction does not occur for uy (Figure 7E) and uz (Figure 7F). This aspect implies a reduction in wind erosion.
The spectrum level allowed to determine under which conditions the airflow at the windbreak is most turbulent and energetic. The airflow was more turbulent and energetic upwind than downwind in relation to the windbreak. The spectrum was higher at greater wind speeds (López et al., 2011López, A.; Valera, D.L.; Molina-Aiz, F.D. 2011. Sonic anemometry to measure natural ventilation in greenhouses. Sensors 11: 9820-9838.). The most energetic eddies had the most significant effect on the air mixture and therefore on wind erosion.
Reduction of sediment transport
Feras et al. (2008)Feras, Y.; Erpul, G.; Bogman, P.; Cornelis, W.M.; Gabriels, D. 2008. Determination of efficiency of Vasaline slide and Wilson and Cook sediment traps by wind tunnel experiments. Environmental Geology 55: 741-757. showed in a wind tunnel study that sediment trap efficiency depended mainly on particle size and wind speed. Traps placed at different heights measured the vertical sediment flow (Basarana et al., 2011Basarana, M.; Erpul, G.; Uzun, O.; Gabriels, D. 2011. Comparative efficiency testing for a newly designed cyclone type sediment trap for wind erosion measurements. Geomorphology 130: 343-351.). Goossens and Offer (2000)Goossens, D.; Offer, Z. 2000. Wind tunnel and field calibaration of six aeolian dust samplers. Atmospheric Environment 34: 1043-1057. suggested that as an obstacle in the flow, a sediment trap always affects the particle flow and trajectory.
The sediment traps allowed to analyze the effect of the windbreaks on the wind sediment transport. During the test, wind erosion occurred principally only in fractions of very fine sand SVF, coarse StC and fine StF silt, and clay CL (Table 8). Without taking the effect of the windbreak into consideration, the following can be stated for the traps located upwind from the windbreak (Traps A in Table 8): (i) clay CL and fine silt StF, with the smallest particle sizes, were collected in larger amounts by the traps placed at 1 m than by the traps that were placed at a height of 0.4 m and 0.7 m, respectively. This indicates that the windbreak performance for these fractions could be improved by increasing the barrier height over 0.7 m, as used in this study. (ii) On the contrary, the very fine fractions of sand SVF, and coarse silt StC, which have larger particle sizes than the previously mentioned particles, were collected in larger amounts by the traps placed at 0.4 m, with lesser amounts collected as the trap height increased, indicating thus that the height chosen for this barrier (0.7 m) could be appropriate for these soil fractions.
Amount of collected sediment (g) for every 100 g collected in the trap (6 A 100) (mean values for the three windbreaks). Trap, Code that indicates the position of the trap (X A/B Y); X, distance to the windbreak (m); A, traps placed upwind (windward) from the windbreak; B, traps placed downwind (leeside) from the windbreak; Y, height of the trap (cm). Granulometric classification: SVC = very coarse sand; SC = coarse sand; SM = sand; SF = fine sand; SVF = very fine sand; StC = coarse silt; StF = fine silt; CL = clay. W = total weight of the sample collected in each trap (g) for every 100 g collected in the trap (6 A 100).
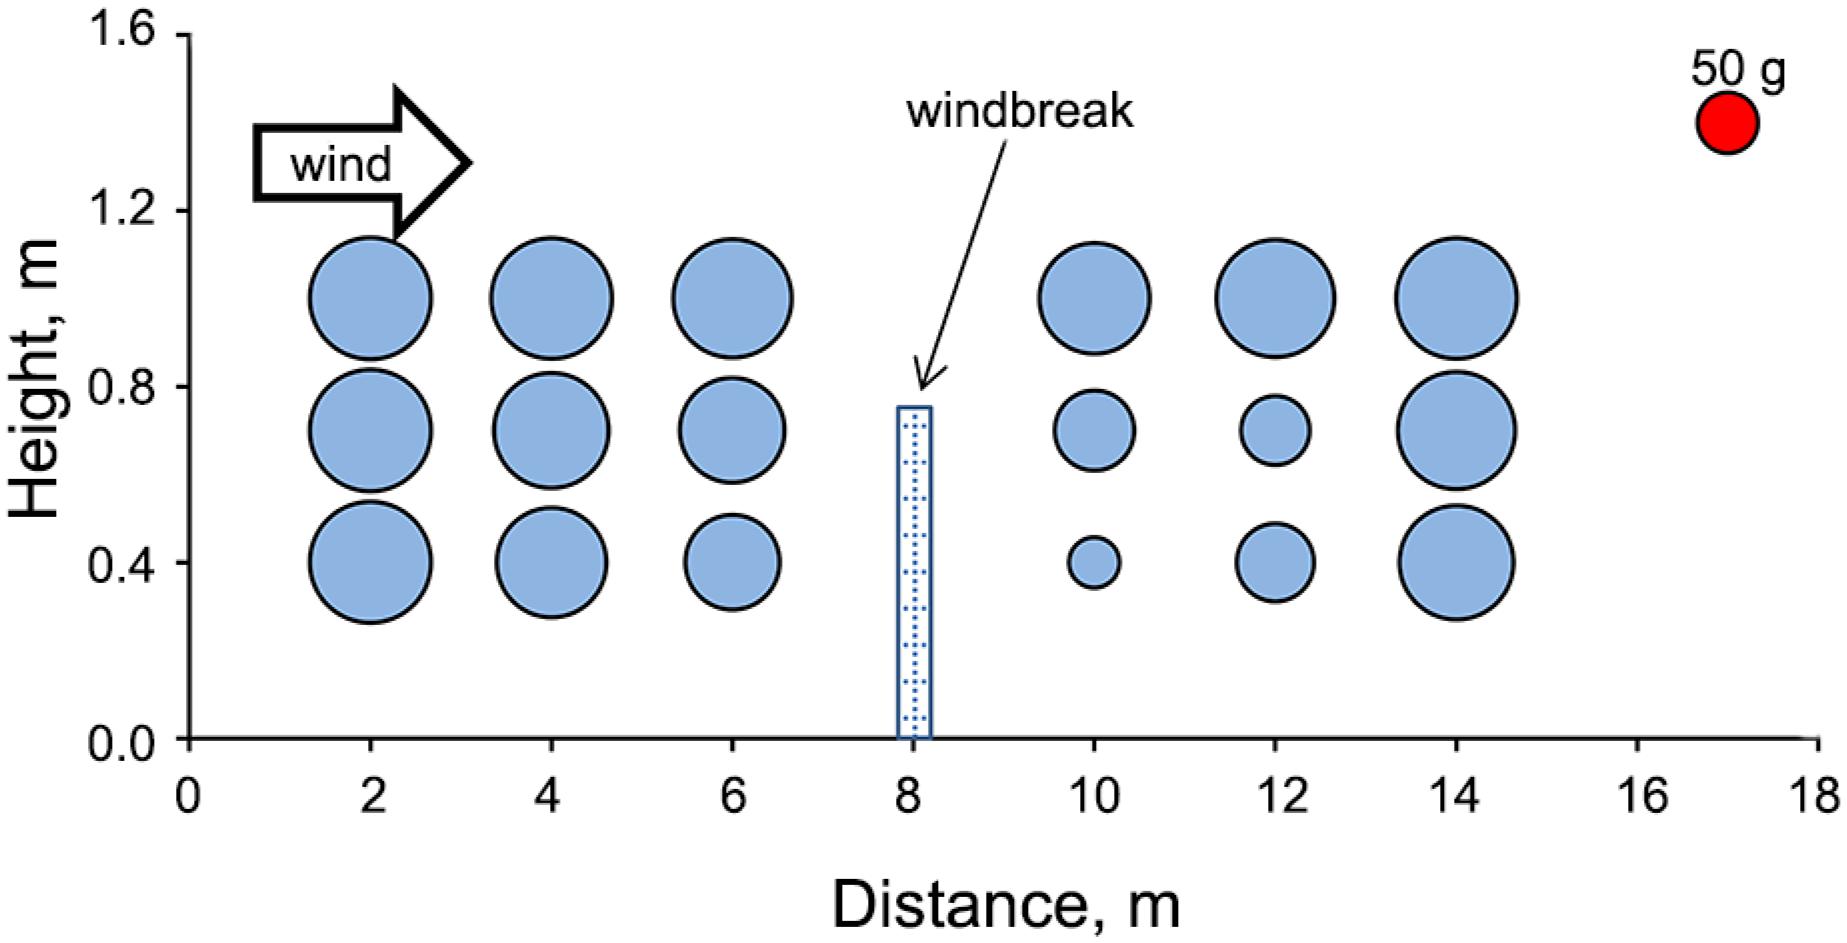
The total sediment grams (including all fractions) collected by each trap (average values for the three windbreaks) can be observed in Figure 8, indicating the grams in each trap for every 100 g collected in the trap furthest away from the upwind windbreak (Trap 6 A 100 in Table 8). The positive effect of the windbreak can be seen clearly in the decrease of total grams collected by the traps placed immediately after the windbreak. A comparison of the sediment grams collected by the three traps located upwind from the windbreak and the three traps located downwind from the windbreak shows that the sediment collected behind the windbreak decreased by 17 %. If we compare the sediment grams collected by the trap located at 6 m upwind (the furthest away from the windbreak) and the one located 2 m downwind, the closest to the windbreak (2.9 times the height of wind-break H), a reduction of 34 % is observed in the amount of sediment collected. As a disadvantage, however, it should be noted that it appears that the windbreak has no effect on the sediment transported by air and collected by traps at a height of 1 m.
Grams of all the fractions trapped in each sediment trap for every 100 g collected by the trap furthest away upwind (6 A 100).
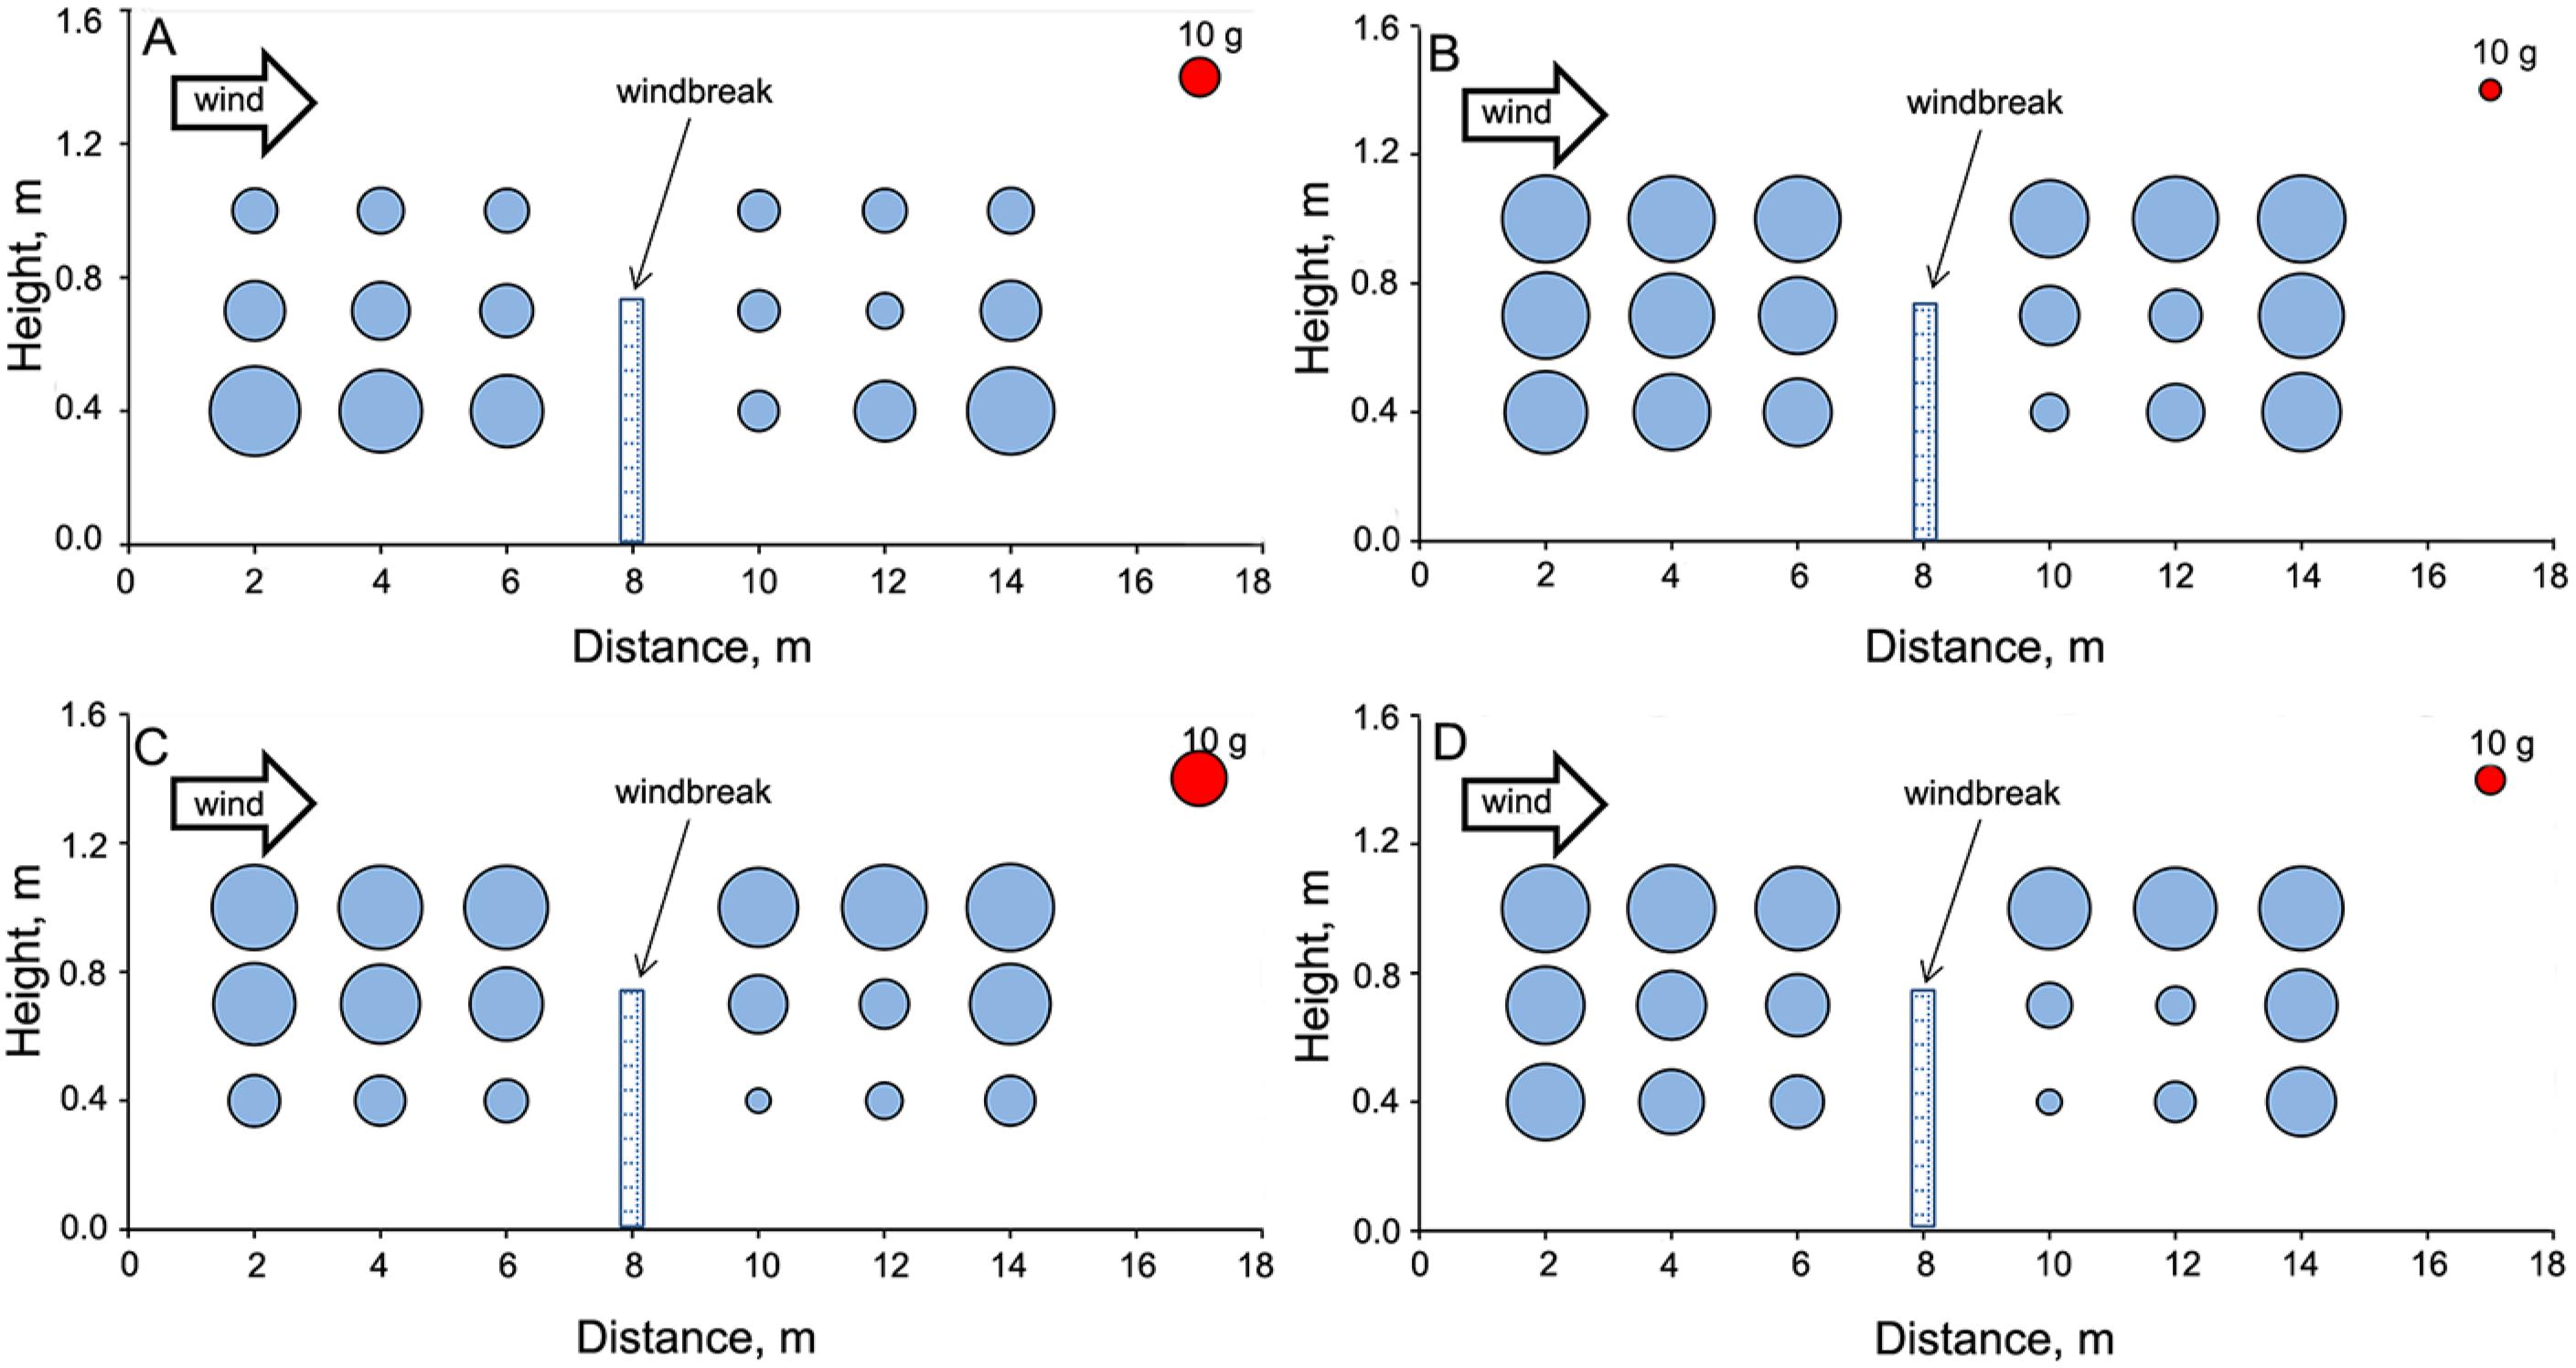
In general terms, the windbreak does not have any effect on the various sediment fractions eroded by the wind and collected by the traps at a height of 1 m, indicating the need to increase the height of the trap used in this study. The next figures show the grams of very fine sand SVF (Figure 9A), coarse silt StC (Figure 9B), fine silt StF (Figure 9C) and clay CL (Figure 9D) collected in each trap for every 100 g of overall sediment (including all fractions) collected in the trap furthest away from the windbreak upwind (6 A 100). In all cases, the greatest decrease in sediment collected by the traps occurred in the trap placed at a height of 0.4 m and at a distance of 2 m downwind from the windbreak (2.9H). A comparison of the sediment grams collected by the three traps located upwind and the three traps located downwind shows that the sediment trapped behind the windbreak decreased by 17 % for very fine sand SVF, 16 % for coarse silt StC, 13 % for fine silt SF and 19 % for clay CL. If we compare the sediment grams collected by the trap placed 6 m upwind (the furthest from the breaker) with that placed 2 m downwind (2.9H), a decrease can be seen in the amount of sediment collected; 37 % for very fine sand SVF, 32 % for coarse silt StC, 26 % for fine silt SF y 38 % for clay CL. These values can be considered the maximum reduction capacity of the windbreak on the transport of sediments eroded by wind under the field distribution conditions of the study. However, it should be noted that this decrease in sediment transport is highly concentrated in a site very close to the windbreak. As shown in Figures 8 and 9A, B, C and D, the windbreak has no effect on any of the fractions under study or on the overall sediment transport at a distance of 6 m down-wind (8.6 times the height) from the windbreak. The effect of the windbreak on soil erosion will depend on its porosity, shape, height, direction, width and the distance between windbreaks (Cornelis and Gabriels, 2005Cornelis, W.M.; Gabriels, D. 2005. Optimal windbreak design for wind-erosion control. Journal of Arid Environments 61: 315-332.).
Grams of very fine sand SVF (A), coarse silt StC (B), fine silt StF (C) and clay CL (D) trapped in each sediment trap for every 100 g of sediment (including all fractions) collected by the trap furthest away upwind (6 A 100).
Conclusions
The present study proved that the use of sonic anemometry techniques allows to identify the patterns of air movement around the windbreaks. Moreover, these techniques also allowed the analyses of parameters that are directly related to wind erosion, in particular, each component of the wind velocity vector, the characteristics of turbulent flow, energy levels and the formation of eddies, as well as their variation in relation to height and distance from the windbreak.
Windbreaks composed of a plastic mesh constitute a useful tool to reduce wind erosion, as they showed a positive influence on the characteristics of airflow related to processes of soil erosion by wind. Using a mesh of 13 × 30 threads cm−2 with 39 % porosity, a mean reduction in face velocity of 85 % was achieved at a height of 0.4 m and a distance of 1 m from the windbreak.
The turbulence intensity i increased behind the windbreak due to the decrease of the mean value of the air velocity on the leeward side as the air passes through the mesh and the simultaneous maintenance of the fluctuation levels. Nevertheless, the mean values of turbulence kinetic energy k reduced by 65 % and 86 % at a distance of 1 m from the windbreak and a height of 0.4 m. Furthermore, the size of the most energetic eddies is reduced behind the windbreak. These values become less significant at greater distances from the windbreak or at closer distances to its upper edge.
The anti-erosion windbreak designed in this study clearly reduces erosion and sediment transport over the first 2 m downwind from the windbreak (2.9H) and at a height of 0.4 m. However, this wind-break design of a height of 0.7 m does not appear to have a clear effect on sediment transport at a height above 1 m and its effect is negligible at a distance of 6 m downwind (8.6H). As a result, it is imperative to study other windbreak designs of greater height and analyze different distributions of windbreaks over the terrain to be protected.
Acknowledgements
This work was supported by the Spanish Ministry of Economy and Competitiveness and the European Regional Development Fund (ERDF) by means of the research grant AGL2015-68050-R. The authors would like to express their gratitude to the Research Center on Mediterranean Intensive Agrosystems and Agrifood Biotechnology (CIAIMBITAL) and the "Properties and functions of soils in semiarid environment" research group (RMN378) of the University of Almería (Spain) for their support during the experimental phase of this work, as well as to Carlos Herrero-Sanchez for his thorough revision of the manuscript.
- CL clay;
- Df thread density according to the manufacturer (threads cm−2);
- Dh diameter of the threads (μm);
- Di diameter of the inside circumference of the pore (μm);
- Dr thread density measurement (threads cm−2);
- e thickness (μm);
- F φ pressure drop coefficient due to the presence of a windbreak;
- HR relative humidity (%);
- i turbulence intensity;
- k turbulence kinetic energy (m2 s−2);
- Kp mesh permeability (m2);
- Li integral length scale (m);
- Lpx length of the pore in the weft direction (μm);
- Lpy length of the pore in the warp direction (μm);
- R solar radiation (W m−2);
- Sp area of the pore (mm2);
- SC coarse sand;
- SF fine sand;
- SM medium sand;
- SVC very coarse sand;
- SVF very fine sand;
- StC coarse silt;
- StF fine silt;
- T temperature (°C);
- u air velocity (m s−1);
- uo wind speed (m s−1);
- W total weight of sediments collected by the trap (g);
- Y inertial factor;
- β power spectrum exponent;
- ε turbulence energy dissipation rate (m2 s–3);
- θ wind direction (°);
- φ porosity (m−2 m−2);
- x longitudinal component;
- y transversal component;
- z vertical component.
References
- Alvarez, A.J.; Valera, D.L.; Molina-Aiz, F.D. 2006. A method for the analysis of geometric characteristics of protection screens. Acta Horticulturae 719: 557-564.
- Alvarez, A.J.; Oliva, R.; Valera, D.L. 2012. Software for the geometric characterisation of insect-proof screens. Computers and Electronics in Agriculture 82: 134-144.
- Asensio, C.; Lozano, FJ.; Ortega, E.; Kikvidze, Z. 2015. Study on the effectiveness of an agricultural technique based on Aeolian deposition in semiarid environment. Environmental Engineering Management Journal 14: 1143-1150.
- Basarana, M.; Erpul, G.; Uzun, O.; Gabriels, D. 2011. Comparative efficiency testing for a newly designed cyclone type sediment trap for wind erosion measurements. Geomorphology 130: 343-351.
- Boulard, T.; Wang, S.; Haxaire, R. 2000. Mean and turbulent air flows and microclimatic patterns in an empty greenhouse tunnel. Agricultural and Forest Meteorology 100: 169-181.
- Brandle, J.R.; Zhou, X.; Hodges, L. 2006. How Windbreaks Work. University of Nebraska, Lincoln, NE, USA. (Extension EC1763).
- Cebeci, T. 2004. Analysis Of Turbulent Flows. Elsevier Science, San Diego, CA, USA.
- College of Agricultural Sciences. 2015. Windbreaks. Penn State Extension. Available at: http://extension.psu.edu/plants/plasticulture/production-details/windbreaks (Accessed Dec 10, 2015)
» http://extension.psu.edu/plants/plasticulture/production-details/windbreaks - Cornelis, W.M.; Gabriels, D. 2005. Optimal windbreak design for wind-erosion control. Journal of Arid Environments 61: 315-332.
- Dong, Z.; Luo, W.; Qian, G.; Wang, H. 2007. A wind tunnel simulation of the mean velocity fields behind upright porous fences. Agricultural and Forest Meteorology 146: 82-93.
- Espinoza, K.; Valera, D.L.; Torres, J.A.; López, A.; Molina-Aiz, F.D. 2015. An auto-tuning PI control system for an open-circuit low-speed wind tunnel designed for greenhouse technology. Sensors 15: 19723-19749.
- Feras, Y.; Erpul, G.; Bogman, P.; Cornelis, W.M.; Gabriels, D. 2008. Determination of efficiency of Vasaline slide and Wilson and Cook sediment traps by wind tunnel experiments. Environmental Geology 55: 741-757.
- Food and Agriculture Organization of the United Nations (FAO). 2015. World Reference Base for Soil Resource 2014. International soil classification system for naming soils and creating legends for soil maps. FAO, Rome, Italy. (World Soil Resources Reports, 106).
- Gee, G.W.; Bauder, J.W. 1986. Particle-size analysis. p. 383-411. In: Klute, A., ed. Methods of soil analysis. Part I. Physical and mineralogical methods. American Society of Agronomy, Madison, WI, USA. (Agronomy Monographs).
- Giannoulis, A.; Mistriotis, A.; Papardaki, N.; Briassoulis, D. 2013. Airflow around artificial windbreaks with elastic support. Acta Horticulturae 1008: 63-68.
- Goossens, D.; Offer, Z. 2000. Wind tunnel and field calibaration of six aeolian dust samplers. Atmospheric Environment 34: 1043-1057.
- Guan, D.; Zhang, Y.; Zhu, T. 2003. A wind-tunnel study of windbreak drag. Agricultural Forest Meteorology 118: 75-84.
- Guan, D.; Zhong, Y.; Jin, C.; Wang, A.; Wu, J.; Shi, T.; Zhu, T. 2009. Variation in wind speed and surface shear stress from open floor to porous parallel windbreaks: a wind tunnel study. Journal of Geophysical Research 114: 1-13.
- Heber, A.J.; Boon, C.R.; Peugh, M.W. 1996. Air patterns and turbulence in an experimental livestock building. Journal of Agricultural Engineering Research 64: 209-226.
- Hinze, J.O. 1975. Turbulence. McGraw-Hill, New York, NY, USA.
- Jacobs, A.F.G. 1985. The normal force coefficient on a thin closed fence. Boundary-Layer Meteorology 32: 329-335.
- Li, L.R.; Zhao, L.Y.; Zhang, T.H. 2004. Wind erosion and airborne dust deposition in farmland during spring in the Horqin Sandy Land of eastern inner Mongolia, China. Soil and Tillage Research 75: 121-130.
- Liu, L.Y.; Shi, P.J.; Zou, X.Y.; Gao, S.Y.; Yan, P.; Li, X.Y.; Dong, Z.B.; Wang, J.H. 2003. Short-term dynamic of wind erosion of three newly cultivated grassland soils in Northern China. Geoderma 115: 55-64.
- López, M.V.; Gracia, R.; Arrue, J.L. 2000. Effects of reduced tillage on soil surface properties affecting wind erosion in semiarid fallow lands of Central Aragon. European Journal of Agronomy 12: 191-199.
- López, A.; Valera, D.L.; Molina-Aiz, F.D. 2011. Sonic anemometry to measure natural ventilation in greenhouses. Sensors 11: 9820-9838.
- López, A.; Valera, D.L.; Molina-Aiz, F.D.; Peña, A.; Marín, P. 2013. Field analysis of the deterioration after some years of used of four insect-proof screens utilized in Mediterranean greenhouses. Spanish Journal of Agricultural Research 11: 958-967.
- López, A.; Valera, D.L.; Molina-Aiz, F.D.; Peña, A.; Marín, P. 2014. Microclimate evaluation of a new design of insect-proof screen in a Mediterranean greenhouse. Spanish Journal of Agricultural Research 4: 273-279.
- López, A.; Molina-Aiz, F.D.; Valera, D.L.; Peña, A. 2016. Wind tunnel analysis of the airflow through insect-proof screens and comparison of their effect when installed in a Mediterranean greenhouse. Sensors 16: 690.
- Lozano, F.J.; Soriano, M.; Martinez, S.; Asensio, C. 2013. The influence of blowing soil trapped by shrubs of fertility in Tabernas District (SE, Spain). Land Degradation & Development 24: 575-581.
- Lu, Y.; Guan, Z.; Gurgenci, H.; Zou, Z. 2013. Windbreak walls reverse the negative effect of crosswind in short natural draft dry cooling towers into a performance enhancement. International Journal of Heat and Mass Transfer 63: 162-170.
- Melikov, A.K.; Langkilde, G.; Derbiszewski, B. 1990. Airflow characteristic in the occupied zone of rooms with displacement ventilation. ASHRAE Transactions 96: 555-563.
- Molina-Aiz, F.D.; Valera, D.L.; Alvarez, A.J.; Madueño, A. 2006. A wind tunnel study of airflow through horticultural crops: determination of the drag coefficient. Biosystems Engineering 93: 447-457.
- Molina-Aiz, F.D.; Valera, D.L.; Peña, A.A.; Gil, J.A.; López, A. 2009. A study of natural ventilation in an Almería-type greenhouse with insect screens by means of tri-sonic anemometry. Biosystems Engineering 104: 224-242.
- Molina-Aiz, F.D.; Valera, D.L.; López, A. 2011. Airflow at the openings of a naturally ventilated Almería-type greenhouse with insect-proof screens. Acta Horticulturae 893: 545-552.
- Molina-Aiz, F.D.; Valera, D.L.; López, A.; Álvarez, A.J. 2012a. Analysis of cooling ventilation efficiency in a naturally ventilated Almería-type greenhouse with insect screens. Acta Horticulturae 927: 551-558.
- Molina-Aiz, F.D.; Valera, D.L.; Escamirosa, C.; López, A.; Álvarez, A.J. 2012b. Effects of insect-proof screens used in greenhouse on microclimate and fruit yield of tomato (Solanum lycopersicum L.) in a Mediterranean climate. Acta Horticulturae 927: 707-714.
- Ouyang, Q.; Dai, W.; Li, H.; Zhu, Y. 2006. Study on dynamic characteristics of natural and mechanical wind in built environment using spectral analysis. Build and Environment 41: 418-426.
- Raine, J.K.; Stevenson, D.C. 1977. Wind protection by model fences in simulated atmospheric boundary layer. Journal of Wind Engineering and Industrial Aerodynamics 2: 159-180.
- Shilo, E.; Teitel, M.; Mahrer, Y.; Boulard, T. 2004. Air-flow patterns and heat fluxes in roof-ventilated multi-span greenhouse with insect-proof screens. Agricultural and Forest Meteorology 122: 3-20.
- Stull, R.B. 1988. An Introduction to Boundary Layer Meteorology. Kluwer Academics, Dordrecht, The Netherlands.
- Tanny, J.; Haslavsky, V.; Teitel, M. 2008. Airflow and heat flux through the vertical opening of buoyancy-induced naturally ventilated enclosures. Energy and Buildings 40: 637-646.
- Tuzet, A.; Wilson, J.D. 2007. Measured winds about a thick hedge. Agricultural and Forest Meteorology 145: 195-205.
- Valera, D.L.; Molina-Aiz, F.D.; Álvarez, A.J. 2006. Aerodynamic analysis of several insect-proof screens used in greenhouses. Spanish Journal of Agricultural Research 4: 273-279.
- Wang, X.; Wang, G.; Lang, L.; Hua, T.; Wang, H. 2013. Aeolian transport and sandy desertification in semiarid China: a wind tunnel approach. Land Degradation & Development 24: 605-612.
- Yeh, C.P.; Tsai, C.H.; Yang, R.J. 2010. An investigation into the sheltering performance of porous windbreaks under various wind directions. Journal of Wind Engineering & Industrial Aerodynamics 98: 520-532.
Edited by
Publication Dates
-
Publication in this collection
Nov-Dec 2017
History
-
Received
11 Apr 2016 -
Accepted
11 Oct 2016