ABSTRACT:
The Mantiqueira Range region is one of the most important headwaters in southeastern Brazil. In this context, the relationship between pedology and hydrology has been debated and analyzed in recent years, contributing to the creation of a multidisciplinary science call hydropedology. Therefore, the aim of this study was to evaluate the hydropedological properties of a mountainous Clayey Humic Dystrudept in the Mantiqueira Range region, in the state of Minas Gerais, Brazil, comparing two land-uses, native forest and pasture. The hydraulic conductivity results demonstrated that native forest (MFO) has a strong influence on this parameter, offering conditions for movement of water in the soil that are more adequate in this profile than in pasture. These results were supported by pore size distribution analyses which showed that soil from native forest has a greater amount of macropores than soil from pasture as well as greater connectivity between the macropores. In general, the MFO site had greater S index values than the micro-catchment taken from pasture, offering favorable physical conditions for the formation of preferential flowpaths in the soil profile and, therefore, better conditions for groundwater recharge. Soil erosion and water quality results confirmed the importance of native forest areas in the interaction between interception of the direct impact of intense precipitation on the soil surface, and hydropedological attributes, such as saturated hydraulic conductivity and porosity.
Keywords:
S index; saturated hydraulic conductivity; soil pore size distribution; soil erosion; water quality
Introduction
The relationship between pedology and hydrology has been debated and analyzed in recent years, contributing to the creation of a multidisciplinary science, which seeks to integrate the respective fields of research (Lin et al., 2006Lin, H.; Bouma, J.; Pachepsky, Y.; Western, A.; Thompson, J.; van Genuchten, R.; Vogel, H.J.; Lilly, A. 2006. Hydropedology: synergistic integration of pedology and hydrology. Water Resources Research 42: W05301. DOI: 10.1029/2005WR004085
https://doi.org/10.1029/2005WR004085...
) known as Hydropedology. This interweaving of Soil Science and Hydrology promotes the interface between the pedosphere and the hydrosphere with emphasis on soils and associated landscapes (Lin, 2012Lin, H. 2012. Hydropedology: addressing fundamentals and building bridges to understand complex pedologic and hydrologic interactions. p. 3-40. Hydropedology: synergistic integration of soil science and hydrology. Wiley Blackwell, Hoboken, NJ, USA.).
Since Hydropedology is a powerful tool for environmental studies (Bouma, 2006Bouma, J. 2006. Hydropedology as a powerful tool for environmental policy research. Geoderma 131: 275-286.; Mello and Curi, 2012Mello, C.R.; Curi, N. 2012. Hydropedology. Ciência e Agrotecnologia 36: 137-146.), its application to the Mantiqueira Range, which is the most important headwater region in southeastern Brazil, needs to be taken into account. The geomorphological characteristics of the Mantiqueira Range region indicate that this environment is fragile, with shallow to moderately deep soils, and steep topography varying from undulating to mountainous and abundant precipitation.
Dystrudepts are the dominant pedologic unit in the Mantiqueira Range region (Menezes et al., 2014Menezes, M.D.; Silva, S.H.G.; Mello, C.R.; Owens, P.R.; Curi, N. 2014. Solum depth spatial prediction comparing conventional with knowledge-based digital soil mapping approaches. Scientia Agricola 71: 316-323.). They are very susceptible to soil erosion and runoff generation due to their tendency to form crusts (Buol et al., 2011Buol, S.W.; Southard, F.J.; Graham, R.C.; McDaniel, P.A. 2011. Soil Genesis and Classification. John Wiley, New York, NY, USA.) which controls infiltration (Fox et al., 2004Fox, D.M.; Bryan, R.B.; Fox, C.A. 2004. Changes in pore characteristics with depth for structural crusts. Geoderma 120:109-120.). This being the case, the predominance of this type of soil in the headwater areas with a high amount of rain (Alvarenga et al., 2016Alvarenga, L.A.; Mello, C.R.; Colombo, A.; Cuartas, L.A.; Chou, S.C. 2016. Hydrological responses to climate changes in a headwater watershed. Ciência e Agrotecnologia 40: 647-657.) as well as their environmental fragility and lack of appropriate management and land-use, make this soil a key to understanding hydropedological processes and their influence on the environment.
It is noteworthy that there are few studies detailing the dynamics of soil water under the influence of the Mantiqueira Range landscape. Therefore, the aim of this study was to evaluate the hydropedological properties of a mountainous Clayey Humic Dystrudept in the Mantiqueira Range region, in the state of Mato Grosso, Brazil, comparing two land-uses, native forest and pasture.
Materials and Methods
Study site
This study was undertaken at the Lavrinha Creek Watershed (LCW) which consists of an experimental area of about 676 ha, with elevations ranging from 1137 to 1733 m at the highest ridge and studied sites located in native forest (MFO) and pasture (MPA) (Figure 1).
Geographical location at Lavrinha Creek Watershed (LCW) with respective digital elevation model (DEM) and the studied sites of native forest (MFO) and pasture (MPA).
According to Ávila et al. (2014)Ávila, L.F.; Mello, C.R.; Pinto, L.C.; Silva, A.M. 2014. Partitioning of pluvial precipitation in a watershed occupied by Atlantic Forest in Mantiqueira range, MG State. Ciência Florestal 24: 583-595 (in Portuguese, with abstract in English). and Oliveira et al. (2014)Oliveira, A.S.; Silva, A.M.; Mello, C.R.; Alves, G.J. 2014. Stream flow regime of springs in the Mantiqueira mountain range region, Minas Gerais State. Cerne 20: 343-349., MFO presents an average slope of 45 %, whereas the MPA presents very rugged relief class (20-45 %) in 67 % of the area and mountainous (45-75 %) in 11 % of the area.
The parent material of the soils is Gneiss from the Neoproterozoic age whose weathering process has resulted in a predominance of Dystrudepts (soils classified according to Soil Taxonomy (Staff, 1999Staff, S.S. 1999. Soil Taxonomy: A Basic System of Soil Classification for Making and Interpreting Soil Surveys. 2ed. USDA-SCS, Washington, DC, USA.)) covering 92 % of the watershed and Udifluvents and Fluvaquents on the lower areas of the landscape (Menezes et al., 2014Menezes, M.D.; Silva, S.H.G.; Mello, C.R.; Owens, P.R.; Curi, N. 2014. Solum depth spatial prediction comparing conventional with knowledge-based digital soil mapping approaches. Scientia Agricola 71: 316-323.) (Figure 2). The LCW relief is steep with concave-convex hillsides, with average slopes varying from 35 to 40 %, and a predominance of linear pedoform and narrow fluvial plains (Menezes et al., 2014Menezes, M.D.; Silva, S.H.G.; Mello, C.R.; Owens, P.R.; Curi, N. 2014. Solum depth spatial prediction comparing conventional with knowledge-based digital soil mapping approaches. Scientia Agricola 71: 316-323.).
Soil and land-use map for Lavrinha Creek Watershed highlighting the studied sites of native forest (MFO) and pasture (MPA).
In the studied area, the Dystrudepts are shallow, with the presence of a high silt/clay ratio, which are therefore susceptible to erosion and can easily develop crusting when vegetative cover is sparse or absent (Buol et al., 2011Buol, S.W.; Southard, F.J.; Graham, R.C.; McDaniel, P.A. 2011. Soil Genesis and Classification. John Wiley, New York, NY, USA.). The soil under native forest has a litter layer, lying on the soil top, of an approximately 0.15 m thick organic layer comprised of decaying leaf litter and other organic materials. Another important characteristic of this soil is the C horizon near the surface, which has a weak, blocky structure even under moist or wet conditions, making it very susceptible to gully erosion (Buol et al., 2011Buol, S.W.; Southard, F.J.; Graham, R.C.; McDaniel, P.A. 2011. Soil Genesis and Classification. John Wiley, New York, NY, USA.).
The native vegetation is Atlantic forest, mostly Upper Montane Forest (Ávila et al., 2014Ávila, L.F.; Mello, C.R.; Pinto, L.C.; Silva, A.M. 2014. Partitioning of pluvial precipitation in a watershed occupied by Atlantic Forest in Mantiqueira range, MG State. Ciência Florestal 24: 583-595 (in Portuguese, with abstract in English).) and the land cover, besides Atlantic Forest that occupies 62 % of the area in the steepest slopes, is 33% degraded pasture and 5% Eucalyptus grandis plantation (Figure 2).
Soil physical and chemical properties
Soil samples (both disturbed and undisturbed) were taken from the two micro-catchments with different land uses (native forest and pasture), in three locations along the hillslope: footslope, midslope, and upslope. The sampling was carried out at the center of each depth sampled at 0-20, 20-50 and 50-100 cm, with three replicates per soil depth in each trench opened. By working from soil sample analysis in toposequence, it is possible to understand the behavior of the soils, especially the influence of the relief on drainage, and vertical and horizontal water movement, which can promote alterations in the soil attributes and favor the identification of portions of the landscape that are more susceptible to erosion, when they lack vegetation cover.
Particle size distribution was determined using the Hydrometer Method (Gee and Bauder, 1986Gee, G.W.; Bauder, J.W. 1986. Particle-size analysis. p. 383-411. In: Klute, A., ed. Methods of soil analysis. American Society of Agronomy, Madison, WI, USA.). Organic carbon was determined according to Walkley and Black (1934)Walkley, A.; Black, I. 1934. An examination of the Degtjareff method for determining soil organic matter, and a proposed modification of the chromic acid titration method. Soil Science 37: 29-38. which involves the dichromate oxidation technique. Bulk density was determined according to Blake and Hartge (1986)Blake, G.R.; Hartge, K.H. 1986. Bulk density.p. 363-375. In: Klute, A., ed. Methods of soil analysis. American Society of Agronomy, Madison, WI, USA..
Given that Dystrudepts in the Mantiqueira Range region present shallow to moderately deep soils and that, consequently, the saturated zone is near the surface (Pinto et al., 2015aPinto, L.C.; Mello, C.R.; Owens, P.R.; Norton, L.D.; Curi, N. 2015a. Role of Inceptisols in the hydrology of mountainous catchments in Southeastern Brazil. Journal of Hydrologic Engineering 21: 05015017-1 DOI: 10.1061/(ASCE)HE.1943-5584.0001275
https://doi.org/10.1061/(ASCE)HE.1943-55...
), the choice of depths studied was made with a view to understanding the water percolation process beginning in the surface layer toward to the saturated zone.
Saturated hydraulic conductivity
A database of saturated hydraulic conductivity (Ksat) was established using a constant flow permeameter (Ghelph permeameter - model 2800KI), and 198 points were sampled in the LCW's area. The Ksat map was obtained by digital soil mapping techniques, following the recommendation of Pinto et al. (2016)Pinto, L.C.; Mello, C.R.; Norton, L.D.; Owens, P.R.; Curi, N. 2016. Spatial prediction of soil-water transmissivity based on fuzzy logic in a Brazilian headwater watershed. Catena 143: 26-34.. The Ksat spatial distribution was derived from a soil survey wherein each soil map unit assumes a unique value based on the soil profile described, representing a central or modal concept for each soil map unit (Menezes et al., 2014Menezes, M.D.; Silva, S.H.G.; Mello, C.R.; Owens, P.R.; Curi, N. 2014. Solum depth spatial prediction comparing conventional with knowledge-based digital soil mapping approaches. Scientia Agricola 71: 316-323.). Based on fuzzy membership values, the continuous variation of Ksat could be derived from the similarity vectors (Zhu et al., 1997Zhu, A.X.; Band, L.E.; Vertessy, R.; Dutton, B. 1997. Deriving soil property using a soil land inference model (SoLIM). Soil Science Society of America Journal 61: 523-533.).
The micro-catchments from the forest and pasture were selected, the Ksat values were accounted for pixel by pixel and the frequency distribution of Ksat values were analyzed enabling the influence of the land-use over water movement in the soil profile to be inferred.
Soil pore size distribution
To evaluate the distribution of the soil pore size, soil water retention curves were determined in undisturbed soil cores (6.4 cm diameter and 2.5 cm length), and submitted to suctions of −2, −4, −6, −10 kPa, on fritted-glass Buchner funnels (Vomocil, 1965Vomocil, J.A. 1965. Porosity. p. 499-510. In: Black, C.A., ed. Methods of soil analysis: physical and mineralogical properties including statistics of measurement and sampling. American Society of Agronomy, Madison, WI, USA.), −33 and −100 kPa in medium pressure chambers; −500 and −1500 kPa in Richard's high pressure chambers, as described by Klute and Dirksen (1986)Klute, A.; Dirksen, C. 1986. Water retention: laboratory methods. Part 1. Physical and mineralogical methods. p. 635-662. In: Klute, A., ed. Methods of soil analysis. American Society of Agronomy, Madison, WI, USA..
The water retained in the soil was quantified and the respective volumetric water content calculated. The volumetric water content of a soil sample was obtained from the quotient of the volume of water, divided by the volume of dry soil, air and water in the sample.
The mathematical model that describes the soil water retention curves was adjusted by the SWRC software program (Dourado Neto et al., 2000Dourado Neto, D.; Nielsen, D.R.; Hopmans, J.W.; Reichardt, K.; Bacchi, O.O.S. 2000. Software to model soil water retention curves (SWRC, version 2.0). Scientia Agricola 57: 191-192.) version 2.00, using the van Genuchten (1980)van Genuchten, M.T. 1980. A closed-form equation for predicting the hydraulic conductivity of unsaturated soils. Soil Science Society of America Journal 44: 892-898. model:
where θ is the water content of soil (m3 m-3), Ψ the soil water tension (kPa), θs and θr the saturated water contents and the residual water content at −1500 kPa (m3 m-3) respectively, and α, m and n are the model parameters.
From the soil water retention curves, it was possible to study the pore size distribution by using the derivation of the equations in relation to the matric potential (Durner, 1994Durner, W. 1994. Hydraulic conductivity estimation for soils with heterogeneous pore structure. Water Resources Research 30: 211-223.). Using this methodology, the macropores (pore diameter > 50 μm or −6 kPa suction head) only were characterized, because of their greater importance to the water movement in the soil profile.
S index
The S index value is dependent on the soil water retention curve and can be determined from the slope at its inflection point. However, according to Dexter (2004)Dexter, A.R. 2004. Soil physical quality. Part III. Unsaturated hydraulic conductivity and general conclusions about S-theory. Geoderma 120: 227-239., the S Index should be obtained with moisture from the gravimetric data base. The moisture in the gravimetric database was defined as the ratio between water mass and the mass of wet soil.
The slope, S, at the inflection point, was obtained according to Dexter (2004)Dexter, A.R. 2004. Soil physical quality. Part III. Unsaturated hydraulic conductivity and general conclusions about S-theory. Geoderma 120: 227-239.:
where, S is the slope of the water retention curve at its inflection point, Us the saturated water content (kg kg−1), Ur the residual water content (kg kg−1); and m and n the equation empirical parameters.
Micromorphology analyses
Samples for soil micromorphology were collected from three locations in the landscape (footslope, midslope, and upslope) and at two depths (0-20 and 20-50 cm) with the Kubiena box. These samples were first air-dried and subsequently dried slowly in an oven at 40 °C, 60 °C and 100 °C, to reduce cracks in the samples due to rapid drying. Afterwards, the samples were impregnated with an epoxy resin, prepared and de-aerated under vacuum. The hardened resin blocks were polished, glued onto glass slides, sectioned and polished again to ideal thickness for micromorphological analyses as recommended by Murphy (1986)Murphy, C.P. 1986. Thin Section Preparation of Soils and Sediments. A.B. Academic Publishers, Berkhamsted, UK.. The thin sections were analyzed under a petrographic microscope equipped with polarized light.
Runoff plots and water quality monitoring
Two runoff plots were assembled in both the studied sites (MFO and MPA) and the precipitation-runoff-erosion rates were monitored throughout the year 2012. The plots, in both the studied sites, cover an area of 3 × 10 m and have an average steepness of 26 %. A pluviometer with a bucket surface of 400 cm2 was installed at each plot. After each precipitation event, total runoff was collected to calculate the soil erosion rate. With these observed data, it was possible to evaluate the erosion and runoff for both sites (Mello et al., 2016), allowing us to determine their relationship with the hydropedology indicators.
For the assessment of water quality, water samples were collected from MFO and MPA at a central point in the transverse section of the respective bodies of water, for the “in situ” analyses in the period from June 2010 to May 2011, making a total of 10 samplings in each study area. The following water quality parameters turbidity (NTU), total dissolved solids (TDS) and dissolved oxygen (DO) were analyzed in the field using a multiparameter analyzer and a digital turbidity meter.
Lavrinha Creek Watershed (LCW) instrumentation
Weather data sets at LCW cover the entire period from 2006 to 2013, where the monitoring involved measuring the climatic elements of precipitation, temperature and air moisture with a Campbell automatic meteorological station.
Statistical analyses
The analysis of variance and the differences between the means of bulk density, organic carbon, S index, water quality parameters, soil loss and runoff values for MFO and MPA were tested using the SISVAR 5.6 program (Ferreira, 2014Ferreira, D.F. 2014. Sisvar: a Guide for its Bootstrap procedures in multiple comparisons. Ciência e Agrotecnologia 38: 109-112.). Separation of the means was carried out by the t-test for unpaired observations with a level of significance of p < 0.05.
The particle size distribution values, for both microcatchments, did not have replicates.
Results and Discussion
Characterization of the hydropedology elements for LCW
The soil physical and chemical properties of the Clayey Humic Dystrudept are presented in Table 1. This soil presents a high silt/clay ratio, which is, therefore, very susceptible to erosion as it can develop crusting from the impact of rain drops on the surface when vegetative cover is sparse or absent (Buol et al., 2011Buol, S.W.; Southard, F.J.; Graham, R.C.; McDaniel, P.A. 2011. Soil Genesis and Classification. John Wiley, New York, NY, USA.). Since the C horizon is near the surface, extreme care is needed because this horizon has a weak blocky structure even under moist or wet conditions, making it susceptible to the degradation.
Soil physical and chemical properties of Clayey Humic Dystrudept in the midslope position at micro-catchment with forest (MFO) and micro-catchment with pasture (MPA).
Figure 3A and B present the average monthly precipitation and respective rainfall erosivity, calculated according to the Wischmeier and Smith (1978)Wischmeier, W.H.; Smith, D.D. 1978. Predicting rainfall erosion losses: a guide to conservation planning. USDA, Washington, DC, USA. concept for LCW, Mantiqueira Range, based on weather recorded between 2006 and 2013. Very strong rainfall erosivity could be found for LCW, extending it to the Mantiqueira Range region as a whole, especially from Nov to Mar. Thus, from the point of view of the climate, the region is very susceptible to water erosion, which demands special concerns related to land-use and management. Because of this, a better understanding of the climate characteristics of the Mantiqueira Range region is required so that conservation and management projects can be better planned and executed, minimizing the damage caused by climatic agents.
(A) Average weather and (B) average monthly precipitation erosivity observed for Lavrinha Creek Watershed from 2006 to 2013.
The climate characteristics of the region (Figure 3A) favor the high organic carbon contents under native forest, especially at the 0-20 cm depth (Table 1). The Clayey Humic Dystrudept under pasture had greater bulk density compared to the same soil under native forest, which can be ascribed to the soil compaction process due to trampling by cattle.
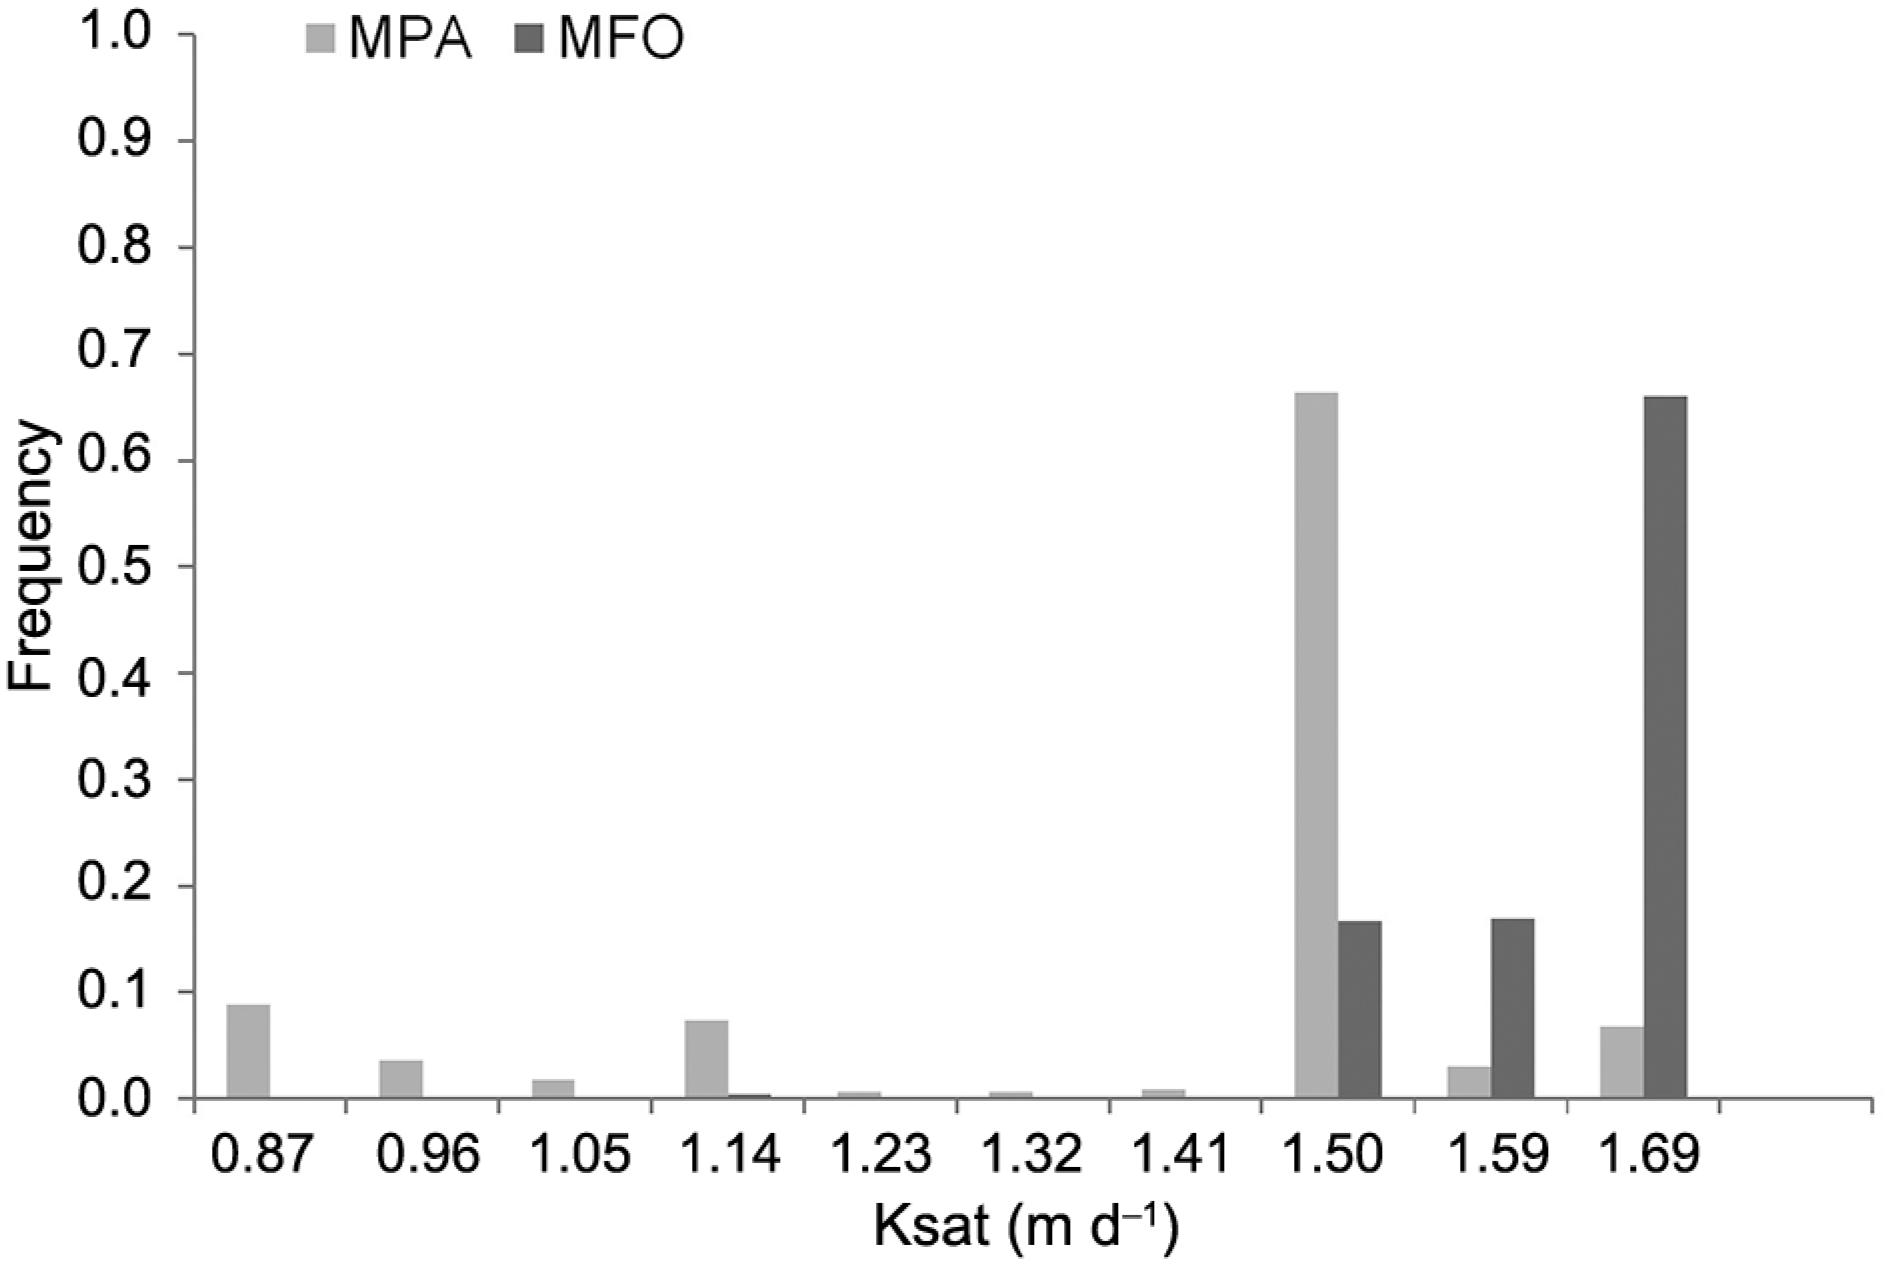
The spatial distribution of Ksat predicted by using digital soil mapping techniques and the frequency distribution of the Ksat values for both micro-catchments (MPA and MFO) are depicted in Figures 4 and 5, respectively. Comparing the histograms (Figure 5), MFO has presented much greater frequency distribution of pixels with the higher Ksat values, than MPA, which denotes a greater potential for infiltration and for groundwater recharge potential as well in MFO than MPA. MFO presents more than 99 % of the pixels with a Ksat greater than 1.50 m d−1, while for MPA, this percentage is 76 %. Given that pasture in the MPA is degraded, the Ksat tends to show lesser soil permeability, which affects its infiltration capacity. Therefore, even in areas with high rainfall intensity events, the influence of the Atlantic Forest on the potential of groundwater recharge is highly significant (Durães and Mello, 2013Durães, M.F.; Mello, C.R. 2013. Groundwater recharge behavior based on surface runoff hydrographs in two basins of the Minas Gerais state. Ambiente & Água 8: 57-66.), and promotes a reduction in direct surface runoff as well as in sediment transport.
Spatial distribution of Ksat predicted by digital soil mapping techniques; MFO = native forest; MPA = pasture.
According to Tobon et al. (2010)Tobon, C.; Bruijnzeel, L.A.; Frumau, F.K.A.; Calvo-Alvarado, J.C. 2010. Changes in soil physical properties after conversion of tropical montane cloud forest to pasture in northern Costa Rica. p. 502-515. In: Bruijnzeel, L.A.; Scatena, F.N.; Hamilton, L.S., eds. Tropical montane cloud forests, science for conservation and management. Cambridge University Press, Cambridge, UK., the highest Ksat values under native forest compared to pasture are associated with larger macropores and a well-developed soil structure under native forest. Therefore, more intensive land-use promotes lower Ksat values (Zimmermann et al., 2006Zimmermann, B.; Elsenbeer, H.; Moraes, J.M. 2006. The influence of land-use changes on soil hydraulic properties: implications for runoff generation. Forest Ecology and Management 222: 29-38.), mainly for Dystrudepts since it has presented a number of environmental problems, such as high vulnerability to water erosion, as commented on above, and low soil-water infiltration capacity. Price et al. (2010)Price, K.; Jackson, C.R.; Parker, A.J. 2010. Variation of surficial soil hydraulic properties across land uses in the southern Blue Ridge Mountains, NC, USA. Journal of Hydrology 383: 256-268. cite that changes in soil physical characteristics associated with the conversion of native to managed vegetation (i.e. pasture) reduced soil infiltration and storage capacities, possibly resulting in increased overland flow and reduced subsurface storage. Therefore, land-use has a significant effect on the hydrological behavior of soils, mainly in headwater watersheds like those found in the Mantiqueira Range region.
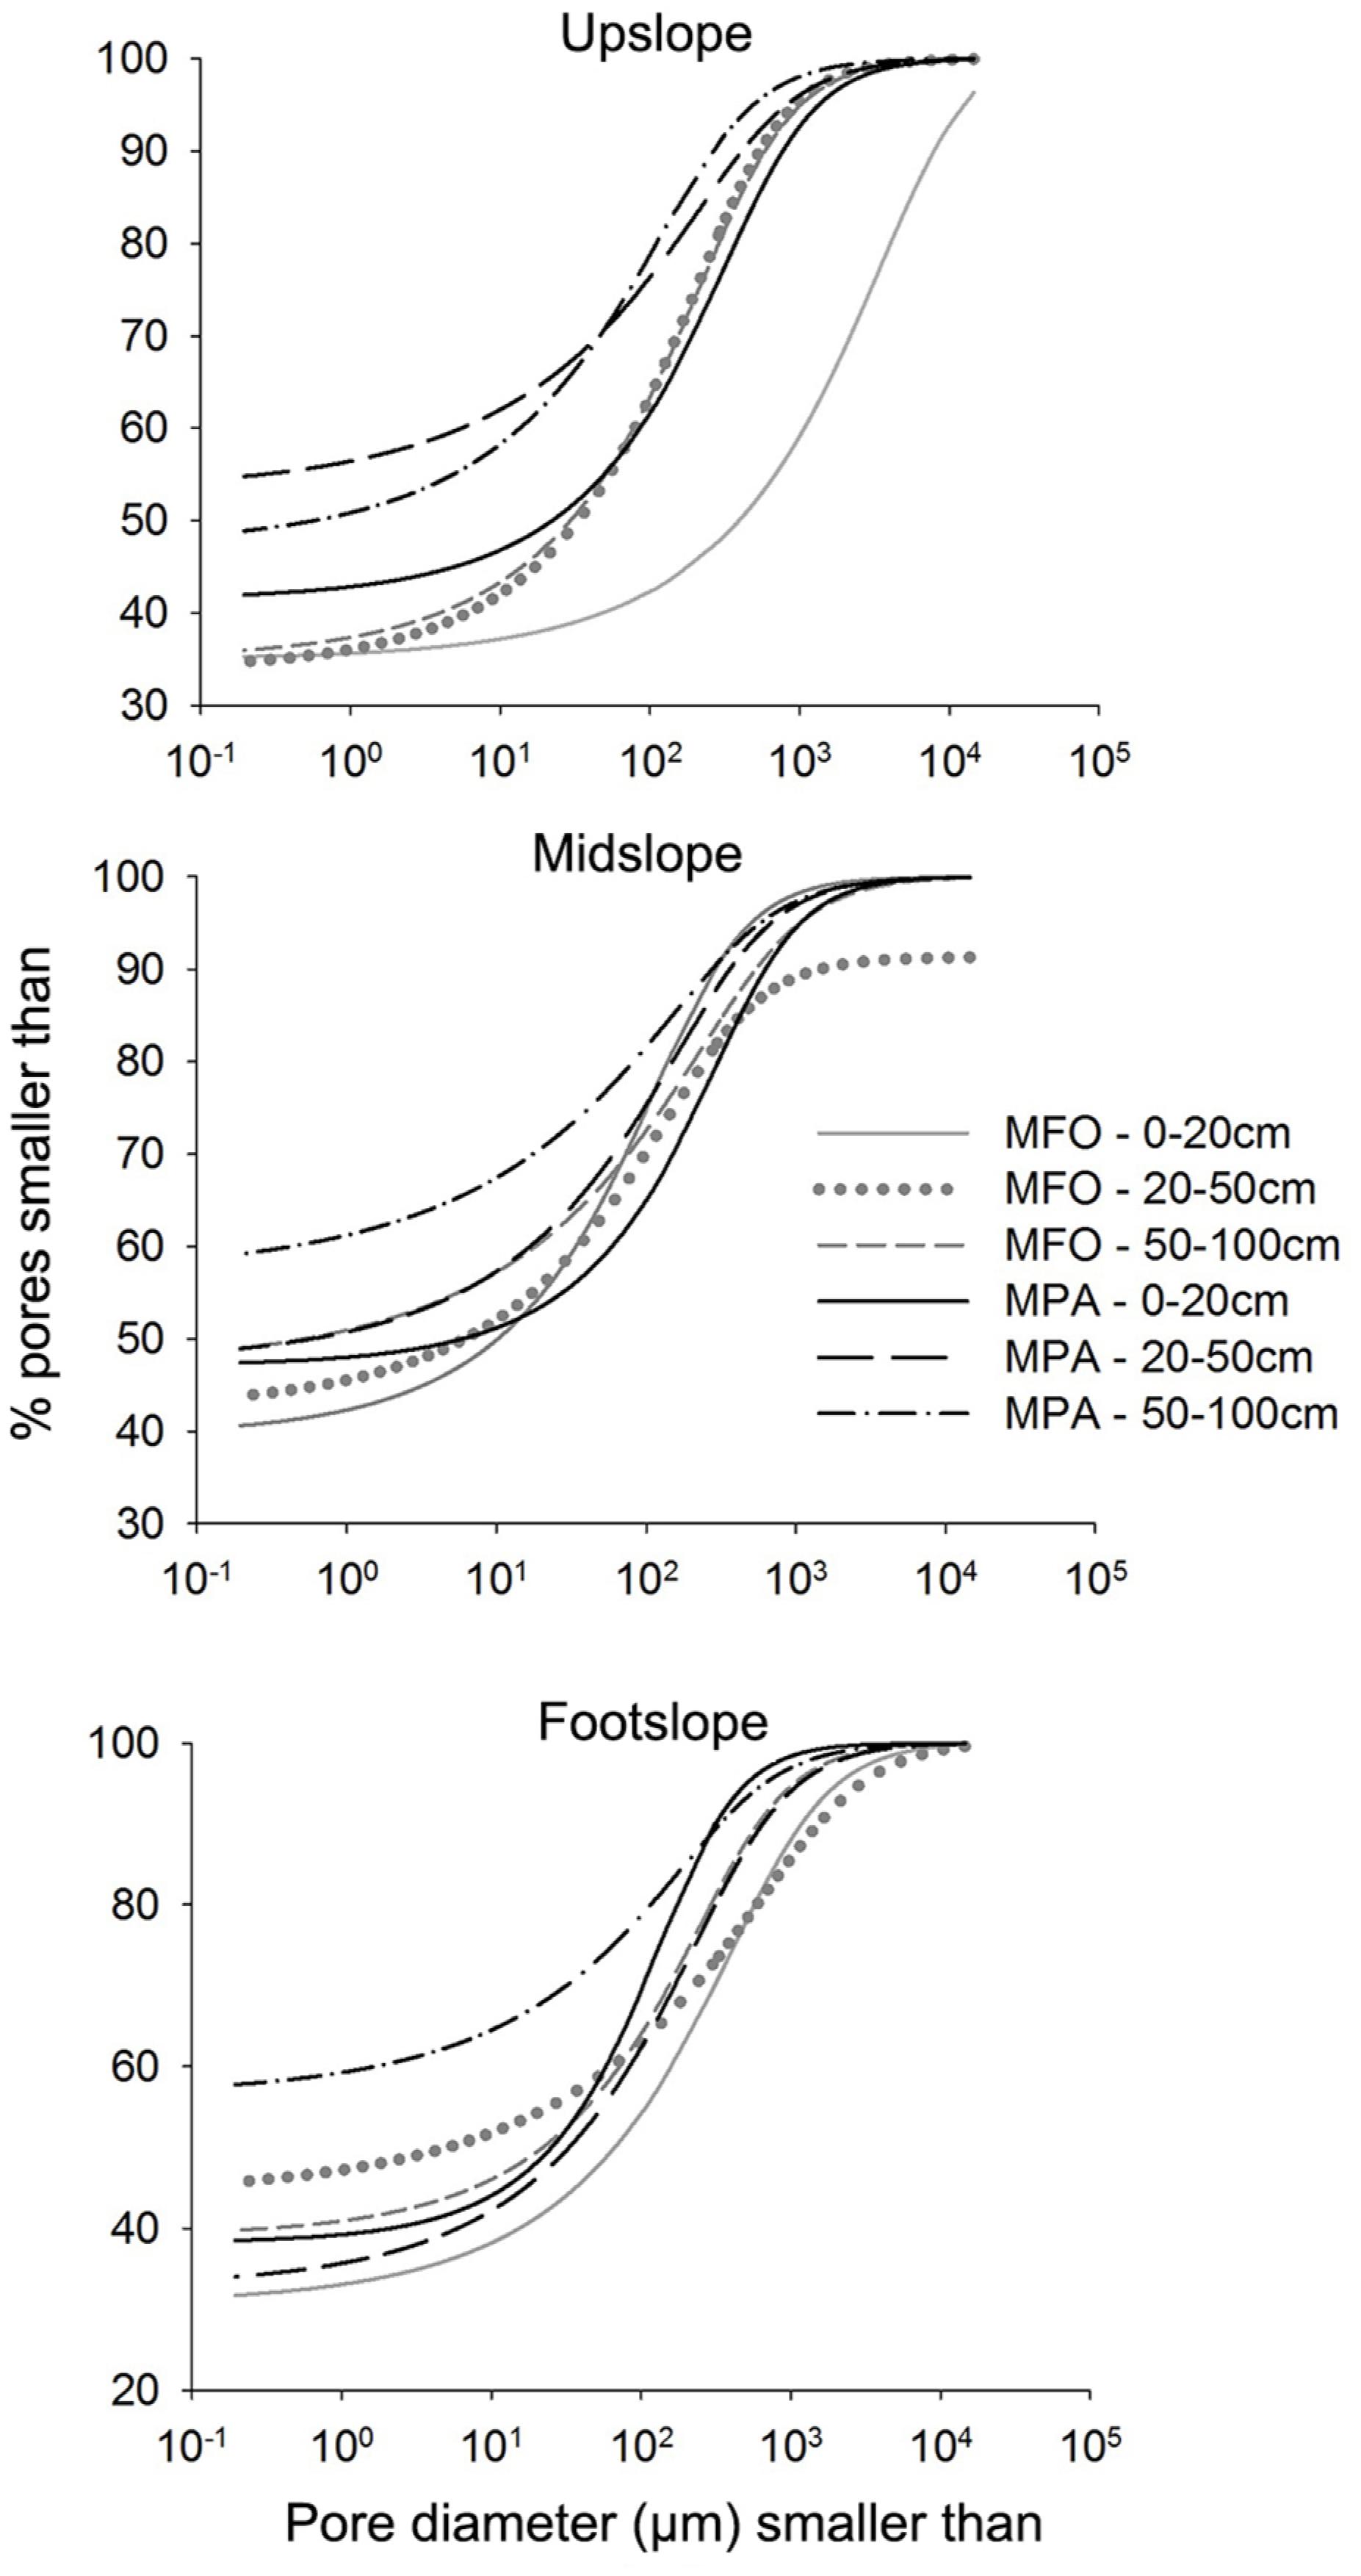
The pore size distribution is shown in Figure 6 for MFO and MPA in different hillslopes positions in the landscape. This result shows significant differences between forest and pasture for pore size distribution at different depths and positions in the hillslope. MFO has a greater amount of pores with diameter > 50 μm (macropores), especially in the surface layers, in upslope and footslope position. In other words, MFO has a lower percentage of micropores (pores < 50 μm) (Figure 6). It is worth noting the importance of this class of pores (macropores) to water movement and redistribution in the soil profile. These results are linked to the influence of the mature forest, highlighting the interaction between rainfall interception, which reduces the direct impact of very intense rainfall on the soil surface, and the soil hydrologic attributes, such as soil saturated hydraulic conductivity and macropores (Figure 4). Thus, overall, the decrease in macroporosity provoked by inadequate land-use and management can cause a serious risk of soil erosion due to the occurrence of crusting (Bu et al., 2014Bu, C.F.; Wu, S.F.; Yang, K.B. 2014. Effects of physical soil crusts on infiltration and splash erosion in three typical Chinese soils. International Journal of Sediment Research 29: 491-501.), especially in the steepest areas with a predominance of Dystrudepts, as in the Mantiqueira Range catchments. According to Roa-Garcia et al. (2011)Roa-Garcia, M.C.; Brown, S.; Schreier, H.; Lavkulich, L.M. 2011. The role of land use and soils in regulating water flow in small headwater catchments of the Andes. Water Resources Research 47: W05510., in tropical and sub-tropical environments, the native forest provides appropriate physical conditions for infiltration and a subsequent increase in storage water in the saturated zone.
Pore size distribution determined by the derivation of adjustment equations of water retention curves in relation to the matric potential; MFO = native forest; MPA = pasture.
The macroporosity (Figure 6) between MFO and MPA that is taken into account reflects a greater capacity for water movement in the soil profile in native forest compared to pasture.
Further, the lack of proper management in the pastured area causes crusting at the surface, which reduces the macropore volume. Since the Dystrudepts are the main soil type in the watershed studied (Figure 2) and given that these soils are very susceptible to crusting, these aspects make the pasture area very fragile, with a tendency to decrease the already low level of water infiltration and the other hydrologic effects.
The lower values of macroporosity in soils under pasture when compared with forest might also be attributed to the compaction of the topsoil due to animal foot traffic at this site (Celik, 2005Celik, I. 2005. Land-use effects on organic matter and physical properties of soil in a southern Mediterranean highland of Turkey. Soil & Tillage Research 83: 270-277.), and the lack of an adequate soil conservation management system. According to Hamza and Anderson (2005)Hamza, M.A.; Anderson, W.K. 2005. Soil compaction in cropping systems: a review of the nature, causes and possible solutions. Soil & Tillage Research 82: 121-145., soil compaction due to animal trampling is one of the major factors responsible for the degradation of the physical quality of soils, which is more severe for Dystrudepts.
S index values from both micro-catchments are presented in Table 2. The S index values were able to distinguish the two land-uses sampled, having low values for pasture and high values for native forest areas. The higher S values in the 0-20 cm and 20-50 cm layers in MFO are associated with lower values for bulk density and higher OC (Table 1).
S index values for Clayey Humic Dystrudept in upslope, midslope and footslope locations obtained from a micro-catchment from forest (MFO) and a micro-catchment from pasture (MPA).
In general, the MFO had higher S index values than MPA, especially upslope where all S index values differed statistically (Table 2). Therefore, according to the S index, the MFO showed better physical conditions than MPA, demonstrating the important role of the Atlantic Forest in soil conservation.
According to Hümann et al. (2011)Hümann, M.; Schuler, G.; Muller, C.; Schneider, R.; Johst, M.; Caspari, T. 2011. Identification of runoff processes: the impact of different forest types and soil properties on runoff formation and floods. Journal of Hydrology 409: 637-649., well-preserved native forests tend to promote a significant improvement in hydrologic soil properties, with better structuring and development of preferential flows. Therefore, soils under mature native forest cover have high porosity with high infiltration capacity, and a consequent reduction in direct runoff. A complex connecting macropores in the soil and soil substrate, directly influences the preferential flow of water in the soil (Beven and Germann, 2013Beven, K.; Germann, P. 2013. Macropores and water flow in soils revisited. Water Resources Research 49: 3071-3092. DOI:10.1002/wrcr.20156
https://doi.org/10.1002/wrcr.20156...
), which also adds to the groundwater recharge processes.
Micromorphology
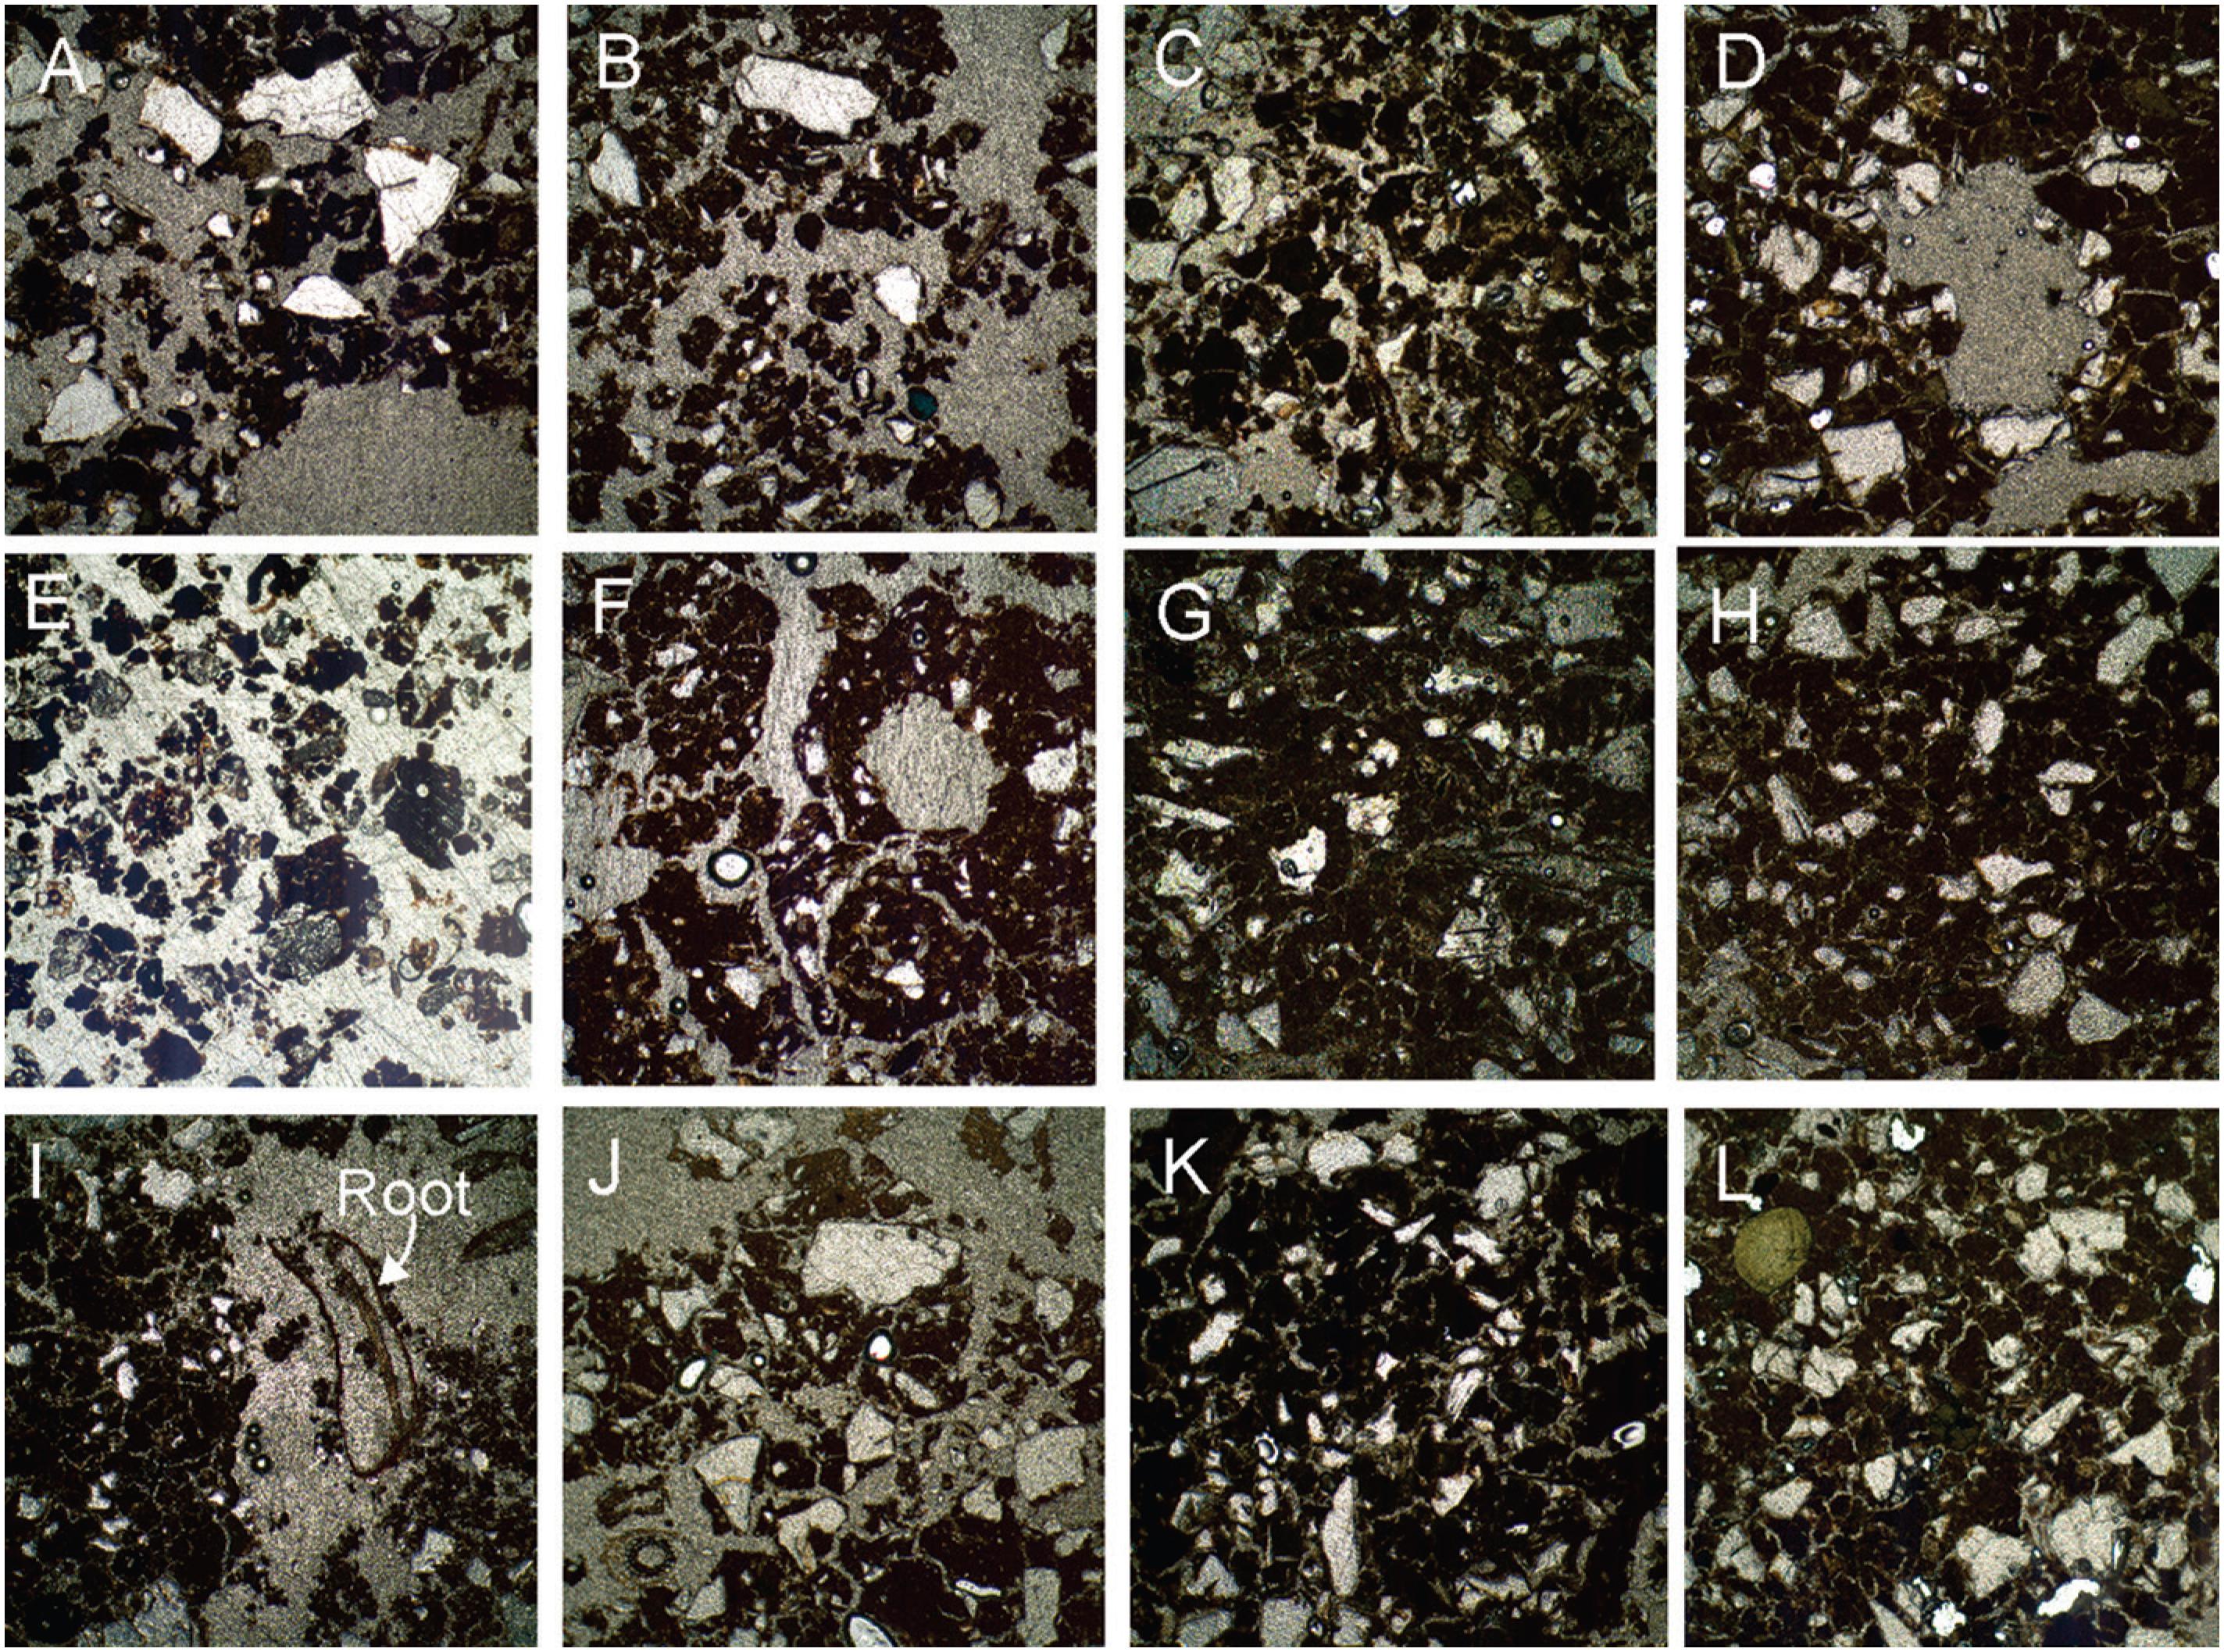
Scanned images of thin sections from two soils under both land-uses (forest and pasture) are shown in Figures 7A, B, C, D, E, F, G, H, I, J, K and L. The micromorphological image analysis clearly showed that forested soils have a more open and heterogeneous pore network structure probably linked to the biological activities and elevated root-activity observed in the field and in the scanned images of thin sections (Figure 7I). In other words, the MFO site (Figure 7A, B, E, F, I and J) has greater porosity than the MPA (Figure 7C, D, G, H, K and L) in both locations in the landscape (footslope, midslope, and upslope). Thus, MFO shows better conditions for water movement through the soil profile in accordance with the results of soil pore size distribution (Figure 6). It is important to highlight the significance of soil micromorphological analysis in the context of this work. This type of analysis represents a significant contribution to the view of soil structure and porosity. The contribution of micromorphology is visible in a number of results which soil physical analysis failed to detect, which helped validate the results.
Selected micrographs of the Clayey Humic Dystrudept at upslope with forest at (A) 0-20 and (B) 20-50 cm depths and with pasture (C) 0-20 and (D) 20-50 cm depths; Clayey Humic Dystrudept at midslope with forest at (E) 0-20 and (F) 20-50 cm depths and with pasture (G) 0-20 and (H) 20-50 cm depths; Clayey Humic Dystrudept at footslope with forest at (I) 0-20 and (J) 20-50 cm depths and with pasture (K) 0-20 and (L) 20-50 cm depths. All frames are 2.7 mm wide and under planar polarized light.
These results reinforce the role of micromorphology analysis, in conjunction with other soil analyses, in efforts to characterize in detail how Dystrudepts influence hydrological processes in general. Such studies are scarce, especially for headwater regions, whose soils are much more vulnerable to features of the environment as a whole (e.g. topography, precipitation pattern, land-use and management).
Soil erosion and hydrology indicators
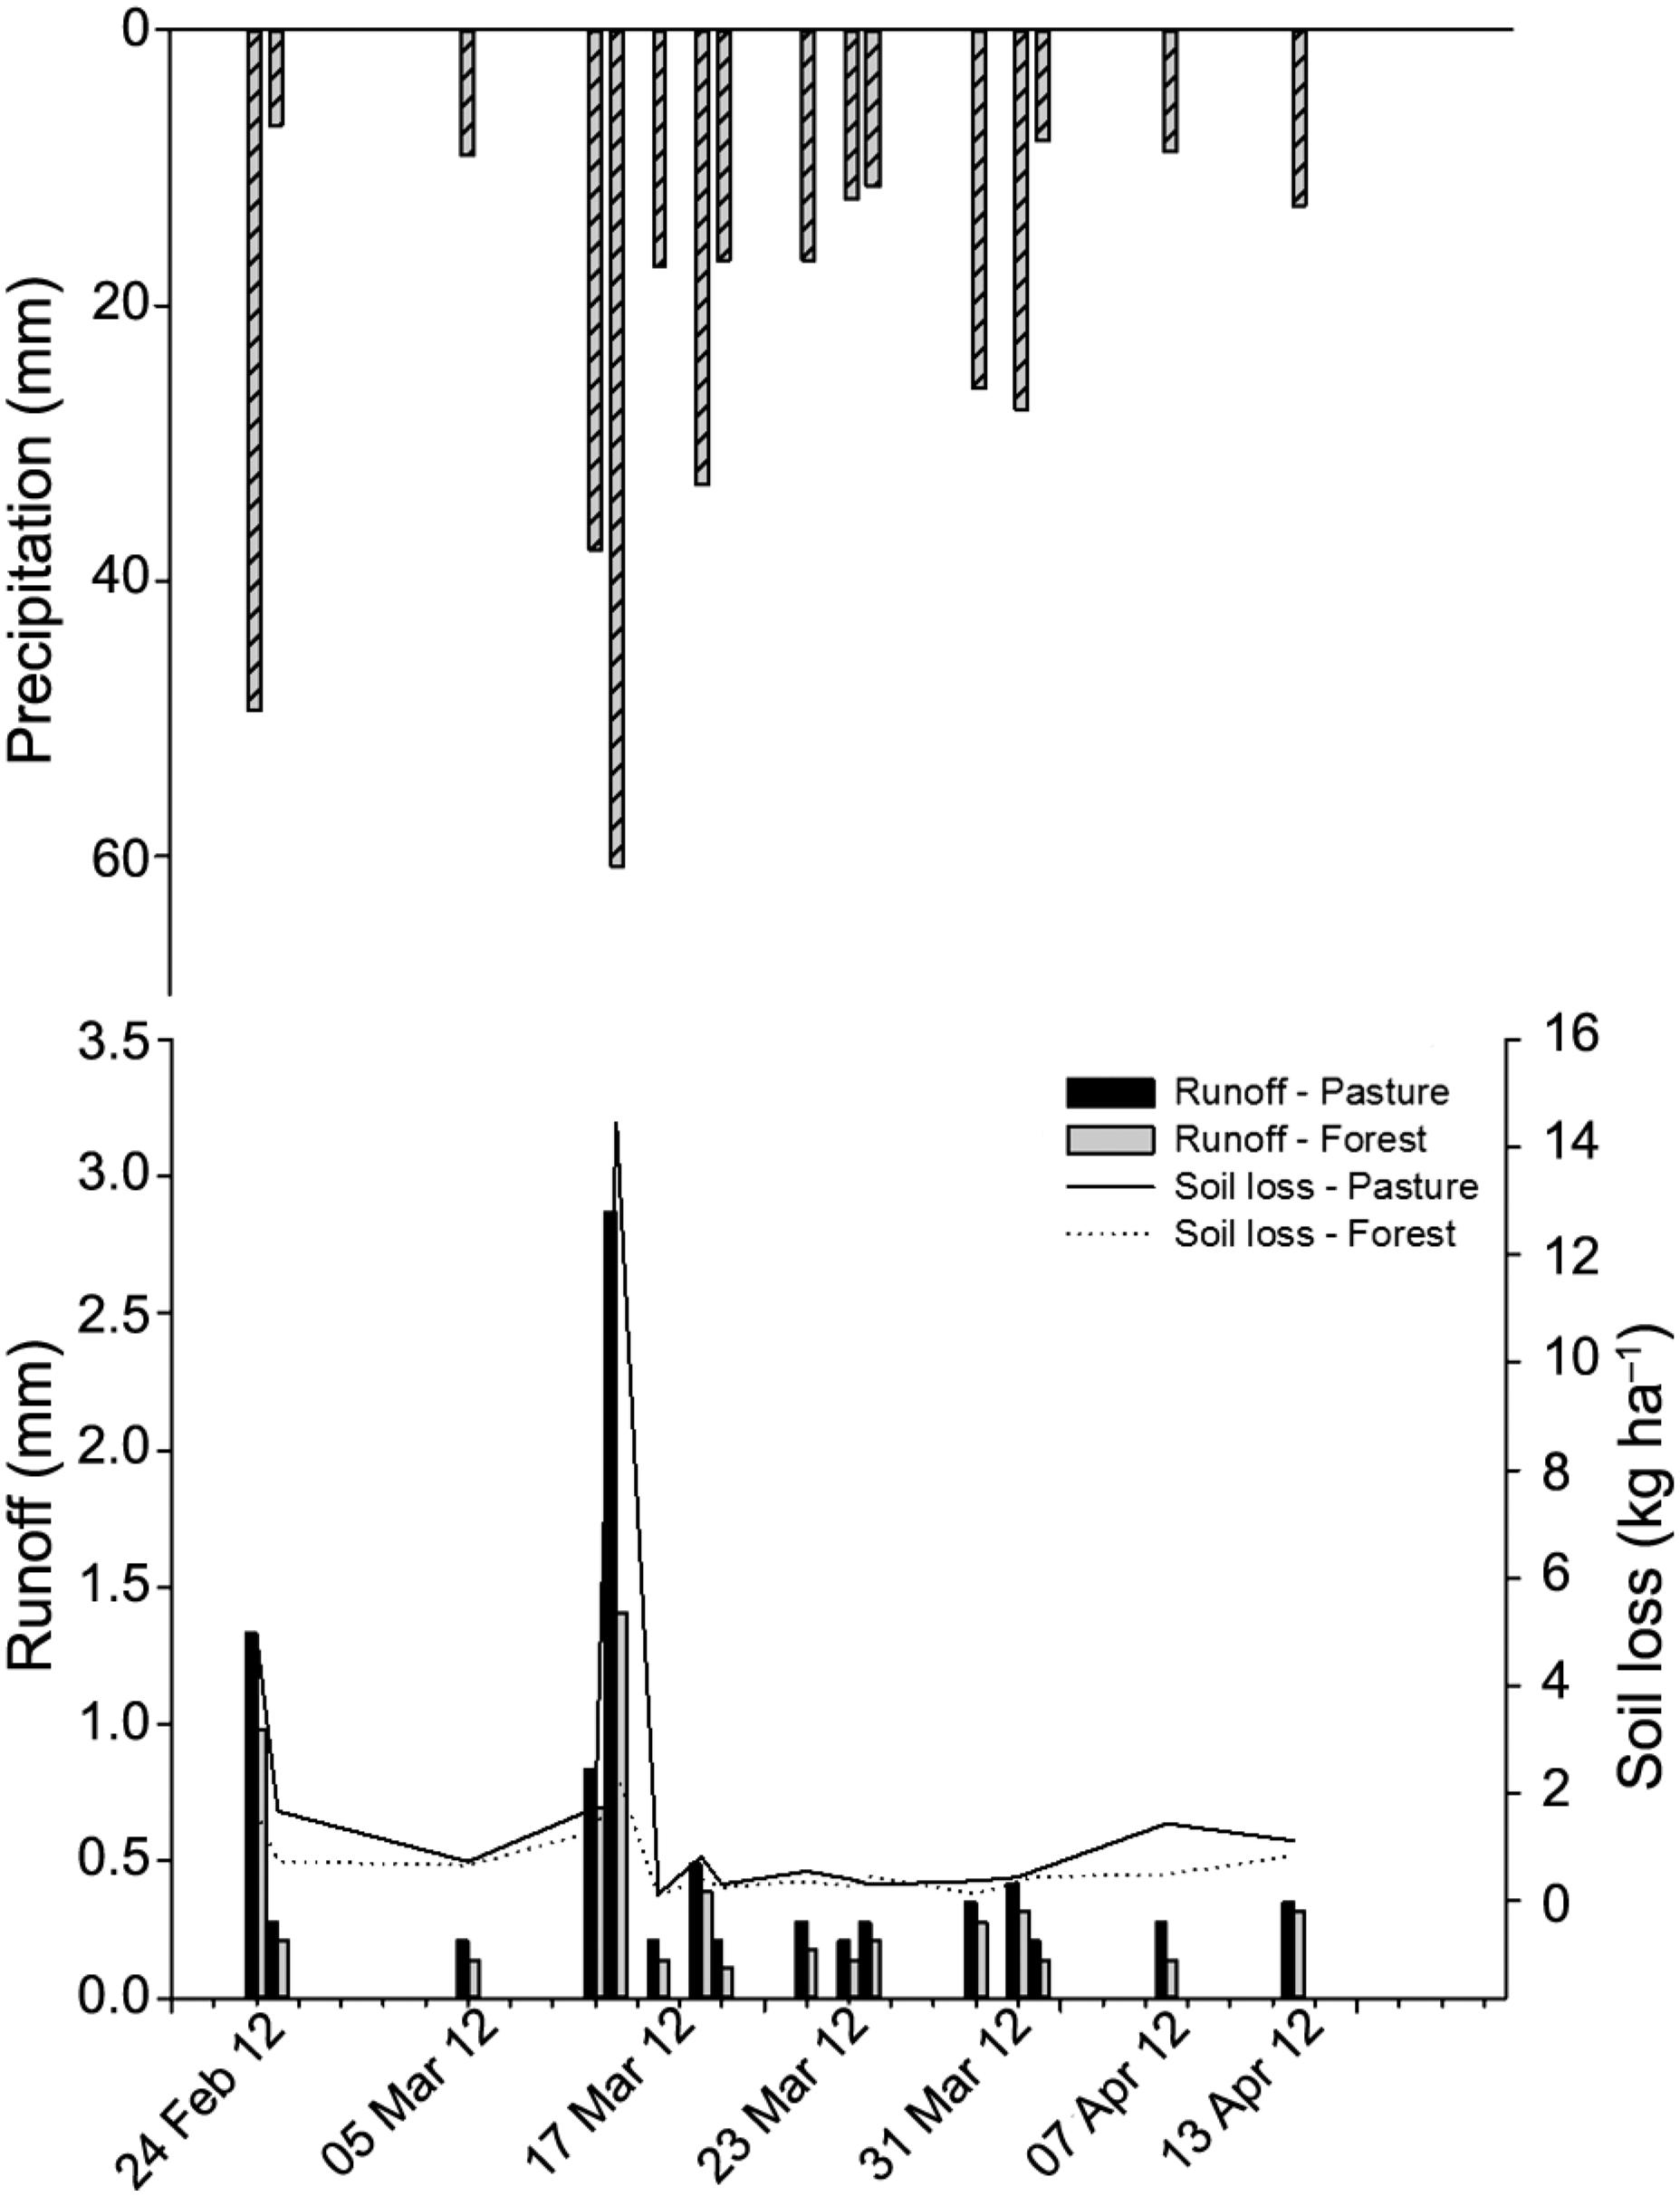
Soil loss and surface runoff produced by the rainfall events at LCW under MFO and MPA from Feb to Apr 2012 are presented in Figure 8. Even the variety of land-use treatments did not lead to statistically significant differences in soil loss and surface runoff (Table 3). It is visually evident that MFO presented the least soil loss and, consequently, the lowest surface runoff during the period analyzed (Figure 8). The maximum rainfall observed was 61 mm on 12 Mar 2012. As a result, the greatest soil losses in either land-use occurred when MPA reached approximately 500 % more than losses in MFO. The explanations for this are linked to the influence of the mature forest, highlighting the interaction between interception and the direct impact of intense rainfall on the surface, and soil hydrologic attributes such as soil saturated hydraulic conductivity (Figure 4) and porosity (Figure 6).
Soil loss and runoff and their respective average observed from natural precipitation at Lavrinha Creek Watershed under different land uses from Feb to Apr 2012.
Statistical analysis applied to runoff and soil loss values throughout the year of 2012 from forest and pasture sites, totaling 16 samplings in each study area.
MPA accounted for total surface runoff being 52 % greater than MFO for the analyzed period (Feb to Apr 2012), registering total soil losses of 30 kg ha−1 and 10.8 kg ha−1 for MPA and MFO, respectively. The result of soil losses in MPA represents an increase of 177 % in soil loss in this micro-catchment as compared with MFO. Thus, soils with mature native forest cover display a high degree of porosity with a high capacity for infiltration and a consequent reduction in surface runoff (water losses) (Hümann et al., 2011Hümann, M.; Schuler, G.; Muller, C.; Schneider, R.; Johst, M.; Caspari, T. 2011. Identification of runoff processes: the impact of different forest types and soil properties on runoff formation and floods. Journal of Hydrology 409: 637-649.). Furthermore, mature forests tend to promote an improvement in the hydrological and soil properties which reduce susceptibility to soil and water losses, as they are associated with greater structuring and increased development of preferential flows. Other authors have demonstrated less soil erosion inside the forest, when compared with other land-uses, such as Eucalyptus plantation (Avanzi et al., 2013Avanzi, J.C.; Silva, M.L.N.; Curi, N.; Norton, L.D.; Beskow, S.; Martins, S.G. 2013. Spatial distribution of water erosion risk in a watershed with Eucaliptus and Atlantic forest. Ciência Agrotecnologia 37: 427-434.) under tropical conditions. Moreover, one of the explanations for this is the significant role of the canopy in protecting the soil surface in terms of surface runoff generation.
These results are due to conditions which favor the formation of more effective macropores due to the accumulation of organic matter inside the forest. Pinto et al. (2015aPinto, L.C.; Mello, C.R.; Owens, P.R.; Norton, L.D.; Curi, N. 2015a. Role of Inceptisols in the hydrology of mountainous catchments in Southeastern Brazil. Journal of Hydrologic Engineering 21: 05015017-1 DOI: 10.1061/(ASCE)HE.1943-5584.0001275
https://doi.org/10.1061/(ASCE)HE.1943-55...
,bPinto, L.C.; Zinn, Y.L.; Mello, C.R.; Owens, P.R.; Norton, L.D.; Curi, N. 2015b. Micromorphology and pedogenesis of mountainous Inceptisols in the Mantiqueira range (MG). Ciência e Agrotecnologia 39: 455-462.) verified losses of 50 % and 28 % of soil organic matter contents at depths of 0-20 and 20-50 cm, respectively, when the land-use was changed from forest to pasture in the Mantiqueira Range region.
Our results exemplify the influence of forest on the interception of the impact of intense precipitation on the surface, where, for example, average monthly rainfall erosivity observed for LCW from 2006 to 2013 showed that the greatest monthly precipitation occurred in Jan of 2011 (Figure 3A and B). In this period, more than 900 mm was recorded, resulting in a greater contribution of surface runoff as well as in soil losses. However, Pinto et al. (2015aPinto, L.C.; Mello, C.R.; Owens, P.R.; Norton, L.D.; Curi, N. 2015a. Role of Inceptisols in the hydrology of mountainous catchments in Southeastern Brazil. Journal of Hydrologic Engineering 21: 05015017-1 DOI: 10.1061/(ASCE)HE.1943-5584.0001275
https://doi.org/10.1061/(ASCE)HE.1943-55...
) found high soil saturated hydraulic conductivity values under forest environment where overland flow had little impact on streamflow.
According to water quality parameter results from MFO and MPA (Figure 9), precipitation seasonality is an important force that drives water quality in both the studied environments (forest and pasture). We can see that the lowest values for the water quality parameters occurred in the rainy season, mainly between Nov and Mar. This is related to an increase in runoff due to the precipitation period, which depreciates water quality. MFO showed the greatest dissolved oxygen values, corroborating the protective characteristics of this type of environment. According to Pinto et al. (2015a)Pinto, L.C.; Mello, C.R.; Owens, P.R.; Norton, L.D.; Curi, N. 2015a. Role of Inceptisols in the hydrology of mountainous catchments in Southeastern Brazil. Journal of Hydrologic Engineering 21: 05015017-1 DOI: 10.1061/(ASCE)HE.1943-5584.0001275
https://doi.org/10.1061/(ASCE)HE.1943-55...
, it is important to stress that Dystrudepts under pasture (MPA) are not subject to any soil conservation practices in the area. As for the level of degradation, it was observed that, on average, there was an increase of 48% in turbidity values for pasture when compared to the native forest. Despite the TDS values for MPA being lower than those for MFO (Figure 9) and the significant statistical difference between forest and pasture (Table 4), both TDS concentration values are considered low, according to CONAMA Resolution 357/05, which describes TDS concentrations less than 500 mg L−1 as indicative of preserved environments. The explanations for these results are linked to the geomorphological characteristics of this region, with shallow soils, steep topography and abundant rainfall, where TDS concentrations should be measured soon after the occurrence of rainfall, since these topographic characteristics do prompt a very quick runoff response to this rainfall (Pinto et al., 2013Pinto, L.C.; Mello, C.R.; Ávila, L.F. 2013. Water quality indicators in the Mantiqueira range region, Minas Gerais state. Cerne 19: 687-692.).
Total dissolved solids (TDS), Turbidity (NTU) and dissolved oxygen (DO) from creeks inside a micro-catchment from pasture (MPA) and another from forest (MFO) at Lavrinha Creek Watershed.
Statistical analysis applied to the water quality parameters values obtained from a micro-catchment from pasture (MPA) and a micro-catchment from forest (MFO) in the period from June 2010 to May 2011, totaling 10 samplings in each study area.
The water quality results confirmed the importance of native forest areas in the maintenance of environmental integrity, showing why efficient soil management and planned land-use help protect the water quality, especially in sensitive environments such as the Mantiqueira Range.
An understanding of the critical zone (from the canopy to the bottom of the aquifer) is essential to any effort to conserve and manage headwater watersheds, allowing for maintenance of the water in the system of an entire region. It begins with better conditions for intercepting the direct impact of intense rainfall on the soil surface; better soil hydrologic attributes, such as soil saturated hydraulic conductivity and porosity as a consequence of accumulated organic matter and biological activity. Based on these features, the native forest also provides better physical conditions for infiltration and subsequent increases in water storage in the saturated zone of soils. This observation is consistent with the higher Ksat values found in Dystrudepts under native forest and show that this environment has greater potential for water infiltration moving towards the saturated zone as is demonstrated in Figures 4 and 5. This helps to explain the recharge process and, consequently, the more significant base flow in relation to the LCW overall.
Our results justify the importance of conserving the last remnants of the Atlantic Forest in southeastern Brazil. They call for greater attention to be paid to the degradation processes occurring in the Mantiqueira Range, especially to the clearing of forests at an accelerated pace, since this is also an important environment for the conservation of endemic species of flora and fauna, and to the need to maintain the production of water throughout the year.
Conclusions
The micro-catchment from native forest had greater total porosity values and, consequently, greater saturated hydraulic conductivity values than the microcatchment from pasture, which helps to better understand the role of the last remnants of the Atlantic Forest in southeastern Brazil, and justifies the use of conservation practices in this fragile environment.
In general, the micro-catchment from the forest had higher S index values than the micro-catchment from pasture, having appropriate physical conditions for the formation of preferential flowpaths in the soil profile and, therefore, adequate conditions for groundwater recharge and storage.
Soil erosion and water quality results confirmed the importance of native forest areas to the interaction between the interception and direct impact of very intense precipitation on the soil surface, and soil hydrological attributes, such as soil saturated hydraulic conductivity and porosity.
Acknowledgments
The authors wish to thank FAPEMIG (the Minas Gerais State Foundation for Research Support) (588 - CAG PPM – 00132/14 and PPM X 0415-16), CNPq (the Brazilian National Council for Scientific and Technological Development) and CAPES (Coordination for the Improvement of Higher Level Personnel, a government organization) for the financial support for the development of this research.
References
- Avanzi, J.C.; Silva, M.L.N.; Curi, N.; Norton, L.D.; Beskow, S.; Martins, S.G. 2013. Spatial distribution of water erosion risk in a watershed with Eucaliptus and Atlantic forest. Ciência Agrotecnologia 37: 427-434.
- Ávila, L.F.; Mello, C.R.; Pinto, L.C.; Silva, A.M. 2014. Partitioning of pluvial precipitation in a watershed occupied by Atlantic Forest in Mantiqueira range, MG State. Ciência Florestal 24: 583-595 (in Portuguese, with abstract in English).
- Alvarenga, L.A.; Mello, C.R.; Colombo, A.; Cuartas, L.A.; Chou, S.C. 2016. Hydrological responses to climate changes in a headwater watershed. Ciência e Agrotecnologia 40: 647-657.
- Beven, K.; Germann, P. 2013. Macropores and water flow in soils revisited. Water Resources Research 49: 3071-3092. DOI:10.1002/wrcr.20156
» https://doi.org/10.1002/wrcr.20156 - Blake, G.R.; Hartge, K.H. 1986. Bulk density.p. 363-375. In: Klute, A., ed. Methods of soil analysis. American Society of Agronomy, Madison, WI, USA.
- Bouma, J. 2006. Hydropedology as a powerful tool for environmental policy research. Geoderma 131: 275-286.
- Bu, C.F.; Wu, S.F.; Yang, K.B. 2014. Effects of physical soil crusts on infiltration and splash erosion in three typical Chinese soils. International Journal of Sediment Research 29: 491-501.
- Buol, S.W.; Southard, F.J.; Graham, R.C.; McDaniel, P.A. 2011. Soil Genesis and Classification. John Wiley, New York, NY, USA.
- Celik, I. 2005. Land-use effects on organic matter and physical properties of soil in a southern Mediterranean highland of Turkey. Soil & Tillage Research 83: 270-277.
- Dexter, A.R. 2004. Soil physical quality. Part III. Unsaturated hydraulic conductivity and general conclusions about S-theory. Geoderma 120: 227-239.
- Dourado Neto, D.; Nielsen, D.R.; Hopmans, J.W.; Reichardt, K.; Bacchi, O.O.S. 2000. Software to model soil water retention curves (SWRC, version 2.0). Scientia Agricola 57: 191-192.
- Durães, M.F.; Mello, C.R. 2013. Groundwater recharge behavior based on surface runoff hydrographs in two basins of the Minas Gerais state. Ambiente & Água 8: 57-66.
- Durner, W. 1994. Hydraulic conductivity estimation for soils with heterogeneous pore structure. Water Resources Research 30: 211-223.
- Ferreira, D.F. 2014. Sisvar: a Guide for its Bootstrap procedures in multiple comparisons. Ciência e Agrotecnologia 38: 109-112.
- Fox, D.M.; Bryan, R.B.; Fox, C.A. 2004. Changes in pore characteristics with depth for structural crusts. Geoderma 120:109-120.
- Gee, G.W.; Bauder, J.W. 1986. Particle-size analysis. p. 383-411. In: Klute, A., ed. Methods of soil analysis. American Society of Agronomy, Madison, WI, USA.
- Hamza, M.A.; Anderson, W.K. 2005. Soil compaction in cropping systems: a review of the nature, causes and possible solutions. Soil & Tillage Research 82: 121-145.
- Hümann, M.; Schuler, G.; Muller, C.; Schneider, R.; Johst, M.; Caspari, T. 2011. Identification of runoff processes: the impact of different forest types and soil properties on runoff formation and floods. Journal of Hydrology 409: 637-649.
- Klute, A.; Dirksen, C. 1986. Water retention: laboratory methods. Part 1. Physical and mineralogical methods. p. 635-662. In: Klute, A., ed. Methods of soil analysis. American Society of Agronomy, Madison, WI, USA.
- Lin, H.; Bouma, J.; Pachepsky, Y.; Western, A.; Thompson, J.; van Genuchten, R.; Vogel, H.J.; Lilly, A. 2006. Hydropedology: synergistic integration of pedology and hydrology. Water Resources Research 42: W05301. DOI: 10.1029/2005WR004085
» https://doi.org/10.1029/2005WR004085 - Lin, H. 2012. Hydropedology: addressing fundamentals and building bridges to understand complex pedologic and hydrologic interactions. p. 3-40. Hydropedology: synergistic integration of soil science and hydrology. Wiley Blackwell, Hoboken, NJ, USA.
- Mello, C.R.; Curi, N. 2012. Hydropedology. Ciência e Agrotecnologia 36: 137-146.
- Menezes, M.D.; Silva, S.H.G.; Mello, C.R.; Owens, P.R.; Curi, N. 2014. Solum depth spatial prediction comparing conventional with knowledge-based digital soil mapping approaches. Scientia Agricola 71: 316-323.
- Murphy, C.P. 1986. Thin Section Preparation of Soils and Sediments. A.B. Academic Publishers, Berkhamsted, UK.
- Oliveira, A.S.; Silva, A.M.; Mello, C.R.; Alves, G.J. 2014. Stream flow regime of springs in the Mantiqueira mountain range region, Minas Gerais State. Cerne 20: 343-349.
- Pinto, L.C.; Mello, C.R.; Ávila, L.F. 2013. Water quality indicators in the Mantiqueira range region, Minas Gerais state. Cerne 19: 687-692.
- Pinto, L.C.; Mello, C.R.; Owens, P.R.; Norton, L.D.; Curi, N. 2015a. Role of Inceptisols in the hydrology of mountainous catchments in Southeastern Brazil. Journal of Hydrologic Engineering 21: 05015017-1 DOI: 10.1061/(ASCE)HE.1943-5584.0001275
» https://doi.org/10.1061/(ASCE)HE.1943-5584.0001275 - Pinto, L.C.; Zinn, Y.L.; Mello, C.R.; Owens, P.R.; Norton, L.D.; Curi, N. 2015b. Micromorphology and pedogenesis of mountainous Inceptisols in the Mantiqueira range (MG). Ciência e Agrotecnologia 39: 455-462.
- Pinto, L.C.; Mello, C.R.; Norton, L.D.; Owens, P.R.; Curi, N. 2016. Spatial prediction of soil-water transmissivity based on fuzzy logic in a Brazilian headwater watershed. Catena 143: 26-34.
- Price, K.; Jackson, C.R.; Parker, A.J. 2010. Variation of surficial soil hydraulic properties across land uses in the southern Blue Ridge Mountains, NC, USA. Journal of Hydrology 383: 256-268.
- Roa-Garcia, M.C.; Brown, S.; Schreier, H.; Lavkulich, L.M. 2011. The role of land use and soils in regulating water flow in small headwater catchments of the Andes. Water Resources Research 47: W05510.
- Staff, S.S. 1999. Soil Taxonomy: A Basic System of Soil Classification for Making and Interpreting Soil Surveys. 2ed. USDA-SCS, Washington, DC, USA.
- Tobon, C.; Bruijnzeel, L.A.; Frumau, F.K.A.; Calvo-Alvarado, J.C. 2010. Changes in soil physical properties after conversion of tropical montane cloud forest to pasture in northern Costa Rica. p. 502-515. In: Bruijnzeel, L.A.; Scatena, F.N.; Hamilton, L.S., eds. Tropical montane cloud forests, science for conservation and management. Cambridge University Press, Cambridge, UK.
- van Genuchten, M.T. 1980. A closed-form equation for predicting the hydraulic conductivity of unsaturated soils. Soil Science Society of America Journal 44: 892-898.
- Vomocil, J.A. 1965. Porosity. p. 499-510. In: Black, C.A., ed. Methods of soil analysis: physical and mineralogical properties including statistics of measurement and sampling. American Society of Agronomy, Madison, WI, USA.
- Walkley, A.; Black, I. 1934. An examination of the Degtjareff method for determining soil organic matter, and a proposed modification of the chromic acid titration method. Soil Science 37: 29-38.
- Wischmeier, W.H.; Smith, D.D. 1978. Predicting rainfall erosion losses: a guide to conservation planning. USDA, Washington, DC, USA.
- Zhu, A.X.; Band, L.E.; Vertessy, R.; Dutton, B. 1997. Deriving soil property using a soil land inference model (SoLIM). Soil Science Society of America Journal 61: 523-533.
- Zimmermann, B.; Elsenbeer, H.; Moraes, J.M. 2006. The influence of land-use changes on soil hydraulic properties: implications for runoff generation. Forest Ecology and Management 222: 29-38.
Edited by
Publication Dates
-
Publication in this collection
Jan-Feb 2018
History
-
Received
08 Apr 2016 -
Accepted
21 Dec 2016