ABSTRACT:
The phenotypic and genetic analysis of apple (Malus × domestica Borkh) genotypes is essential for breeding species. Information on the morphology and genetic structure of apple offers significant help for germplasm maintenance and selection of suitable material to breed superior cultivars. This study shows the results of an investigation on the morphology and the genetic diversity for 19 apple cultivars, which are preserved in an ex situ collection in Naoussa, Central Macedonia, Greece. Information was recorded over a 5-year period for 47 traits describing plant morphology and phenotype, as well as leaf and fruit quality. Data were analyzed using the principal component analysis (PCA) method. The Euclidean distance metric and the Ward’s agglomeration method were used in an unsupervised hierarchical cluster analysis of all cultivars. The cultivars were grouped into four main clusters, suggesting that the characterized apple collection has a high potential for specific breeding goals. Furthermore, the cultivars were genotyped using seven microsatellite primers. Moderate levels of polymorphism were detected, and 38 distinctive alleles (5.4 alleles per primer pair) were identified. Both multivariate clustering approach (phenotypic data) and the genetic distance clustering approach (genetic data) grouped the apple cultivars according to their type. Hence, these data could be used for protection or patenting processes of existing or new apple cultivars carried out by the EU-Community Plant Variety Office.
Keywords:
genetic diversity; genotyping; microsatellite markers; multivariate analysis; phenotyping
Introduction
Malus × domestica Borkh. (apple) is the crop with the highest economic impact of the Rosaceae family (FAO, 2015Food and Agriculture Organization of the United Nations [FAO]. 2015. FAOSTAT: Agriculture Data. FAO, Rome, Italy.) and among the most important fruit crops of temperate zones. Traditionally, genetic diversity in apple species or varieties was assessed with morphological descriptors (Reig et al., 2015Reig, G.; Blanco, Á.; Castillo, A.M.; Gogorcena, Y.; Moreno, M.Á. 2015. Phenotypic diversity of Spanish apple (Malus × domestica Borkh) accessions grown at the vulnerable climatic conditions of the Ebro Valley, Spain. Scientia Horticulturae 185: 200-210.), commonly produced by the International Board for Plant Genetic Resources (IBPGR, 1983International Board for Plant Genetic Resources [IBPGR]. 1983. Descriptor List for Apple (Malus). CTA, Wageningen, The Netherlands. (CEC AGPR/IBPGR/82/71, EUR 8354/1).) and later by the International Union for the Protection of New Varieties of Plants (UPOV, 2005International Union for the Protection of New Varieties of Plants [UPOV]. 2005. Guidelines for the conduct of tests for distinctness, uniformity and stability. UPOV, Geneva, Switzerland.). The multivariate data analysis is an efficient approach to analyze large data of apple qualitative phenotypic traits and is considered the most suitable to identify patterns and relationships among powerful statistical techniques, such as the principal component analysis (PCA) and the cluster analysis (Oliveira et al., 2012Oliveira, E.J.; Dias, N.L.P.; Dantas, J.L.L. 2012. Selection of morpho-agronomic descriptors for characterization of papaya cultivars. Euphytica 185: 253-265.; Furones-Pérez and Fernández-López, 2009Furones-Pérez, P.; Fernández-López, J. 2009. Morphological and phenological description of 38 sweet chestnut cultivars (Castanea sativa Miller) in a contemporary collection. Spanish Journal of Agricultural Research 7: 829-843.; Ganopoulos et al., 2015Ganopoulos, I.; Moysiadis, T.; Xanthopoulou, A.; Ganopoulou, M.; Avramidou, E.; Aravanopoulos, F.A.; Tani, E.; Madesis, P.; Tsaftaris, A.; Kazantzis, K. 2015. Diversity of morpho-physiological traits in worldwide sweet cherry cultivars of GeneBank collection using multivariate analysis. Scientia Horticulturae 197: 381-391.; Mehmood et al., 2014Mehmood, A.; Jaskani, M.J.; Khan, I.A.; Ahmad, S.; Ahmad, R.; Luo, S.; Ahmad, N.M. 2014. Genetic diversity of Pakistani guava (Psidium guajava L.) germplasm and its implications for conservation and breeding. Scientia Horticulturae 172: 221-232.).
However, the use of molecular markers to identify the genetic makeup of a species and a variety has become one of the most important means to characterize and manage germplasm collections of fruit species (Fernández-Fernández, 2010Fernández-Fernández, F. 2010. Final Report: GC0140 Fingerprinting the National Apple and Pear Collections. Department for Environment Food & Rural Affairs, London, UK.). Microsatellites, or SSRs, are the DNA markers of choice to uncover the genetic diversity between and within fruit species (Gupta et al., 1996Gupta, P.K.; Balyan, H.S.; Sharma, P.C.; Ramesh, B. 1996. Microsatellites in plants: a new class of molecular markers. Current Science 70: 45-54.), due to their high polymorphism level, abundance and co-dominant inheritance and reproducibility, as well as relative easiness of analysis (Madesis et al., 2013Madesis, P.; Ganopoulos, I.; Tsaftaris, A. 2013. Microsatellites: evolution and contribution. Microsatellites: Methods and Protocols: 1-13.). Previously, many authors used this technique to determine the genetic diversity in order to identify duplicates and genetic relationships within and between Malus × domestica accessions (Garkava-Gustavsson et al., 2013Garkava-Gustavsson, L.; Mujaju, C.; Sehic, J.; Zborowska, A.; Backes, G.M.; Hietaranta, T.; Antonius, K. 2013. Genetic diversity in Swedish and Finnish heirloom apple cultivars revealed with SSR markers. Scientia Horticulturae 162: 43-48.; Gaši et al., 2010Gaši, F.; Simon, S.; Pojskic, N.; Kurtovic, M.; Pejic, I. 2010. Genetic assessment of apple germplasm in Bosnia and Herzegovina using microsatellite and morphologic markers. Scientia Horticulturae 126: 164-171.; Lassois et al., 2015Lassois, L.; Denancé, C.; Ravon, E.; Guyader, A.; Guisnel, R.; Hibrand-Saint-Oyant, L.; Poncet, C.; Lasserre-Zuber, P.; Feugey, L.; Durel, C.-E. 2015. Genetic diversity, population structure, parentage analysis, and construction of core collections in the french apple germplasm based on SSR markers. Plant Molecular Biology Reporter: 1-18.; Liang et al., 2015Liang, W.; Dondini, L.; De Franceschi, P.; Paris, R.; Sansavini, S.; Tartarini, S. 2015. Genetic diversity, population structure and construction of a core collection of apple cultivars from Italian germplasm. Plant Molecular Biology Reporter 33: 458-473.; Oraguzie et al., 2005Oraguzie, N.C.; Yamamoto, T.; Soejima, J.; Suzuki, T.; Silva, H. 2005. DNA fingerprinting of apple (Malus spp.) rootstocks using simple sequence repeats. Plant Breeding 124: 197-202.; Patzak et al., 2012Patzak, J.; Paprštein, F.; Henychová, A.; Sedlák, J. 2012. Genetic diversity of Czech apple cultivars inferred from microsatellite markers analysis. Horticultural Science 39: 149-157; Pina et al., 2014Pina, A.; Urrestarazu, J.; Errea, P. 2014. Analysis of the genetic diversity of local apple cultivars from mountainous areas from Aragon (northeastern Spain). Scientia Horticulturae 174: 1-9.; Urrestarazu et al., 2012Urrestarazu, J.; Miranda, C.; Santesteban, L.G.; Royo, J.B. 2012. Genetic diversity and structure of local apple cultivars from Northeastern Spain assessed by microsatellite markers. Tree Genetics & Genomes 8: 1163-1180.). Nevertheless, only a few reports have demonstrated basic and detailed data on adaptability and fruit quality traits of Malus × domestica cultivars from different geographical areas, especially from species grown under the Greek climatic conditions.
Hence, this work aimed to: (1) determine the variability of different accessions based on phenotypic and fruit quality traits under the south-eastern Mediterranean basin climatic conditions, (2) identify the most important sources of variability of all accessions analyzed and the associations between the traits evaluated, (3) fingerprint and characterize the Greek germplasm collection using microsatellite markers of five Greek and 14 international cultivars respectively, (4) investigate the relationships among cultivars based on their genetic and phenotypic distances, and finally (5) provide useful information for breeders to select local Greek varieties of Malus × domestica for breeding programs, or for producers aiming to diversify apple production.
Materials and Methods
Plant material
We evaluated 19 cultivars (Malus × domestica Borkh) from the apple germplasm collection in Naoussa, Central Macedonia, Greece (40°37’13.8” N 22°06’49.2” E, elevation: 130 m) (Table 1).
Phenotypic analysis
Between 2005 and 2010, 47 qualitative traits were evaluated following the established descriptor lists and scores (IPGRI, 1982; UPOV, 2005International Union for the Protection of New Varieties of Plants [UPOV]. 2005. Guidelines for the conduct of tests for distinctness, uniformity and stability. UPOV, Geneva, Switzerland.): Plant: Vigor: 3: weak 5: medium 7: strong (PV), Plant: Type, 1: columnar 2: ramified (PT), Plant: Habit (columnar types excluded), 1: fastigiated 3: upright 5: spreading 7: drooping 9: weeping (PH), Plant: Type of bearing, 1: on spurs 2: on spurs and long shoots 3: on long shoots (PTB), Dormant one-year-old shoot: Pubescence (on upper half of shoot), 1: absent or very weak 3: weak 5: medium 7: strong 9: very strong (DSP), Dormant one-year-old shoot: Thickness (diameter at centre), 3: thin 5: medium 7: thick (DST), Dormant one-year-old shoot: Length of internode, 1: very short 3: short 5: medium 7: long 9: very long (DSLI), Dormant one-year-old shoot: Number of lenticels, 3: few 5: medium 7: many (DSNL), Unopened flower: Colour (balloon stage), 1: white 2: yellowish and pink 3: light pink 4: dark pink 5: red 6: purple (UFC), Flower: Size (diameter of flower with petals pressed into horizontal position), 3: small 5: medium 7: large (FS), Flower: Arrangement of petals, 1: free 2: touching 3: overlapping (FAP), Leaf: Attitude in relation to shoot, 3: upwards 5: outwards 7: downwards (LAS), Leaf blade: Length, 3: short 5: medium 7: long (LBL), Leaf blade: Width, 3: narrow 5: medium 7: large (LBW), Leaf blade: Ratio length/ width, 3: small 5: medium 7: large (LBW/L), Leaf blade: Shape of incisions of margin, 1: crenate, 2: serrate, Petiole: Length, 3: short 5: medium 7: long (PL), Fruit: Size, 1: very small 2: very small to small 3: small 4: small to medium 5: medium 6: medium to large 7: large 8: large to very large 9: very large (FS), Fruit: Height/ width ratio, 1: very small 3: small 5: medium 7: large 9: very large (FH/W), Fruit: Shape, 1: globose 2: globose to conical 3: broad globose conical 4: flat 5: flat globose 6: conical 7: narrow conical 8: truncate conical 9: ellipsoid 10: ellipsoid conical (ovoid) 11: oblong 12: oblong conical (FSh), Fruit: Ribbing, 1: absent or very weak 3: weak 5: medium 7: strong 9: very strong (FR), Fruit: Crowning at calyx end, 1: absent or very weak 3: weak 5: medium 7: strong 9: very strong (FC), Fruit: Aperture of eye, 1: closed 2: partly open 3: fully open (FAE), Fruit: Size of eye, 3: small 5: medium 7: large (FSE), Fruit: Length of sepal, 3: short 5: medium 7: long (FLS), Fruit: Depth of eye basin, 3: shallow 5: medium 7: deep (FDE), Fruit: Width of eye basin, 3: narrow 5: medium 7: broad (FEW), Fruit: Thickness of stalk, 3: thin 5: medium 7: thick (FTS), Fruit: Length of stalk, 1: very short 3: short 5: medium 7: long 9: very long, (FLS) Fruit: Depth of stalk cavity, 3: shallow 5: medium 7: deep (FDS), Fruit: Width of stalk cavity, 3: narrow 5: medium 7: broad (FWS), Fruit: Bloom of skin, 1: absent or very weak 2: weak 3: strong (FBS), Fruit: Greasiness of skin, 1: absent or very weak 2: weak 3: strong (FGS), Fruit: Ground colour, 1: yellow 2: whitish yellow 3: green yellow 4: whitish green 5: green (FGC), Fruit: Amount of over colour, 1: absent or very low 3: low 5: medium 7: high 9: very high (FAC), Fruit: Over colour, 1: orange 2: pink 3: red 4: purple 5: brown (FOC), Fruit: Intensity of over colour, 3: light 5: medium 7: dark (FIC), Fruit: Pattern of over colour of skin, 1: only solid flush 2: only striped 3: solid flush with indistinct stripes 4: mottled 5: washed out (faded) 6: equally flushed and striped 7: predominantly striped with indistinct flush (FPC), Fruit: Amount of russet around eye basin, 1: absent or very low 3: low 5: medium 7: high 9: very high (FARE), Fruit: Amount of russet on cheeks, 1: absent or very low 3: low 5: medium 7: high 9: very high (FARC), Fruit: Amount of russet around stalk cavity, 1: absent or very low 3: low 5: medium 7: high 9: very high (FARS), Fruit: Size of lenticels, 3: small 5: medium 7: large (FSL), Fruit: Firmness of the flesh (measurement with penetrometer), 1: very soft 3: soft 5: medium 7: firm 9: very firm (FFF), Fruit: Colour of the flesh, 1: white 2: cream 3: yellowish 4: pink 5: greenish (FCF), Fruit in cross-section: Aperture of locules (median through locules), 1: closed 2: partly open 3: fully open (FAL), Time of beginning of flowering (10 % open flowers), 1: very early 3: early 5: medium 7: late 9: very late (TBF), Time of maturity for consumption, 1: very early 3: early 5: medium 7: late 9: very late (TMC), (Table 2). Fruits were handpicked at commercial maturity by a single person to ensure consistency of the maturity grade.
List of phenotypic descriptors and their results in 19 apple cultivars analyzed in this study.
DNA isolation
In order to isolate total genomic DNA, we used dry leaves collected from all localities via the cetyl trimethylammonium bromide (CTAB), as described in Doyle (1987). Both quality and concentration of the extracted DNA were determined by ultraviolet spectrophotometry.
Microsatellite analysis
Seven microsatellite markers (02b1, 28f4, 05g8, CH01E12, CH01H01, CH01F02, CH01H10) were chosen from the marker sets recommended by the ECPGR for apple germplasm and were used in this study (Guilford et al., 1997; Gianfranceschi et al., 1998). The markers used were selected based on their informativeness. We selected the markers with the highest Polymorphic Information Content (PIC) and heterozygosity (He) values) and the type of their repeat (di-, tri- or more repeat units). Polymerase Chain Reaction (PCR) amplifications were carried out in a reaction volume of 20 μL containing 20 ng of template DNA, 10x PCR buffer, 200 μM of each dNTP, 10 pmol of each primer (forward primer labelled with FAM, NED, PET and VIC fluorescent dyes) and 1 U of Taq DNA Polymerase. PCR amplifications were performed according to Guilford et al. (1997) and Gianfranceschi et al. (1998). The PCR products obtained were first run in 2 % agarose gel and then loaded into an ABI PRISM 3730×l DNA sequencer. The program GENEMAPPER was used to genotype the alleles.
Statistical analysis
The data on 19 apple cultivars, including 47 qualitative traits, were analyzed by the XLSTAT software (version 2014.1). The Principal Components Analysis (PCA) method was used to investigate the simultaneous contribution of all qualitative traits to order the apple cultivars in multivariate space. We used the correlation matrix, as standardization was necessary since the variables were measured in different units (quantitative and qualitative). In addition, the PCA on the correlation matrix separated size from shape more effectively (Somers, 1986Somers, K.M. 1986. Multivariate allometry and removal of size with principal components analysis. Systematic Biology 35: 359-368.). Within the PCA, if factor loadings were above 0.55, they were considered significant, since the number of observations was 47 (see also Mehmood et al., 2014Mehmood, A.; Jaskani, M.J.; Khan, I.A.; Ahmad, S.; Ahmad, R.; Luo, S.; Ahmad, N.M. 2014. Genetic diversity of Pakistani guava (Psidium guajava L.) germplasm and its implications for conservation and breeding. Scientia Horticulturae 172: 221-232.). The three most important principle components were used to construct 2D plots for each case to enable visualization of the results. In the correlation analysis, the Spearman coefficient (non-parametric) was used to assess the correlation between qualitative traits. The dendrogam was constructed using the qualitative trait data. The Euclidean distance was chosen to estimate the genetic dissimilarity component and the Ward’s method was used for the agglomerative hierarchical clustering (AHC).
The data on microsatellite markers were used to assess the effective number of alleles (Ne), number of alleles (Na), and expected heterozygosity (He) using POPGEN v.1.32 (Krawczak et al., 2006). PowerMarker 3.25 was used to estimate the Nei’s genetic diversity and polymorphism information content (PIC) (Liu and Muse, 2005). The power of discrimination (PD), which estimates the probability that two randomly sampled individuals are discriminated, was evaluated for each locus according to Kloosterman et al. (1993)Kloosterman, A.D.; Budowle, B.; Daselaar, P. 1993. PCR-amplification and detection of the human D1S80 VNTR locus. International Journal of Legal Medicine 105: 257-264.: PD= 1–Σ(pi)2 where Pi is the frequency of the ith genotype. The probability of identity (PI = 1−∑ pi4+∑∑(2pipj), where pi and pj are the frequency of the ith and jth alleles, respectively, calculates the probability that two randomly drawn diploid genotypes are identical assuming observed allele frequencies and random assortment (Paetkau et al., 1995Paetkau, D.; Calvert, W.; Stirling, I.; Strobeck, C. 1995. Microsatellite analysis of population structure in Canadian polar bears. Molecular Ecology 4: 347-354.). The total probability of identity, defined as the likelihood of two varieties sharing the same genetic profile by chance, was also calculated from the individual PI values. PI was calculated by IDENTITY 1.0. The UPGMA algorithm was used for dendrogram construction based on similarities between genotypes that were calculated by the Dice’s coefficient (Nei and Li, 1979Nei, M.; Li, W.-H. 1979. Mathematical model for studying genetic variation in terms of restriction endonucleases. Proceedings of the National Academy of Sciences 76: 5269-5273.). GENALEX version 6.501 was used for the Principal Coordinate Analysis (PCoA) (Peakall and Smouse, 2012Peakall, R.; Smouse, P.E. 2012. GenAlEx 6.5: genetic analysis in Excel: population genetic software for teaching and research – an update. Bioinformatics 28: 2537-2539.). The analysis was performed in a multidimensional space with data standardization. The Mantel test was performed using GENALEX version 6.501 to identify possible statistical significant correlations between morphological and genetic distances (Peakall and Smouse, 2012Peakall, R.; Smouse, P.E. 2012. GenAlEx 6.5: genetic analysis in Excel: population genetic software for teaching and research – an update. Bioinformatics 28: 2537-2539.).
Results and Discussion
Phenotypic traits of the cultivars
The most important qualitative traits are shown in Table 1. Morphological diversity was observed based on the qualitative trait shape as defined by UPOV. The fruit shape was predominantly conical (‘Forlady’, ‘Ozark Gold’, ‘Scarlet Spur’, and ‘Super Chief’), although other shapes were observed, such as ellipsoid (‘FuJi Zhen Aztec’, ‘FuJi Kiku 8’) and globose (‘Delicious’ and ‘Mutsu’). The main over color observed was orange (‘Gala Buckeye’, ‘Gala’, ‘Brookfield’, ‘Gold Chief’, ‘Golden Reinders’, ‘Golden Delicious’, ‘Granny Smith’, ‘Mutsu’, ‘Mirto’, ‘Ozark Gold’ and ‘Florina’). Two cultivars had hue of over color: ‘FuJi Kiku 8’ was pink and ‘Delicious’ was brown.
Correlation of qualitative traits
All 47 qualitative traits analyzed in this study showed a strong positive linear correlation (data not shown). The most significant positive correlation was between length of stalk and flower size (0.918). In addition, we observed a significant positive correlation between leaf blade length and attitude in relation to shoot (0.805), stalk length and leaf blade width (0.765), eye size and pubescence (0.718), eye aperture and pubescence (0.716) and maturity time for consumption and flesh firmness (0.710). However, significantly high negative correlations between some qualitative traits were observed, including the leaf blade: ratio length/ width and fruit: height/ width ratio (–0.858) as well as fruit ground color and russet amount on cheeks (–0.614). These traits, which showed moderate to high correlations, could be a guide to breeding programs and these germplasm sets could be used to improve certain traits and design efficient breeding programs. Trait correlations are very useful, as breeders could use them to ameliorate simultaneously correlated traits by reducing undesired side effects when the focus is only on one of the correlated traits (Chen and Lübberstedt, 2010Chen, Y.; Lübberstedt, T. 2010. Molecular basis of trait correlations. Trends in Plant Science 15: 454-461.).
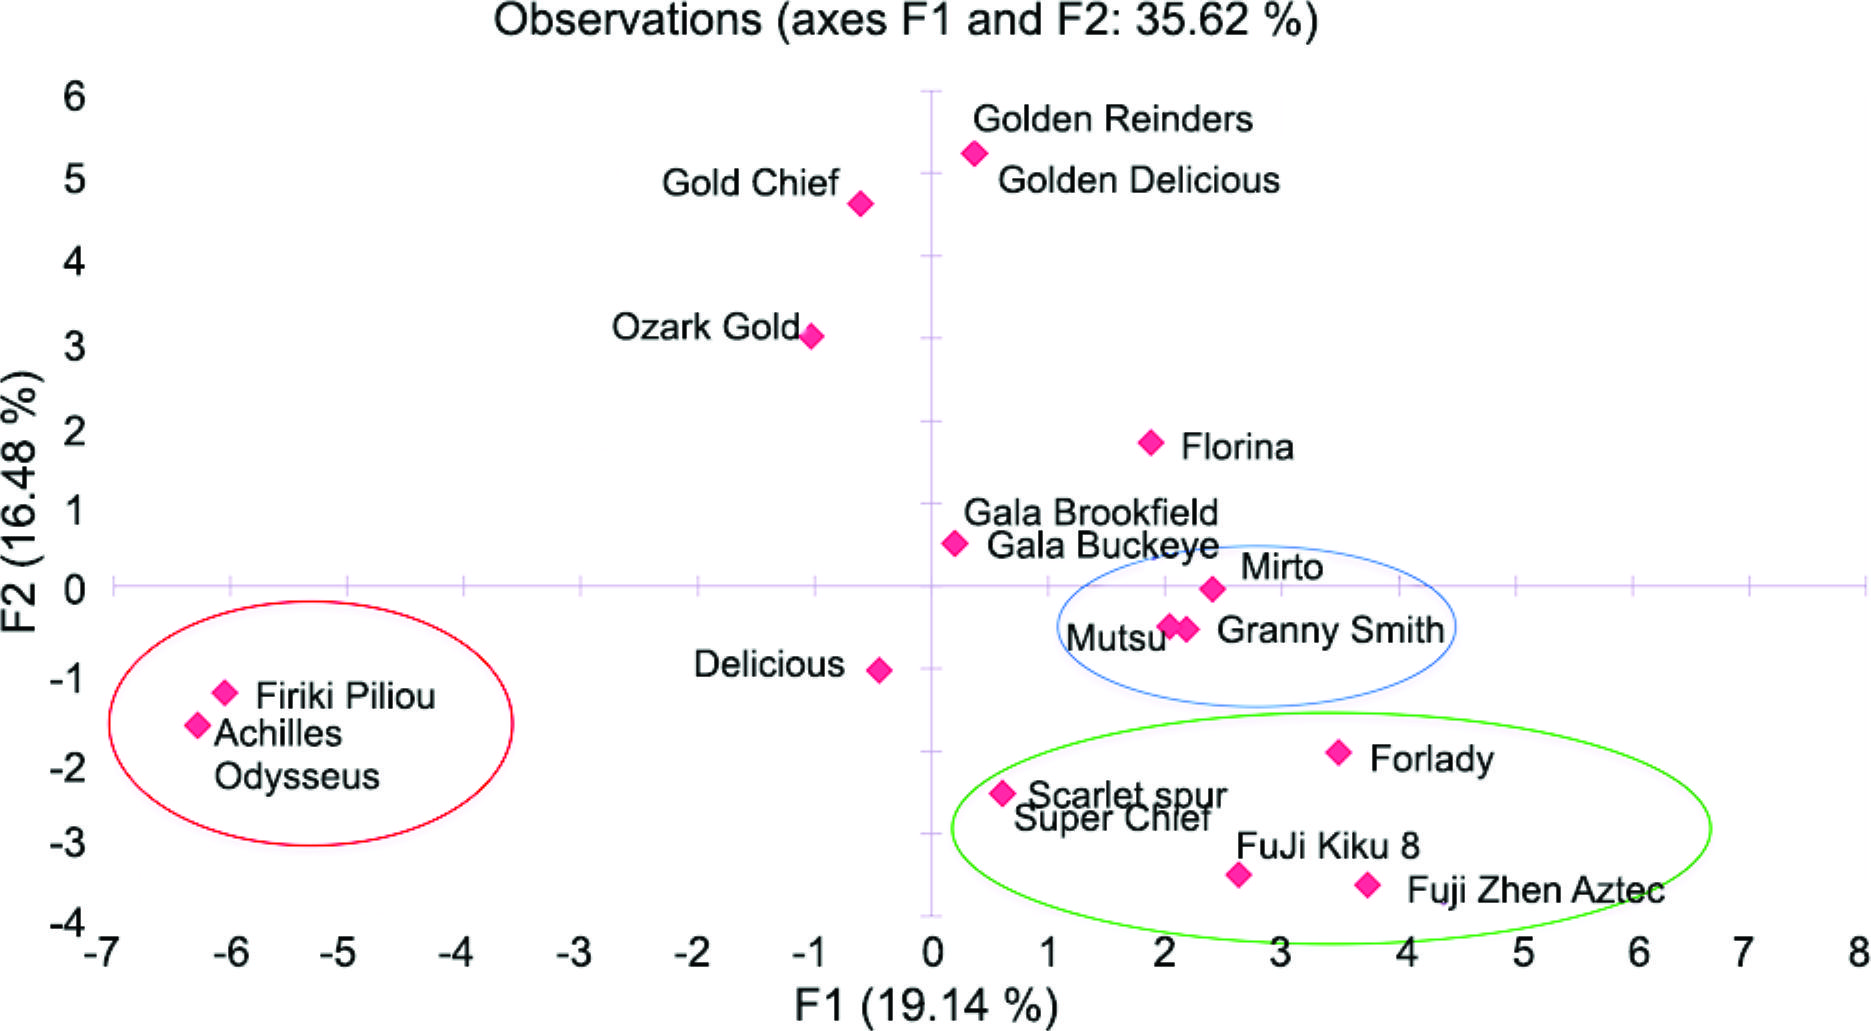
Multivariate analysis of qualitative variables: PCA and AHC cluster analyses
The most important traits that were included in our developed database were identified by the PCA analysis, which, in this case, allows the multivariate statistical analysis of a large number of variables (Ganopoulos et al., 2015Ganopoulos, I.; Moysiadis, T.; Xanthopoulou, A.; Ganopoulou, M.; Avramidou, E.; Aravanopoulos, F.A.; Tani, E.; Madesis, P.; Tsaftaris, A.; Kazantzis, K. 2015. Diversity of morpho-physiological traits in worldwide sweet cherry cultivars of GeneBank collection using multivariate analysis. Scientia Horticulturae 197: 381-391.; Ganopoulos et al., 2011Ganopoulos, I.V.; Kazantzis, K.; Chatzicharisis, I.; Karayiannis, I.; Tsaftaris, A.S. 2011. Genetic diversity, structure and fruit trait associations in Greek sweet cherry cultivars using microsatellite based (SSR/ISSR) and morpho-physiological markers. Euphytica 181: 237-251.). The initial variables were transformed to a decreased number of uncorrelated ones in order to reduce the data, allowing relationships between the individuals and variables to be sufficiently revealed. The distribution of cultivars upon PC-1 and PC-2 reveals the phenotypic variation between the tested cultivars, showing the magnitude of their dispersion along both axes (Figure 1). Using the Kaiser’s criterion (“Eigenvalue” > 1) (Kaiser, 1958Kaiser, H.F. 1958. The varimax criterion for analytic rotation in factor analysis. Psychometrika 23: 187-200.), seven significant components were obtained, which explained 85.56 % of the total variation (Table 2). Eigenvalues measure the amount of variation in the total sample accounted for by each factor. The first component, which accounted for 19.14 % of the total variation, includes the traits of locules departure, thickness of dormant one-year-old shoot and fruit flesh color. The second component, which explained 16.47 % of the total variation, was defined by the russet amount on cheeks, fruit eye size and width of fruit eye basin. The third component, which explained 15.06 % of the total variation, was mainly linked to traits of pattern of fruit skin over color, leaf blade length and length/width ratio of leaf blade. The fourth component accounted for 13.84 % of the total variation, which, in this case, involved fruit skin bloom, fruit skin greasiness and russet amount around the fruit eye basin. The fifth component clarified 8.47 % of the total variation regarding fruit stalk thickness and depth of fruit stalk cavity. The sixth component explained 7.58 % of the total variation and included plant habit and depth of fruit eye basin. Finally, the seventh component explained 4.97 % of the total variation and included intensity of over fruit color and plant type (Table 3).
Two-dimensional PCA plot of the 19 apple cultivars with regard to the first two principal components. Variability explained: F1 (19.14 %) and F2 (16.48 %). The first (F1) and second (F2) PCA axes are based on 47 phenotypic covariates.
First seven components from the PCA analysis of 47 qualitative traits in 19 apple cultivars analyzed.
In order to preserve an efficient germplasm inventory, its efficient characterization, both phenotypically and genetically, is a prerequisite. In turn, germplasm characterization facilitates the identification of important phenotypic traits. These traits are commonly linked to genetic data and their use is crucial for breeding programs (Ganopoulos et al., 2015Ganopoulos, I.; Moysiadis, T.; Xanthopoulou, A.; Ganopoulou, M.; Avramidou, E.; Aravanopoulos, F.A.; Tani, E.; Madesis, P.; Tsaftaris, A.; Kazantzis, K. 2015. Diversity of morpho-physiological traits in worldwide sweet cherry cultivars of GeneBank collection using multivariate analysis. Scientia Horticulturae 197: 381-391.; Ganopoulos et al., 2011Ganopoulos, I.V.; Kazantzis, K.; Chatzicharisis, I.; Karayiannis, I.; Tsaftaris, A.S. 2011. Genetic diversity, structure and fruit trait associations in Greek sweet cherry cultivars using microsatellite based (SSR/ISSR) and morpho-physiological markers. Euphytica 181: 237-251.). Therefore, the clustering analysis and PCA are key tools to group and evaluate cultivars preserved in GeneBank collections (Iezzoni and Pritts, 1991Iezzoni, A.F.; Pritts, M.P. 1991. Applications of principal component analysis to horticultural research. HortScience 26: 334-338.). The multivariate analysis method has been used to study various germplasm collections of Prunus spp. (Ganopoulos et al., 2015Ganopoulos, I.; Moysiadis, T.; Xanthopoulou, A.; Ganopoulou, M.; Avramidou, E.; Aravanopoulos, F.A.; Tani, E.; Madesis, P.; Tsaftaris, A.; Kazantzis, K. 2015. Diversity of morpho-physiological traits in worldwide sweet cherry cultivars of GeneBank collection using multivariate analysis. Scientia Horticulturae 197: 381-391.; Ganopoulos et al., 2016Ganopoulos, I.; Moysiadis, T.; Xanthopoulou, A.; Osathanunkul, M.; Madesis, P.; Zambounis, A.; Avramidou, E.; Aravanopoulos, F.A.; Tsaftaris, A.; Sotiropoulos, T. 2016. Morpho-physiological diversity in the collection of sour cherry (Prunus cerasus) cultivars of the Fruit Genebank in Naoussa, Greece using multivariate analysis. Scientia Horticulturae 207: 225-232.; Font i Forcada et al., 2014Font i Forcada, C.; Gradziel, T.M.; Gogorcena, Y.; Moreno, M.Á. 2014. Phenotypic diversity among local Spanish and foreign peach and nectarine [Prunus persica (L.) Batsch] accessions. Euphytica 197: 261-277.; Khadivi-Khub et al., 2016Khadivi-Khub, A.; Sarooghi, F.; Abbasi, F. 2016. Phenotypic variation of Prunus scoparia germplasm: implications for breeding. Scientia Horticulturae 207: 193-202.; Khadivi-Khub et al., 2012Khadivi-Khub, A.; Zamani, Z.; Fatahi, M.R. 2012. Multivariate analysis of Prunus subgen. Cerasus germplasm in Iran using morphological variables. Genetic Resources and Crop Evolution 59: 909-926.; Nikolić et al., 2010Nikolić, D.; Rakonjac, V.; Milatović, D.; Fotirić, M. 2010. Multivariate analysis of vineyard peach [Prunus persica (L.) Batsch.] germplasm collection. Euphytica 171: 227-234.; Rakonjac et al., 2010Rakonjac, V.; Akšić, M.F.; Nikolić, D.; Milatović, D.; Čolić, S. 2010. Morphological characterization of ‘Oblačinska’sour cherry by multivariate analysis. Scientia Horticulturae 125: 679-684.; Ruiz and Egea, 2008Ruiz, D.; Egea, J. 2008. Phenotypic diversity and relationships of fruit quality traits in apricot (Prunus armeniaca L.) germplasm. Euphytica 163: 143-158.) and Malus × domestica (Gaši et al., 2011Gaši, F.; Šimon, S.; Pojskić, N.; Kurtović, M.; Pejić, I. 2011. Analysis of morphological variability in Bosnia and Herzegovina’s autochthonous apple germplasm. Journal of Food, Agriculture and Environment 9: 444-448.; Pereira-Lorenzo et al., 2003Pereira-Lorenzo, S.; Ramos-Cabrer, A.M.; Ascasíbar-Errasti, J.; Piñeiro-Andión, J. 2003. Analysis of apple germplasm in northwestern Spain. Journal of the American Society for Horticultural Science 128: 67-84.; Reig et al., 2015Reig, G.; Blanco, Á.; Castillo, A.M.; Gogorcena, Y.; Moreno, M.Á. 2015. Phenotypic diversity of Spanish apple (Malus × domestica Borkh) accessions grown at the vulnerable climatic conditions of the Ebro Valley, Spain. Scientia Horticulturae 185: 200-210.). Here, the PCA testing revealed that all variables examined showed high scores regarding the first eight principal components. The phenotypic traits that were the main sources of variability in the first principal component are the aperture of locules, thickness of dormant one-year-old shoot and fruit flesh color. These results are in agreement with Pereira-Lorenzo et al. (2003)Pereira-Lorenzo, S.; Ramos-Cabrer, A.M.; Ascasíbar-Errasti, J.; Piñeiro-Andión, J. 2003. Analysis of apple germplasm in northwestern Spain. Journal of the American Society for Horticultural Science 128: 67-84., who studied local apple cultivars in northwestern Spain; Gaši et al. (2011)Gaši, F.; Šimon, S.; Pojskić, N.; Kurtović, M.; Pejić, I. 2011. Analysis of morphological variability in Bosnia and Herzegovina’s autochthonous apple germplasm. Journal of Food, Agriculture and Environment 9: 444-448., who studied local and foreign apple cultivars in Bosnia-Herzegovina, and Reig et al. (2015)Reig, G.; Blanco, Á.; Castillo, A.M.; Gogorcena, Y.; Moreno, M.Á. 2015. Phenotypic diversity of Spanish apple (Malus × domestica Borkh) accessions grown at the vulnerable climatic conditions of the Ebro Valley, Spain. Scientia Horticulturae 185: 200-210., who studied apple phenotypic diversity in the Germplasm bank of the Ebro Valley area in Spain. Thus, the first seven components explained (85.57 %) of the total variation, which is slightly higher compared with the studies above.
The unsupervised agglomerative hierarchical cluster analysis was used to categorize the data obtained in clusters of increasing dissimilarity. The Euclidean distance using the Ward’s method for agglomeration was inferred as a metric to estimate the dissimilarity among 19 apple cultivars, based on qualitative data. The relative dendrogram revealed four distinct groups (Figure 2). C1 contained six cultivars (‘Gala Buckeye’, ‘Ozark Gold’, ‘Delicious’, ‘Super Chief’, ‘Gala Brookfield’ and ‘Scarlet spur’; C2 had six cultivars (‘Golden Delicious’, ‘Mutsu’, ‘Gold Chief’, ‘Florina’, ‘Forlady’, ‘Golden Reinders’), C3 included four cultivars (‘Granny Smith’, ‘Mirto’, ‘FuJi Kiku 8’ and ‘Fuji Zhen Aztec’) and C4 contained three cultivars of Firiki group (‘Firiki Piliou’, ‘Achilles’ and ‘Odysseus’). The maximum distance between the class centroids was observed between C3 and C4 (12.74), followed by C2 and C4 (12.09), C2 and C3 (8.80) and C1 and C2 (8.34). The dendrogram depicted high diversity between apple cultivars, suggesting that an analyzed germplasm collection could be used in breeding programs as a gene pool carrying important genes for contrasting traits. For example, the cultivars of the Firiki group consisting of ‘Firiki Piliou’, ‘Achilles’ and ‘Odysseus’ were highly diversified from other cultivars. This group is characterized by the following major traits: (1) unopened flower color at the bloom station, (2) leaf blade width, (3) amount of over fruit color, (4) fruit stalk length and (5) thickness of dormant one-year-old shoot. These traits are very important, as they affect both yield and quality of apple fruits and thus are the main traits in breeding programs.
Dendrogram using agglomerative hierarchical clustering (AHC) for 19 apple cultivars based on 47 qualitative traits.
The PCA analysis combined with the unsupervised clustering analysis based on phenotypic and fruit quality traits exposed a wide diversity in apple genetic resources in Greece. In turn, this phenotypic diversity between the apple cultivars is of utmost importance for efficient conservation of traditionally grown plant material.
Molecular characterization using microsatellite markers
The seven microsatellite loci used here amplified 38 alleles (mean 5.42 alleles per locus) showing an average call rate of 99 %. The great level of polymorphism, which was presented by the seven microsatellites, supported their ability to be used in the diversity analysis. Primer pair ch01f02 showed the highest number of alleles (8 alleles), whereas primer pair28f4 had the lowest (3 alleles). The number of alleles per locus ranged from 3 to 8, suggesting moderate molecular genetic diversity between the apple cultivars studied (Ferreira et al., 2016Ferreira, V.; Ramos-Cabrer, A.M.; Carnide, V.; Pinto-Carnide, O.; Assunção, A.; Marreiros, A.; Rodrigues, R.; Pereira-Lorenzo, S.; Castro, I. 2016. Genetic pool structure of local apple cultivars from Portugal assessed by microsatellites. Tree Genetics & Genomes 12: 1-15.).
PIC values ranged from 0.397 for microsatellite locus 28f4 to 0.775 for ch01f02 locus, with an average of 0.644 (Table 4). The highest (0.755) and lowest (0.389) expected heterozygosity (He) values were obtained for ch01f02 and 28f4, respectively, with an average of 0.627. The power of discrimination (PD) showed results from 0.38 (28f4) to 0.86 (ch01f02), with an average of 0.68. Furthermore, the Shannon’s information index (I) maximum (1.620) was recorded for ch01f02, while the lowest value (1.299) was recorded for locus 28f4, with an average of 1.335. Our results revealed a decreased number of alleles per locus than those reported previously for apple (Gharghani et al., 2009Gharghani, A.; Zamani, Z.; Talaie, A.; Oraguzie, N.C.; Fatahi, R.; Hajnajari, H.; Wiedow, C.; Gardiner, S.E. 2009. Genetic identity and relationships of Iranian apple (Malus × domestica Borkh.) cultivars and landraces, wild Malus species and representative old apple cultivars based on simple sequence repeat (SSR) marker analysis. Genetic Resources and Crop Evolution 56: 829-842.; Liang et al., 2015Liang, W.; Dondini, L.; De Franceschi, P.; Paris, R.; Sansavini, S.; Tartarini, S. 2015. Genetic diversity, population structure and construction of a core collection of apple cultivars from Italian germplasm. Plant Molecular Biology Reporter 33: 458-473.; Urrestarazu et al., 2012Urrestarazu, J.; Miranda, C.; Santesteban, L.G.; Royo, J.B. 2012. Genetic diversity and structure of local apple cultivars from Northeastern Spain assessed by microsatellite markers. Tree Genetics & Genomes 8: 1163-1180.), which could be attributed to the smaller number of cultivars tested in our study. Moreover, the diversity level of heterozygosity in our collection (0.627) is slightly lower compared with heterozygosity (0.73) described for apples from the regions of Asturias, the Basque Country, and Galicia in northern and north-western Spain (Pereira-Lorenzo et al., 2003Pereira-Lorenzo, S.; Ramos-Cabrer, A.M.; Ascasíbar-Errasti, J.; Piñeiro-Andión, J. 2003. Analysis of apple germplasm in northwestern Spain. Journal of the American Society for Horticultural Science 128: 67-84.) and 0.75 in Portuguese apple germplasm collections (Ferreira et al., 2016Ferreira, V.; Ramos-Cabrer, A.M.; Carnide, V.; Pinto-Carnide, O.; Assunção, A.; Marreiros, A.; Rodrigues, R.; Pereira-Lorenzo, S.; Castro, I. 2016. Genetic pool structure of local apple cultivars from Portugal assessed by microsatellites. Tree Genetics & Genomes 12: 1-15.). In contrast, the diversity observed here was lower than that observed in local cultivars of northeastern Spain (0.82) (Urrestarazu et al., 2012Urrestarazu, J.; Miranda, C.; Santesteban, L.G.; Royo, J.B. 2012. Genetic diversity and structure of local apple cultivars from Northeastern Spain assessed by microsatellite markers. Tree Genetics & Genomes 8: 1163-1180.) and 0.80 (Pina et al., 2014Pina, A.; Urrestarazu, J.; Errea, P. 2014. Analysis of the genetic diversity of local apple cultivars from mountainous areas from Aragon (northeastern Spain). Scientia Horticulturae 174: 1-9.), Italy (0.80) (Liang et al., 2015Liang, W.; Dondini, L.; De Franceschi, P.; Paris, R.; Sansavini, S.; Tartarini, S. 2015. Genetic diversity, population structure and construction of a core collection of apple cultivars from Italian germplasm. Plant Molecular Biology Reporter 33: 458-473.) and Portuguese Azores Islands, (0.81) (Foroni et al., 2012Foroni, I.; Baptista, C.; Monteiro, L.; Lopes, M.S.; Mendonça, D.; Melo, M.; Carvalho, C.; Monjardino, P.; Lopes, D.J.H.; Câmara Machado, A.C. 2012. The use of microsatellites to analyze relationships and to decipher homonyms and synonyms in Azorean apples (Malus × domestica Borkh.). Plant Systematics and Evolution 298: 1297-1313.). This result indicates a moderate genetic diversity (Hamrick and Godt, 1996Hamrick, J.L.; Godt, M.J.W. 1996. Effects of life history traits on genetic diversity in plant species. Philosophical Transactions of the Royal Society B: Biological Sciences 351: 1291-1298.) between the apple germplasm established in a Greek Pomology Institute collection. Possibly, outcrossing and operation of a self- incompatibility system in apple could result in increased levels of heterozygosity and diversity of the cultivars (Mratinić and Akšić, 2012Mratinić, E.; Akšić, M.F. 2012. Phenotypic diversity of apple (Malus sp.) germplasm in south Serbia. Brazilian Archives of Biology and Technology 55: 349-358.).
The value of the total probability of identity (PI) was low (2 × 10⁻⁷), showing that the seven microsatellites used were powerful enough to discriminate the apple cultivars used. The apple gene pool examined holds significant genetic diversity and demonstrates differentiation between the four genetic clusters identified by the cluster analysis and the PCoA. The results above show that most apple cultivars examined probably have mixed origin and might share common ancestry.
We constructed a dendrogam of genetic similarity based on the SSR profiles by calculating the Dice coefficient in order to confirm the effectiveness of the seven SSRs to distinguish all cultivars. Indeed, Figure 3 shows that two cultivars were not able to be distinguished (cvs. ‘Achilles’ and ‘Odysseus’).
UPGMA tree showing the genetic relationships between the apple cultivars analyzed in this study.
The first two coordinates of the PCoA explained 47.59 % of the total variation in a collection of 19 apple cultivars. The first coordinate explains 26.16 % and the second one explains 21.44 % of the total variation, respectively (Figure 4). The results of the UPGMA method were confirmed by the prediction of unique genotypes on two-dimensional multivariate space. Both the unweighted pair-group method with the arithmetic average dendrograms (UPGMA) and the principal coordinate analysis (PCA) plots showed genetic differentiation between the apple cultivars analyzed.
The Mantel test was used to determine the correlation degree of phenotypic and molecular data. The Mantle tests showed no significant correlation between microsatellite markers with the morphology results. Nonetheless, microsatellite markers were not compatible along the clustering analysis with any of the phenotypic traits, possibly because they are not directly associated with the phenotypic traits analyzed (Kalivas et al., 2016Kalivas, A.; Ganopoulos, I.; Bosmali, I.; Tsaliki, E.; Osathanunkul, M.; Xanthopoulou, A.; Moysiadis, T.; Avramidou, E.; Grigoriadis, I.; Zambounis, A. 2016. Genetic diversity and structure of tobacco in Greece on the basis of morphological and microsatellite markers. Crop Science 56: 2652-2662.). The PCA and the clustering analysis, using various phenotypic data and in combination with molecular data, showed a wide variability in the apple Germplasm Bank from Naoussa, Central Macedonia, Greece. Accurate knowledge of phenotypic and genetic diversity between cultivars is key for the effective use and conservation of traditional material, which faces a high risk of extinction. Moreover, the data could be used not only for protection, but also in patenting processes of new apple cultivars carried out by the EU-Community Plant Variety Office, such of the PDO cultivar ‘Firiki Piliou’. Hence, the cultivars that were comprehensively characterized could be used for gene conservation and for planning an efficient breeding strategy towards favorable apple cultivars with increased adaptation to the Greek climatic conditions and high fruit quality.
References
- Chen, Y.; Lübberstedt, T. 2010. Molecular basis of trait correlations. Trends in Plant Science 15: 454-461.
- Fernández-Fernández, F. 2010. Final Report: GC0140 Fingerprinting the National Apple and Pear Collections. Department for Environment Food & Rural Affairs, London, UK.
- Ferreira, V.; Ramos-Cabrer, A.M.; Carnide, V.; Pinto-Carnide, O.; Assunção, A.; Marreiros, A.; Rodrigues, R.; Pereira-Lorenzo, S.; Castro, I. 2016. Genetic pool structure of local apple cultivars from Portugal assessed by microsatellites. Tree Genetics & Genomes 12: 1-15.
- Font i Forcada, C.; Gradziel, T.M.; Gogorcena, Y.; Moreno, M.Á. 2014. Phenotypic diversity among local Spanish and foreign peach and nectarine [Prunus persica (L.) Batsch] accessions. Euphytica 197: 261-277.
- Food and Agriculture Organization of the United Nations [FAO]. 2015. FAOSTAT: Agriculture Data. FAO, Rome, Italy.
- Foroni, I.; Baptista, C.; Monteiro, L.; Lopes, M.S.; Mendonça, D.; Melo, M.; Carvalho, C.; Monjardino, P.; Lopes, D.J.H.; Câmara Machado, A.C. 2012. The use of microsatellites to analyze relationships and to decipher homonyms and synonyms in Azorean apples (Malus × domestica Borkh.). Plant Systematics and Evolution 298: 1297-1313.
- Furones-Pérez, P.; Fernández-López, J. 2009. Morphological and phenological description of 38 sweet chestnut cultivars (Castanea sativa Miller) in a contemporary collection. Spanish Journal of Agricultural Research 7: 829-843.
- Ganopoulos, I.; Moysiadis, T.; Xanthopoulou, A.; Ganopoulou, M.; Avramidou, E.; Aravanopoulos, F.A.; Tani, E.; Madesis, P.; Tsaftaris, A.; Kazantzis, K. 2015. Diversity of morpho-physiological traits in worldwide sweet cherry cultivars of GeneBank collection using multivariate analysis. Scientia Horticulturae 197: 381-391.
- Ganopoulos, I.; Moysiadis, T.; Xanthopoulou, A.; Osathanunkul, M.; Madesis, P.; Zambounis, A.; Avramidou, E.; Aravanopoulos, F.A.; Tsaftaris, A.; Sotiropoulos, T. 2016. Morpho-physiological diversity in the collection of sour cherry (Prunus cerasus) cultivars of the Fruit Genebank in Naoussa, Greece using multivariate analysis. Scientia Horticulturae 207: 225-232.
- Ganopoulos, I.V.; Kazantzis, K.; Chatzicharisis, I.; Karayiannis, I.; Tsaftaris, A.S. 2011. Genetic diversity, structure and fruit trait associations in Greek sweet cherry cultivars using microsatellite based (SSR/ISSR) and morpho-physiological markers. Euphytica 181: 237-251.
- Garkava-Gustavsson, L.; Mujaju, C.; Sehic, J.; Zborowska, A.; Backes, G.M.; Hietaranta, T.; Antonius, K. 2013. Genetic diversity in Swedish and Finnish heirloom apple cultivars revealed with SSR markers. Scientia Horticulturae 162: 43-48.
- Gaši, F.; Simon, S.; Pojskic, N.; Kurtovic, M.; Pejic, I. 2010. Genetic assessment of apple germplasm in Bosnia and Herzegovina using microsatellite and morphologic markers. Scientia Horticulturae 126: 164-171.
- Gaši, F.; Šimon, S.; Pojskić, N.; Kurtović, M.; Pejić, I. 2011. Analysis of morphological variability in Bosnia and Herzegovina’s autochthonous apple germplasm. Journal of Food, Agriculture and Environment 9: 444-448.
- Gharghani, A.; Zamani, Z.; Talaie, A.; Oraguzie, N.C.; Fatahi, R.; Hajnajari, H.; Wiedow, C.; Gardiner, S.E. 2009. Genetic identity and relationships of Iranian apple (Malus × domestica Borkh.) cultivars and landraces, wild Malus species and representative old apple cultivars based on simple sequence repeat (SSR) marker analysis. Genetic Resources and Crop Evolution 56: 829-842.
- Gupta, P.K.; Balyan, H.S.; Sharma, P.C.; Ramesh, B. 1996. Microsatellites in plants: a new class of molecular markers. Current Science 70: 45-54.
- Hamrick, J.L.; Godt, M.J.W. 1996. Effects of life history traits on genetic diversity in plant species. Philosophical Transactions of the Royal Society B: Biological Sciences 351: 1291-1298.
- Iezzoni, A.F.; Pritts, M.P. 1991. Applications of principal component analysis to horticultural research. HortScience 26: 334-338.
- International Board for Plant Genetic Resources [IBPGR]. 1983. Descriptor List for Apple (Malus). CTA, Wageningen, The Netherlands. (CEC AGPR/IBPGR/82/71, EUR 8354/1).
- International Union for the Protection of New Varieties of Plants [UPOV]. 2005. Guidelines for the conduct of tests for distinctness, uniformity and stability. UPOV, Geneva, Switzerland.
- Kaiser, H.F. 1958. The varimax criterion for analytic rotation in factor analysis. Psychometrika 23: 187-200.
- Kalivas, A.; Ganopoulos, I.; Bosmali, I.; Tsaliki, E.; Osathanunkul, M.; Xanthopoulou, A.; Moysiadis, T.; Avramidou, E.; Grigoriadis, I.; Zambounis, A. 2016. Genetic diversity and structure of tobacco in Greece on the basis of morphological and microsatellite markers. Crop Science 56: 2652-2662.
- Khadivi-Khub, A.; Sarooghi, F.; Abbasi, F. 2016. Phenotypic variation of Prunus scoparia germplasm: implications for breeding. Scientia Horticulturae 207: 193-202.
- Khadivi-Khub, A.; Zamani, Z.; Fatahi, M.R. 2012. Multivariate analysis of Prunus subgen. Cerasus germplasm in Iran using morphological variables. Genetic Resources and Crop Evolution 59: 909-926.
- Kloosterman, A.D.; Budowle, B.; Daselaar, P. 1993. PCR-amplification and detection of the human D1S80 VNTR locus. International Journal of Legal Medicine 105: 257-264.
- Lassois, L.; Denancé, C.; Ravon, E.; Guyader, A.; Guisnel, R.; Hibrand-Saint-Oyant, L.; Poncet, C.; Lasserre-Zuber, P.; Feugey, L.; Durel, C.-E. 2015. Genetic diversity, population structure, parentage analysis, and construction of core collections in the french apple germplasm based on SSR markers. Plant Molecular Biology Reporter: 1-18.
- Liang, W.; Dondini, L.; De Franceschi, P.; Paris, R.; Sansavini, S.; Tartarini, S. 2015. Genetic diversity, population structure and construction of a core collection of apple cultivars from Italian germplasm. Plant Molecular Biology Reporter 33: 458-473.
- Madesis, P.; Ganopoulos, I.; Tsaftaris, A. 2013. Microsatellites: evolution and contribution. Microsatellites: Methods and Protocols: 1-13.
- Mehmood, A.; Jaskani, M.J.; Khan, I.A.; Ahmad, S.; Ahmad, R.; Luo, S.; Ahmad, N.M. 2014. Genetic diversity of Pakistani guava (Psidium guajava L.) germplasm and its implications for conservation and breeding. Scientia Horticulturae 172: 221-232.
- Mratinić, E.; Akšić, M.F. 2012. Phenotypic diversity of apple (Malus sp.) germplasm in south Serbia. Brazilian Archives of Biology and Technology 55: 349-358.
- Nei, M.; Li, W.-H. 1979. Mathematical model for studying genetic variation in terms of restriction endonucleases. Proceedings of the National Academy of Sciences 76: 5269-5273.
- Nikolić, D.; Rakonjac, V.; Milatović, D.; Fotirić, M. 2010. Multivariate analysis of vineyard peach [Prunus persica (L.) Batsch.] germplasm collection. Euphytica 171: 227-234.
- Oliveira, E.J.; Dias, N.L.P.; Dantas, J.L.L. 2012. Selection of morpho-agronomic descriptors for characterization of papaya cultivars. Euphytica 185: 253-265.
- Oraguzie, N.C.; Yamamoto, T.; Soejima, J.; Suzuki, T.; Silva, H. 2005. DNA fingerprinting of apple (Malus spp.) rootstocks using simple sequence repeats. Plant Breeding 124: 197-202.
- Paetkau, D.; Calvert, W.; Stirling, I.; Strobeck, C. 1995. Microsatellite analysis of population structure in Canadian polar bears. Molecular Ecology 4: 347-354.
- Patzak, J.; Paprštein, F.; Henychová, A.; Sedlák, J. 2012. Genetic diversity of Czech apple cultivars inferred from microsatellite markers analysis. Horticultural Science 39: 149-157
- Peakall, R.; Smouse, P.E. 2012. GenAlEx 6.5: genetic analysis in Excel: population genetic software for teaching and research – an update. Bioinformatics 28: 2537-2539.
- Pereira-Lorenzo, S.; Ramos-Cabrer, A.M.; Ascasíbar-Errasti, J.; Piñeiro-Andión, J. 2003. Analysis of apple germplasm in northwestern Spain. Journal of the American Society for Horticultural Science 128: 67-84.
- Pina, A.; Urrestarazu, J.; Errea, P. 2014. Analysis of the genetic diversity of local apple cultivars from mountainous areas from Aragon (northeastern Spain). Scientia Horticulturae 174: 1-9.
- Rakonjac, V.; Akšić, M.F.; Nikolić, D.; Milatović, D.; Čolić, S. 2010. Morphological characterization of ‘Oblačinska’sour cherry by multivariate analysis. Scientia Horticulturae 125: 679-684.
- Reig, G.; Blanco, Á.; Castillo, A.M.; Gogorcena, Y.; Moreno, M.Á. 2015. Phenotypic diversity of Spanish apple (Malus × domestica Borkh) accessions grown at the vulnerable climatic conditions of the Ebro Valley, Spain. Scientia Horticulturae 185: 200-210.
- Ruiz, D.; Egea, J. 2008. Phenotypic diversity and relationships of fruit quality traits in apricot (Prunus armeniaca L.) germplasm. Euphytica 163: 143-158.
- Somers, K.M. 1986. Multivariate allometry and removal of size with principal components analysis. Systematic Biology 35: 359-368.
- Urrestarazu, J.; Miranda, C.; Santesteban, L.G.; Royo, J.B. 2012. Genetic diversity and structure of local apple cultivars from Northeastern Spain assessed by microsatellite markers. Tree Genetics & Genomes 8: 1163-1180.
Edited by
Publication Dates
-
Publication in this collection
Nov-Dec 2018
History
-
Received
20 Dec 2013 -
Accepted
07 Sept 2017