ABSTRACT:
This study aimed to characterize the average seasonal pattern of the vegetation in southern grassland in Brazil, and the variability found in the time series of vegetation indices. It also sought to identify similarities in the seasonal pattern of different grassland typologies. Moderate Resolution Imaging Spectroradiometer (MODIS), Normalized Difference Vegetation Index (NDVI) and Enhanced Vegetation Index (EVI) images from Feb to Dec, 2000 to 2014 were analyzed for ten regions. The grassland typologies studied showed EVI and NDVI profiles consistent with the seasonal dynamics of grassland vegetation under the influence of a subtropical climate, with highest values in the indices during the warm seasons of the year (spring and summer) and lowest in the colder seasons (autumn and winter). Considering the values of EVI and NDVI, grassland typologies were allocated to four groups with similar temporal profiles. Among the groups formed from the EVI index it is possible to identify differences between grassland typologies during the autumn and winter, while the NDVI showed differences only in winter as compared to the other seasons.
Keywords:
MODIS; EVI; NDVI; phenology; grassland vegetation
Introduction
Characterized by the occurrence of repetitive biological events and its relationship to variations in abiotic and biotic environments (Lieth, 1974Lieth, H. 1974. Purpose of a phenology book. p. 3-19. In: Lieth, H., ed. Phenology and seasonality modeling. Springer, Berlin, Germany.; Vanschaik et al., 1993Vanschaik, C.P.; Terborgh, J.W.; Wright, S.J. 1993. The phenology of tropical forests: adaptive significance and consequences for primary consumers. Annual Review of Ecology and Systematics 24: 353-377.), phenology is used as an ecological parameter for monitoring the growing season (seasonal) of plants and reflects the relationship of plant growth to the environment (Zhang et al., 2003Zhang, X.; Friedl, M.A.; Schaaf, C.B.; Strahler, A.H.; Hodges, J.C.F.; Gao, F.; Reed, B.C.; Huete, A. 2003 Monitoring vegetation phenology using MODIS. Remote Sensing of Environment 84: 471-475.). The monitoring of the season, which includes the periods of growth and senescence, can be performed through temporal series of spectral vegetation indices obtained by orbital sensors, such as the EVI (Enhanced Vegetation Index) and the NDVI (Normalized Difference Vegetation Index) MODIS (Huete et al., 2002Huete, A.R.; Didan, K.; Miura, T.; Rodriguez, E.P.; Gao, X.; Ferreira, L.G. 2002. Overview of the radiometric and biophysical performance of the MODIS vegetation indices. Remote Sensing of Environment 83: 195-213.; Zhang et al., 2003Zhang, X.; Friedl, M.A.; Schaaf, C.B.; Strahler, A.H.; Hodges, J.C.F.; Gao, F.; Reed, B.C.; Huete, A. 2003 Monitoring vegetation phenology using MODIS. Remote Sensing of Environment 84: 471-475.; Soudani et al., 2012Soudani, K.; Hmimina, G.; Delpierre, N.; Pontailler, J.Y.; Aubinet, M.; Bonal, D.; Caquet, B.; Grandcourt, A.; Burban, B.; Flechard, C.; Guyon, D.; Granier, A.; Gross, P.; Heinesh, B.; Longdoz, B.; Loustau, D.; Moureaux, C.; Ourcival, J.M.; Rambal, S.; Saint André, L.; Dufrêne, E. 2012. Ground-based network of NDVI measurements for tracking temporal dynamics of canopy structure and vegetation phenology in different biomes. Remote Sensing of Environment 123: 234-245.). The analysis of time series of vegetation indices (VI's) makes it possible to continuously monitor the dynamic processes of various terrestrial ecosystems and their relationships with different components of the geographical environment, such as climate, soil, and topography, on different scales, from regional to global (Tan et al., 2011Tan, B.; Morisette, J.; Wolfe, R.; Esaias, W.; Gao, F.; Ederer, G.; Nightingale, J.; Nickeson, J.E.; Ma, P.; Pedely, J. 2011. Modis vegetation phenology metrics estimated with an enhanced timesat algorithm. IEEE Journal of Selected Topics in Applied Earth Observations and Remote Sensing 4: 361-371.).
Grassland vegetation consists of dominant ecosystems in many countries and it is paramount to preserve water resources and carbon accumulation in the soil. It also serves as fodder source for pastoral activity and offers scenic attractions with major tourism potential, among other environmental services (Pillar et al., 2012Pillar, V.; Boldrini, I.I.; Bencke, G.; Medeiros, R. 2012. Southern grasslands = Campos do sul. p. 200-235. In: Sacarano, F.R.; Santos, I.L.; Martins, A.C.I.; Silva, J.M.C.; Guimarães, A.L.; Mittermeir, R.A., eds. Brazilian biomes: portraits of a plural country = Biomas Brasileiros: retratos de um país plural. Conservação Internacional, Rio de Janeiro, RJ, Brazil (in Portuguese).). In Brazil, about 75 % of the grassland vegetation can be found in the state of Rio Grande do Sul, in the Pampa and Atlantic Forest biomes, known as Southern Grassland. Its conservation rates, however, are very low. It is estimated that 54 % of the original grassland vegetation has been converted to agriculture, forestry, or urbanization, and only 0.33 % of the grasslands are currently protected in conservation units (Overbeck et al., 2007Overbeck, G.E.; Müller, S.C.; Fidelis, A.; Pfadenhauer, J.; Pillar, V.D.; Blanco, C.C.; Boldrini, I.I.; Both, R.; Forneck, E.D. 2007. Brazil's neglected biome: the south Brazilian campos. Perspectives in plant ecology. Evolution and Systematics 9: 101-116.; Overbeck et al., 2013Overbeck, G.E.; Hermann, J.M.; Andrade, B.O.; Boldrini, I.I.; Kiehl, K.; Kirmer, A.; Koch, C.; Kollmann, J.; Meyer, S.T.; Müller, S.C.; Nabinger, C.; Pilger, G.E.; Trindade, J.P.P.; Vélez-Martin, E.; Walker, E.A.; Zimmermann, D.G.; Pillar, V. 2013. Restoration ecology in Brazil: time to step out of the forest. Natureza & Conservação 11: 92-95.).
These data indicate the importance of monitoring the remaining areas, which can be accomplished with the use of spectral vegetation index data. Research studies have already addressed the spatio-temporal dynamic of the southern grassland vegetation and its relationship to climate variability (Scottá and Fonseca, 2015Scottá, F.C.; Fonseca, E.L. 2015. Multiscale trend analysis for pampa grasslands using ground data and vegetation sensor imagery. Sensors 15: 17666-17692.; Junges et al., 2016Junges, A.H.; Bremm, C.; Fontana, D.B.; Oliveira, C.A.O.; Schaparini, L.P.; Carvalho, P.C.F. 2016. Temporal profiles of vegetation indices for characterizing grazing intensity on natural grasslands in Pampa biome. Scientia Agricola 73: 332-337.). However, there is a lack of research aimed at identifying and characterizing patterns of seasonal variation in the southern grasslands of Brazil. Thus, our research aimed to characterize the average seasonal pattern of the vegetation in southern grassland in Brazil, and its variability from time series of vegetation indices. It also sought to identify similarities in the seasonal pattern of different grassland typologies.
Materials and Methods
Study area
The research included ten physiognomic regions with a predominance of grassland vegetation in the state of Rio Grande do Sul (RS), which has a land area of 281,748 square kilometers, located in the extreme south of Brazil, between latitudes 27°05’ and 33°45’ S and longitudes 49°43’ and 57°39’ W with a maximum altitude of around 1400 m.
The grassland typologies of the southern grassland are the result of a combination of geographical factors, such as relief, heterogeneity of soils, distribution of rainfall, and air temperature, which, associated with the floristic variation, made it possible to classify the grassland vegetation into ten homogeneous regions (Figure 1). These regions were selected for sample collection.
Grassland typologies in the study area of the state of Rio Grande do Sul, Southern Brazil; Source: Adapted from Hasenack et al. (2010)Hasenack, H.; Weber, E.; Boldrini, I.I.; Trevisan, R. 2010. Map of Ecological Systems of the Ecoregion of the Uruguayan Savannas on Scale 1:500,000 or Higher and Technical Report Describing Inputs Used and Methodology for Drawing up the Ecological Systems Map = Mapa de Sistemas Ecológicos da Ecorregião das Savanas Uruguaias em Escala 1:500.000 ou Superior e Relatório Técnico Descrevendo Insumos Utilizados e Metodologia de Elaboração do Mapa de Sistemas Ecológicos. Universidade Federal do Rio Grande do Sul, Centro de Ecologia. Porto Alegre, RS, Brazil (in Portuguese)..
The southern grasslands have developed under the influence of temperate climate “C”, humid type “Cf” with the “Cfa” and “Cfb” varieties, subtropical and temperate, respectively, according to the Köppen classification system (Alvares et al., 2013Alvares, C.A.; Stape, J.L.; Sentelhas, P.C.; Gonçalves, J.L.M.; Sparovek, G. Köppen's climate classification map for Brazil. Meteorologische Zeitschrift 22: 711-728.). As regards rainfall, it is evenly distributed throughout the year, without a dry season. Total annual precipitation is 1,455 mm - monthly totals are between 102 mm (Mar) and 154 mm (June). Average monthly temperatures vary from 13 °C (July) to 24 °C (Jan) (Junges et al., 2016Junges, A.H.; Bremm, C.; Fontana, D.B.; Oliveira, C.A.O.; Schaparini, L.P.; Carvalho, P.C.F. 2016. Temporal profiles of vegetation indices for characterizing grazing intensity on natural grasslands in Pampa biome. Scientia Agricola 73: 332-337.).
It is estimated that the floristic composition has around 2,600 species of plants (Overbeck et al., 2007Overbeck, G.E.; Müller, S.C.; Fidelis, A.; Pfadenhauer, J.; Pillar, V.D.; Blanco, C.C.; Boldrini, I.I.; Both, R.; Forneck, E.D. 2007. Brazil's neglected biome: the south Brazilian campos. Perspectives in plant ecology. Evolution and Systematics 9: 101-116.), which presents a diversity of flora and consists of several species of grasses, Asteraceae, Cyperaceae and leguminous plants (Hasenack et al., 2010Hasenack, H.; Weber, E.; Boldrini, I.I.; Trevisan, R. 2010. Map of Ecological Systems of the Ecoregion of the Uruguayan Savannas on Scale 1:500,000 or Higher and Technical Report Describing Inputs Used and Methodology for Drawing up the Ecological Systems Map = Mapa de Sistemas Ecológicos da Ecorregião das Savanas Uruguaias em Escala 1:500.000 ou Superior e Relatório Técnico Descrevendo Insumos Utilizados e Metodologia de Elaboração do Mapa de Sistemas Ecológicos. Universidade Federal do Rio Grande do Sul, Centro de Ecologia. Porto Alegre, RS, Brazil (in Portuguese).) with a high degree of endemism that is due to the influence of both the tropical floras of Central Brazil and the temperate floras from South America (Pillar et al., 2012Pillar, V.; Tornquist, C.G.; Bayer, C. 2012. The southern Brazilian grassland biome: soil carbon stocks, fluxes and greenhouse gases and some options for mitigation. Brazilian Journal of Biology 72: 673-681.). Such characteristics make it possible to find the coexistence of C3 and C4 species in the same southern grassland environment, stressing the importance of conserving this ecosystem (Boldrini et al., 2015Boldrini, I.I.; Overbeck, G.; Trevisan, R. 2015. Biodiversity of plants = Biodiversidade de plantas. p. 51-56. In: Pillar, V.P.; Lange, O., eds. The southern grasslands. Network southern grasslands = Os campos do Sul. Rede Campos Sulinos. Universidade Federal do Rio Grande do Sul, Porto Alegre, RS, Brazil (in Portuguese).).
Seasonal pattern of the grassland vegetation
To assess the seasonal dynamics of the ten grassland typologies, images of maximum value composition were used every 16 days from two spectral indices, the EVI and the NDVI, obtained by MODIS sensor, MOD13Q1 product, 5 collections, with spatial resolution of 250 m. A total of 342 images were collected from Feb 2000 to Dec 2014. The EVI and NDVI values were obtained from 20 sample polygons for each grassland vegetation typology in RS. With the aim of characterizing the grassland vegetation for each typology, the sample areas represented by polygons were collected based on a classification mask of use and land cover (Hasenack et al., 2010Hasenack, H.; Weber, E.; Boldrini, I.I.; Trevisan, R. 2010. Map of Ecological Systems of the Ecoregion of the Uruguayan Savannas on Scale 1:500,000 or Higher and Technical Report Describing Inputs Used and Methodology for Drawing up the Ecological Systems Map = Mapa de Sistemas Ecológicos da Ecorregião das Savanas Uruguaias em Escala 1:500.000 ou Superior e Relatório Técnico Descrevendo Insumos Utilizados e Metodologia de Elaboração do Mapa de Sistemas Ecológicos. Universidade Federal do Rio Grande do Sul, Centro de Ecologia. Porto Alegre, RS, Brazil (in Portuguese).), considering only the grassland class with a minimum area of 1 km2. Following these requirements, the distribution of the polygons used sought to cover the entire perimeter of the typology and to avoid concentrating sample collection. Because the definition of the sample polygons were based on a classification mask of use and land cover elaborated from Landsat images, with 30 m spatial resolution, and considering only the grassland class, it was possible to exert greater control so that the samples had no influence from other types of cover.
The average value extracted from the 20 polygons was attributed to each of the ten typologies (Figure 1). The number of pixels considered for each typology ranged between 2462-4284 pixels. This number proved to be sufficient for the preparation of the analysis, and the sample adequacy was assessed by the bootstrap method (Efron, 1979Efron, B. 1979. Bootstrap methods: another look at the Jackknife. The Annals of Statistics 7: 1-26.), considering 1,000 iterations and a 5 % level of significance (p ≤ 0.05), which was determined to be a minimum of 1,500 pixels per typology.
The Savitzky-Golay filter, from the TIMESAT program (Jönsson and Eklundh, 2004Jönsson, P.; Eklundh, L. 2004. TIMESAT: a program for analyzing time-series of satellite sensor data. Computers and Geosciences 30: 833-845.), was used to smooth the noise mainly caused by clouds, atmospheric variability and/or angular variations (Chen et al., 2004Chen, J.; Jönsson, P.; Tamura, M.; Gu, Z.; Matsushita, B.; Eklundh, L. 2004. A simple method for reconstructing a high-quality NDVI time-series data set based on the Savitzky-Golay filter. Remote Sensing of Environment 91: 332-344.) present in the time series of EVI and NDVI/MODIS images.
To characterize the seasonal variation of the vegetation, four polynomial models (linear, quadratic, cubic and quartic) between the average values of EVI and NDVI of grassland typologies and the days of the year were tested. The years 2000-2014 were used as a measure of variability for adjustment of the models. Significant models with a 5 % level of significance were compared by statistical criteria (R2, Bias-corrected Akaike Information Criterion (AICc) and Bayesian Information Criterion (BIC)) for selecting the best model adjusted for each grassland typology. Analyses were carried out using the SAS statistical software (v. 9.4).
Ward's method (Ward Jr., 1963Ward Jr., J.H. 1963. Hierarchical grouping to optimize an objective function. Journal of the American Statistical Association 58: 236-244.) was applied to the cluster analysis to verify the similarities between the 10 grassland typologies and the seasonal patterns of EVI and NDVI and then characterize them in homogeneous groups. The statistical program JMP (v. 12) was used for the Cluster analysis.
Finally, the data of EVI and NDVI of the groups formed for the grassland typologies were subjected to analysis of variance at the 5 % level of significance, to compare the temporal dynamics of the grassland vegetation between seasons of the year. The group of effects, the season and their interaction were included in the model. The averages were compared by Tukey's test (p ≤ 0.05). For this analysis, the statistical program JMP (v. 12) was used.
Results and Discussion
The analysis of the seasonal average variation of EVI and NDVI of the ten grassland typologies showed two distinct patterns (Figures 2 and 3), namely: (A) increases in EVI and NDVI values during the warm seasons (spring and summer) and decreases in colder seasons (autumn and winter), (B) increases in values during the warm seasons (spring and summer), but decreased values of EVI and NDVI for late spring and early summer.
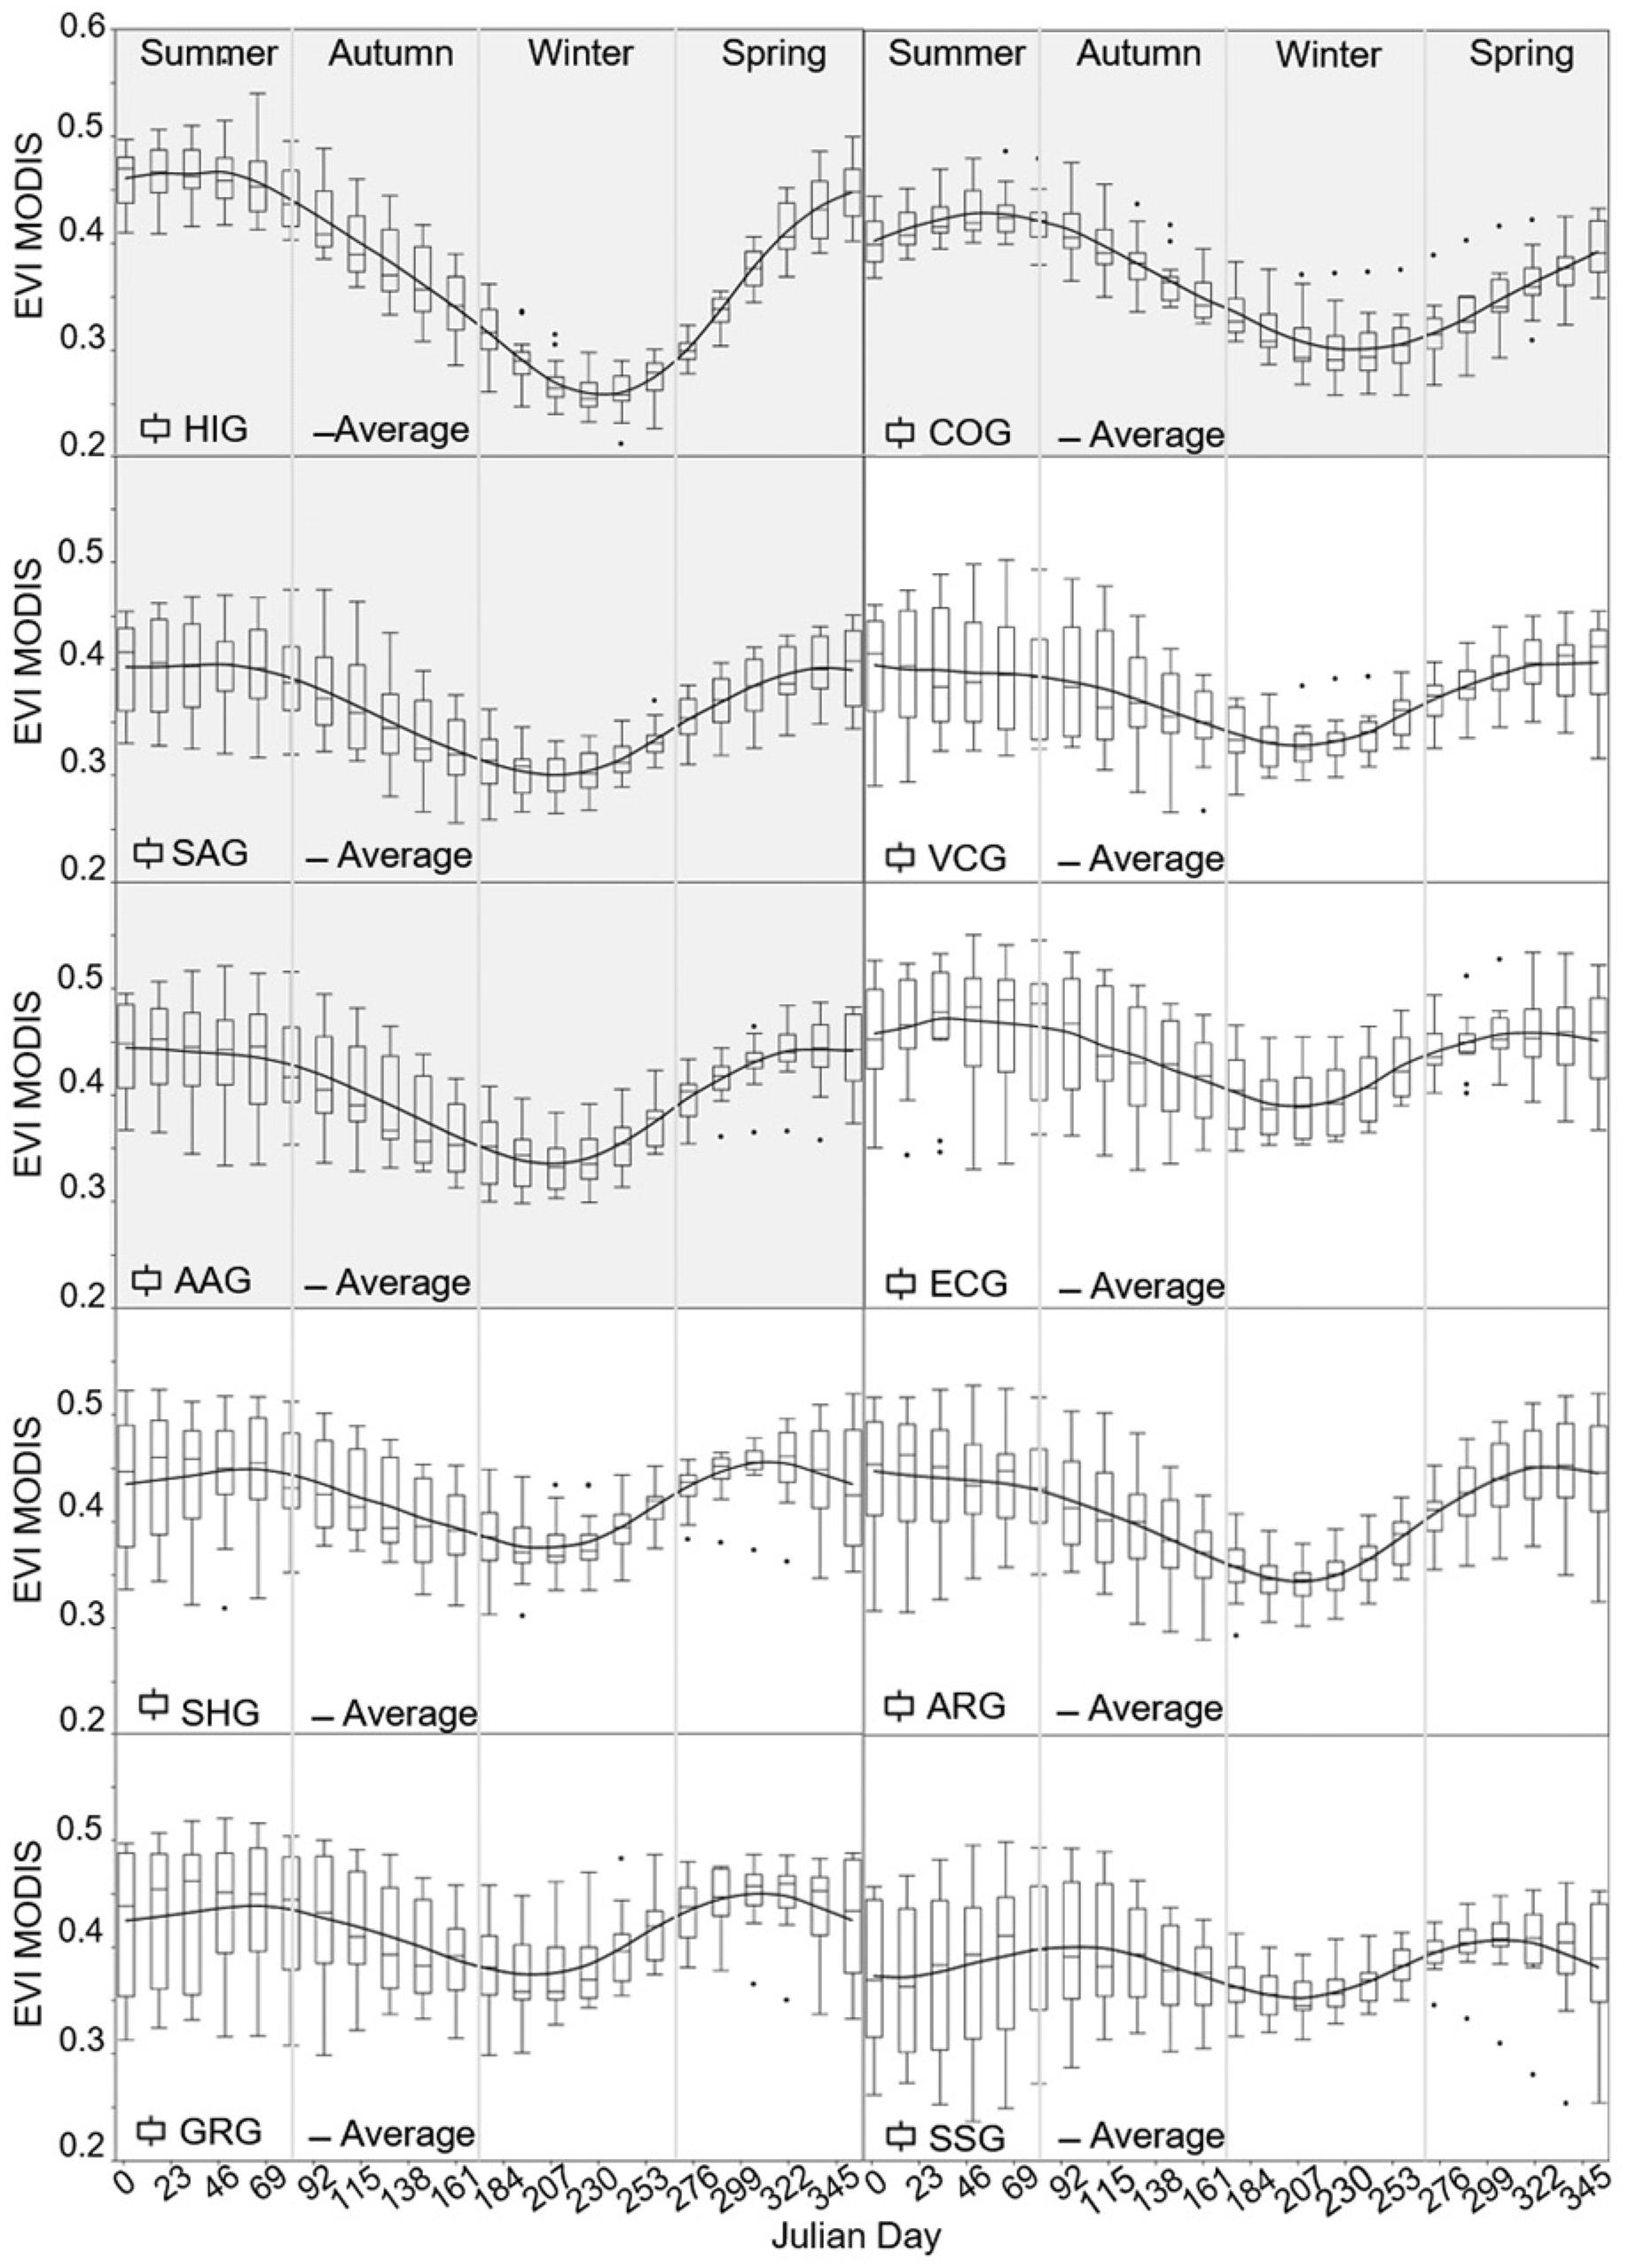
Average values of EVI/MODIS of grassland typologies in RS (Phenological pattern A - color gray: Highland grasslands (HIG), Coastal grasslands (COG), Sandy grasslands (SAG), Andropogonean and Asteraceae mixed grasslands (AAG). Phenological pattern B: Vachellia caven grasslands (VCG), Eastern crystaline mixed grasslands (ECG), Shrubby grasslands (SHG), Aristida spp. grasslands (ARG), Grassy grasslands (GRG) and Shallow soils grasslands (SSG)) for the 2000-2014 period.
Average values of NDVI/MODIS of grassland typologies in RS (Phenological pattern A - color gray: Highland grasslands (HIG), Coastal grasslands (COG), Sandy grasslands (SAG), Andropogonean and Asteraceae mixed grasslands (AAG). Phenological pattern B: Vachellia caven grasslands (VCG), Eastern crystaline mixed grasslands (ECG), Shrubby grasslands (SHG), Aristida spp. grasslands (ARG), Grassy grasslands (GRG) and Shallow soils grasslands (SSG)) for the 2000-2014 period.
For the grassland typologies, highland grasslands (HIG), coastal grasslands (COG), sandy grasslands (SAG) and Andropogonean and Asteraceae mixed grasslands (AAG) seasonal pattern (A) was observed, with an increase in values during the warm seasons of the year (spring and summer) and decrease in colder seasons (autumn and winter). From these grassland typologies, the characteristic temporal profile of the HIG typology stands out, where the grasslands are developed on basaltic soils, interspersed with forests, especially the Forest of Araucaria (Araucaria Angustifolia) and peat bogs (Overbeck et al., 2015Overbeck, G.E.; Boldrini, I.I.; Carmo, M.R.B.; Garcia, E.N.; Moro, R.S.; Pinto, C.E.; Trevisan, R.; Zannin, A. 2015. Grasslands physiognomy = Fisionomia dos campos. p. 31-39. In: Pillar, V.P.; Lange, O., eds. The southern grasslands. Network southern grasslands = Os campos do sul. Rede campos sulinos. Universidade Federal do Rio Grande do Sul, Porto Alegre, RS, Brazil (in Portuguese).). Plants that grow forming clumps are predominant in these grasslands, with a dominance of standing tussock species and summer cycle, which further demonstrates development during the spring and summer. In autumn and winter, low temperatures reduce grassland growth and infer on the grassland a yellowish tinge, which is the consequence of frequent winter frosts (Pillar et al., 2012Pillar, V.; Boldrini, I.I.; Bencke, G.; Medeiros, R. 2012. Southern grasslands = Campos do sul. p. 200-235. In: Sacarano, F.R.; Santos, I.L.; Martins, A.C.I.; Silva, J.M.C.; Guimarães, A.L.; Mittermeir, R.A., eds. Brazilian biomes: portraits of a plural country = Biomas Brasileiros: retratos de um país plural. Conservação Internacional, Rio de Janeiro, RJ, Brazil (in Portuguese).; Boldrini et al., 2015Boldrini, I.I.; Overbeck, G.; Trevisan, R. 2015. Biodiversity of plants = Biodiversidade de plantas. p. 51-56. In: Pillar, V.P.; Lange, O., eds. The southern grasslands. Network southern grasslands = Os campos do Sul. Rede Campos Sulinos. Universidade Federal do Rio Grande do Sul, Porto Alegre, RS, Brazil (in Portuguese).). In this season, the lowest values of EVI and NDVI were observed for the HIG typology, which also requires more time to resume the increase in the values of vegetation indices from the spring.
The coastal grasslands (COG) have a standard similar to the lime, but with EVI and NDVI values that denote less seasonal variation. These grasslands are developed on sandy soils, mostly with low water retention. The vegetation near the coast consists mostly of prostrate, rhizomatous or stoloniferous species. Toward the mainland, where there is an accumulation of organic matter in the soil and better drainage, it is also possible to find leguminous plants (Pillar et al., 2012Pillar, V.; Boldrini, I.I.; Bencke, G.; Medeiros, R. 2012. Southern grasslands = Campos do sul. p. 200-235. In: Sacarano, F.R.; Santos, I.L.; Martins, A.C.I.; Silva, J.M.C.; Guimarães, A.L.; Mittermeir, R.A., eds. Brazilian biomes: portraits of a plural country = Biomas Brasileiros: retratos de um país plural. Conservação Internacional, Rio de Janeiro, RJ, Brazil (in Portuguese).; Overbeck et al., 2015Overbeck, G.E.; Boldrini, I.I.; Carmo, M.R.B.; Garcia, E.N.; Moro, R.S.; Pinto, C.E.; Trevisan, R.; Zannin, A. 2015. Grasslands physiognomy = Fisionomia dos campos. p. 31-39. In: Pillar, V.P.; Lange, O., eds. The southern grasslands. Network southern grasslands = Os campos do sul. Rede campos sulinos. Universidade Federal do Rio Grande do Sul, Porto Alegre, RS, Brazil (in Portuguese).).
The grassland typologies with pattern (A) showed less variability in index values (visible in the smaller boxplots). The greater variability occurred in the late spring, during the summer and autumn, and especially for the SAG and AAG typologies. The SAG, located in the central-western portion of RS, develops on sandy soils subject to erosion and the formation of sandbanks (Overbeck et al., 2015Overbeck, G.E.; Boldrini, I.I.; Carmo, M.R.B.; Garcia, E.N.; Moro, R.S.; Pinto, C.E.; Trevisan, R.; Zannin, A. 2015. Grasslands physiognomy = Fisionomia dos campos. p. 31-39. In: Pillar, V.P.; Lange, O., eds. The southern grasslands. Network southern grasslands = Os campos do sul. Rede campos sulinos. Universidade Federal do Rio Grande do Sul, Porto Alegre, RS, Brazil (in Portuguese).). When the vegetation is removed by erosion caused by water or wind, sandbanks are formed. Thus, the vegetation that develops on this substrate is important for both setting the sandy soil and an underground structure also capable of withstanding water stress, which occurs mainly during the summer (Pillar et al., 2012Pillar, V.; Boldrini, I.I.; Bencke, G.; Medeiros, R. 2012. Southern grasslands = Campos do sul. p. 200-235. In: Sacarano, F.R.; Santos, I.L.; Martins, A.C.I.; Silva, J.M.C.; Guimarães, A.L.; Mittermeir, R.A., eds. Brazilian biomes: portraits of a plural country = Biomas Brasileiros: retratos de um país plural. Conservação Internacional, Rio de Janeiro, RJ, Brazil (in Portuguese).). In general, the vegetation cover is low, with a prevalence of grasses with rhizomes and there is a high diversity of Asteraceae species (Overbeck et al., 2015Overbeck, G.E.; Boldrini, I.I.; Carmo, M.R.B.; Garcia, E.N.; Moro, R.S.; Pinto, C.E.; Trevisan, R.; Zannin, A. 2015. Grasslands physiognomy = Fisionomia dos campos. p. 31-39. In: Pillar, V.P.; Lange, O., eds. The southern grasslands. Network southern grasslands = Os campos do sul. Rede campos sulinos. Universidade Federal do Rio Grande do Sul, Porto Alegre, RS, Brazil (in Portuguese).).
On the other hand, the AAG typology, located in the center of RS, develops on different types of soil and vegetation and is characterized by the presence of two layers, the lower, dominated by rhizomatous grasses, and the upper, composed of clumps of tussock grass (Overbeck et al., 2015Overbeck, G.E.; Boldrini, I.I.; Carmo, M.R.B.; Garcia, E.N.; Moro, R.S.; Pinto, C.E.; Trevisan, R.; Zannin, A. 2015. Grasslands physiognomy = Fisionomia dos campos. p. 31-39. In: Pillar, V.P.; Lange, O., eds. The southern grasslands. Network southern grasslands = Os campos do sul. Rede campos sulinos. Universidade Federal do Rio Grande do Sul, Porto Alegre, RS, Brazil (in Portuguese).). Thus, the high variability in the EVI and NDVI values during the summer, observed in the SAG and AAG typologies are possibly associated with floristic characteristics of the vegetation that need to adapt to both the occurrence of water stress and the high temperatures during this season.
The other grassland typologies, shrubby grasslands (SHG), Aristida spp. grasslands (ARG), Vachellia caven grasslands (VCG), grassy grasslands (GRG), Eastern crystaline mixed grasslands (ECG) and shallow soils grasslands (SSG) are prevalent in a region called Pampa and demonstrate seasonal pattern (B), with increases in values during the warm seasons (spring and summer), but with a slight decrease in the EVI and NDVI values during the late spring and early summer (Figure 2 and 3). The greatest variability was observed also in this period and extended until the autumn. This can be associated with the floristic and soil characteristics that predominate in the south, southwest and northwest parts of the state. The grassland typologies are formed by different floristic compositions, mainly influenced by geomorphological and climate characteristics, associated with land use and management (Overbeck et al., 2015Overbeck, G.E.; Boldrini, I.I.; Carmo, M.R.B.; Garcia, E.N.; Moro, R.S.; Pinto, C.E.; Trevisan, R.; Zannin, A. 2015. Grasslands physiognomy = Fisionomia dos campos. p. 31-39. In: Pillar, V.P.; Lange, O., eds. The southern grasslands. Network southern grasslands = Os campos do sul. Rede campos sulinos. Universidade Federal do Rio Grande do Sul, Porto Alegre, RS, Brazil (in Portuguese).).
In the southern half of RS, in the Pampas region, the grasslands are developed on two types of soil: shallow and deep. The shallow soils, found mainly in the west and southwest of the state, are formed from volcanic rocks and the grassland vegetation is often subjected to water deficit during summer. The ARG, VCG and SSG typologies predominate in this region, where it is possible to find many endemic grasses that are characteristically erect, which leaves much soil and rock exposed. Due to the ground conditions, the native vegetation has experienced little transformation for other uses (Pillar et al., 2012Pillar, V.; Boldrini, I.I.; Bencke, G.; Medeiros, R. 2012. Southern grasslands = Campos do sul. p. 200-235. In: Sacarano, F.R.; Santos, I.L.; Martins, A.C.I.; Silva, J.M.C.; Guimarães, A.L.; Mittermeir, R.A., eds. Brazilian biomes: portraits of a plural country = Biomas Brasileiros: retratos de um país plural. Conservação Internacional, Rio de Janeiro, RJ, Brazil (in Portuguese).).
In the southeastern part of RS, the deep and fertile soils are predominant. Due to this fact, part of the original grassland vegetation is being converted into soybean, corn and rice crop areas. Thus, the remaining grassland vegetation, characterized by the SHG, ECG and GRG typologies, mainly develops on shallow and stony soils. In this region, as a result of low temperatures in winter, there is a high presence of hibernate grasses (Overbeck et al., 2015Overbeck, G.E.; Boldrini, I.I.; Carmo, M.R.B.; Garcia, E.N.; Moro, R.S.; Pinto, C.E.; Trevisan, R.; Zannin, A. 2015. Grasslands physiognomy = Fisionomia dos campos. p. 31-39. In: Pillar, V.P.; Lange, O., eds. The southern grasslands. Network southern grasslands = Os campos do sul. Rede campos sulinos. Universidade Federal do Rio Grande do Sul, Porto Alegre, RS, Brazil (in Portuguese).). Erect tussock species are common, while leguminous and shrubby vegetation are found next to the roads. The region also has many endemic cacti (Boldrini et al., 2015Boldrini, I.I.; Overbeck, G.; Trevisan, R. 2015. Biodiversity of plants = Biodiversidade de plantas. p. 51-56. In: Pillar, V.P.; Lange, O., eds. The southern grasslands. Network southern grasslands = Os campos do Sul. Rede Campos Sulinos. Universidade Federal do Rio Grande do Sul, Porto Alegre, RS, Brazil (in Portuguese).).
Another peculiarity of this region is the joint presence of temperate, subtropical and tropical climate characteristics, as well as C3 and C4 species with different degrees of efficiency in the production of biomass. Due to a predominance of the subtropical climate in the state, there is a greater occurrence of grasses with C3 photosynthetic metabolism, which are most productive during colder seasons, from autumn until early spring (Overbeck et al., 2015Overbeck, G.E.; Boldrini, I.I.; Carmo, M.R.B.; Garcia, E.N.; Moro, R.S.; Pinto, C.E.; Trevisan, R.; Zannin, A. 2015. Grasslands physiognomy = Fisionomia dos campos. p. 31-39. In: Pillar, V.P.; Lange, O., eds. The southern grasslands. Network southern grasslands = Os campos do sul. Rede campos sulinos. Universidade Federal do Rio Grande do Sul, Porto Alegre, RS, Brazil (in Portuguese).; Boldrini et al., 2015Boldrini, I.I.; Overbeck, G.; Trevisan, R. 2015. Biodiversity of plants = Biodiversidade de plantas. p. 51-56. In: Pillar, V.P.; Lange, O., eds. The southern grasslands. Network southern grasslands = Os campos do Sul. Rede Campos Sulinos. Universidade Federal do Rio Grande do Sul, Porto Alegre, RS, Brazil (in Portuguese).).
With the increase in air temperature and greater incidence of solar radiation during the spring and summer, the C4 grasses flourish, changing the appearance of the vegetation and contributing to increases in the values of EVI and NDVI. The diversity of the C3 species likely contributed to the seasonal pattern B in the typology of southeastern Pampa (SHG, ECG and GRG typologies).
In the across east-west of RS, there is also a reduction in the average values of rainfall and increased drought periods in the summer, dominated by species adapted to these conditions (Overbeck et al., 2015Overbeck, G.E.; Boldrini, I.I.; Carmo, M.R.B.; Garcia, E.N.; Moro, R.S.; Pinto, C.E.; Trevisan, R.; Zannin, A. 2015. Grasslands physiognomy = Fisionomia dos campos. p. 31-39. In: Pillar, V.P.; Lange, O., eds. The southern grasslands. Network southern grasslands = Os campos do sul. Rede campos sulinos. Universidade Federal do Rio Grande do Sul, Porto Alegre, RS, Brazil (in Portuguese).). This factor also contributes to reductions in the values of EVI and NDVI observed during the late spring and early summer. Still, the reduction in EVI and NDVI values during the colder seasons (autumn and winter) have lower values than found in the HIG, COG and SAG typologies. This characteristic is determined by the greater capacity of the species that allows the SHG, ARG, VCG, GRG, ECG and SSG typologies to withstand low temperatures and less sunlight during the winter period, which is characteristic of C3 species.
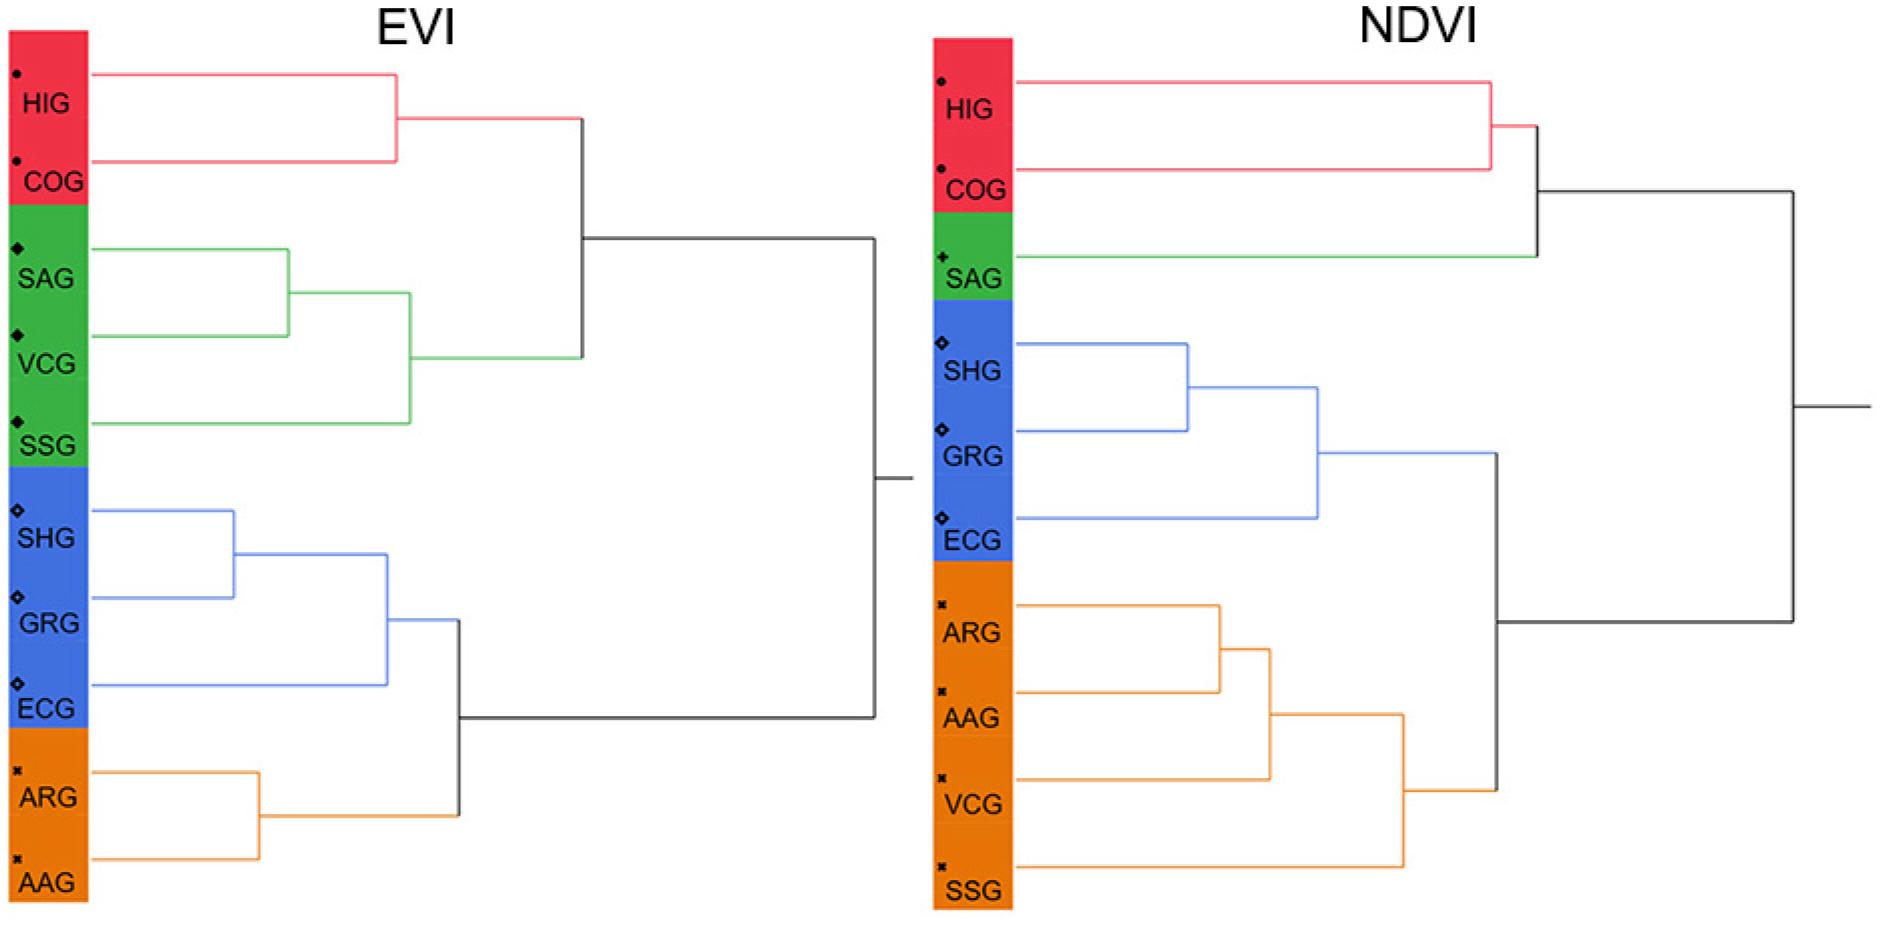
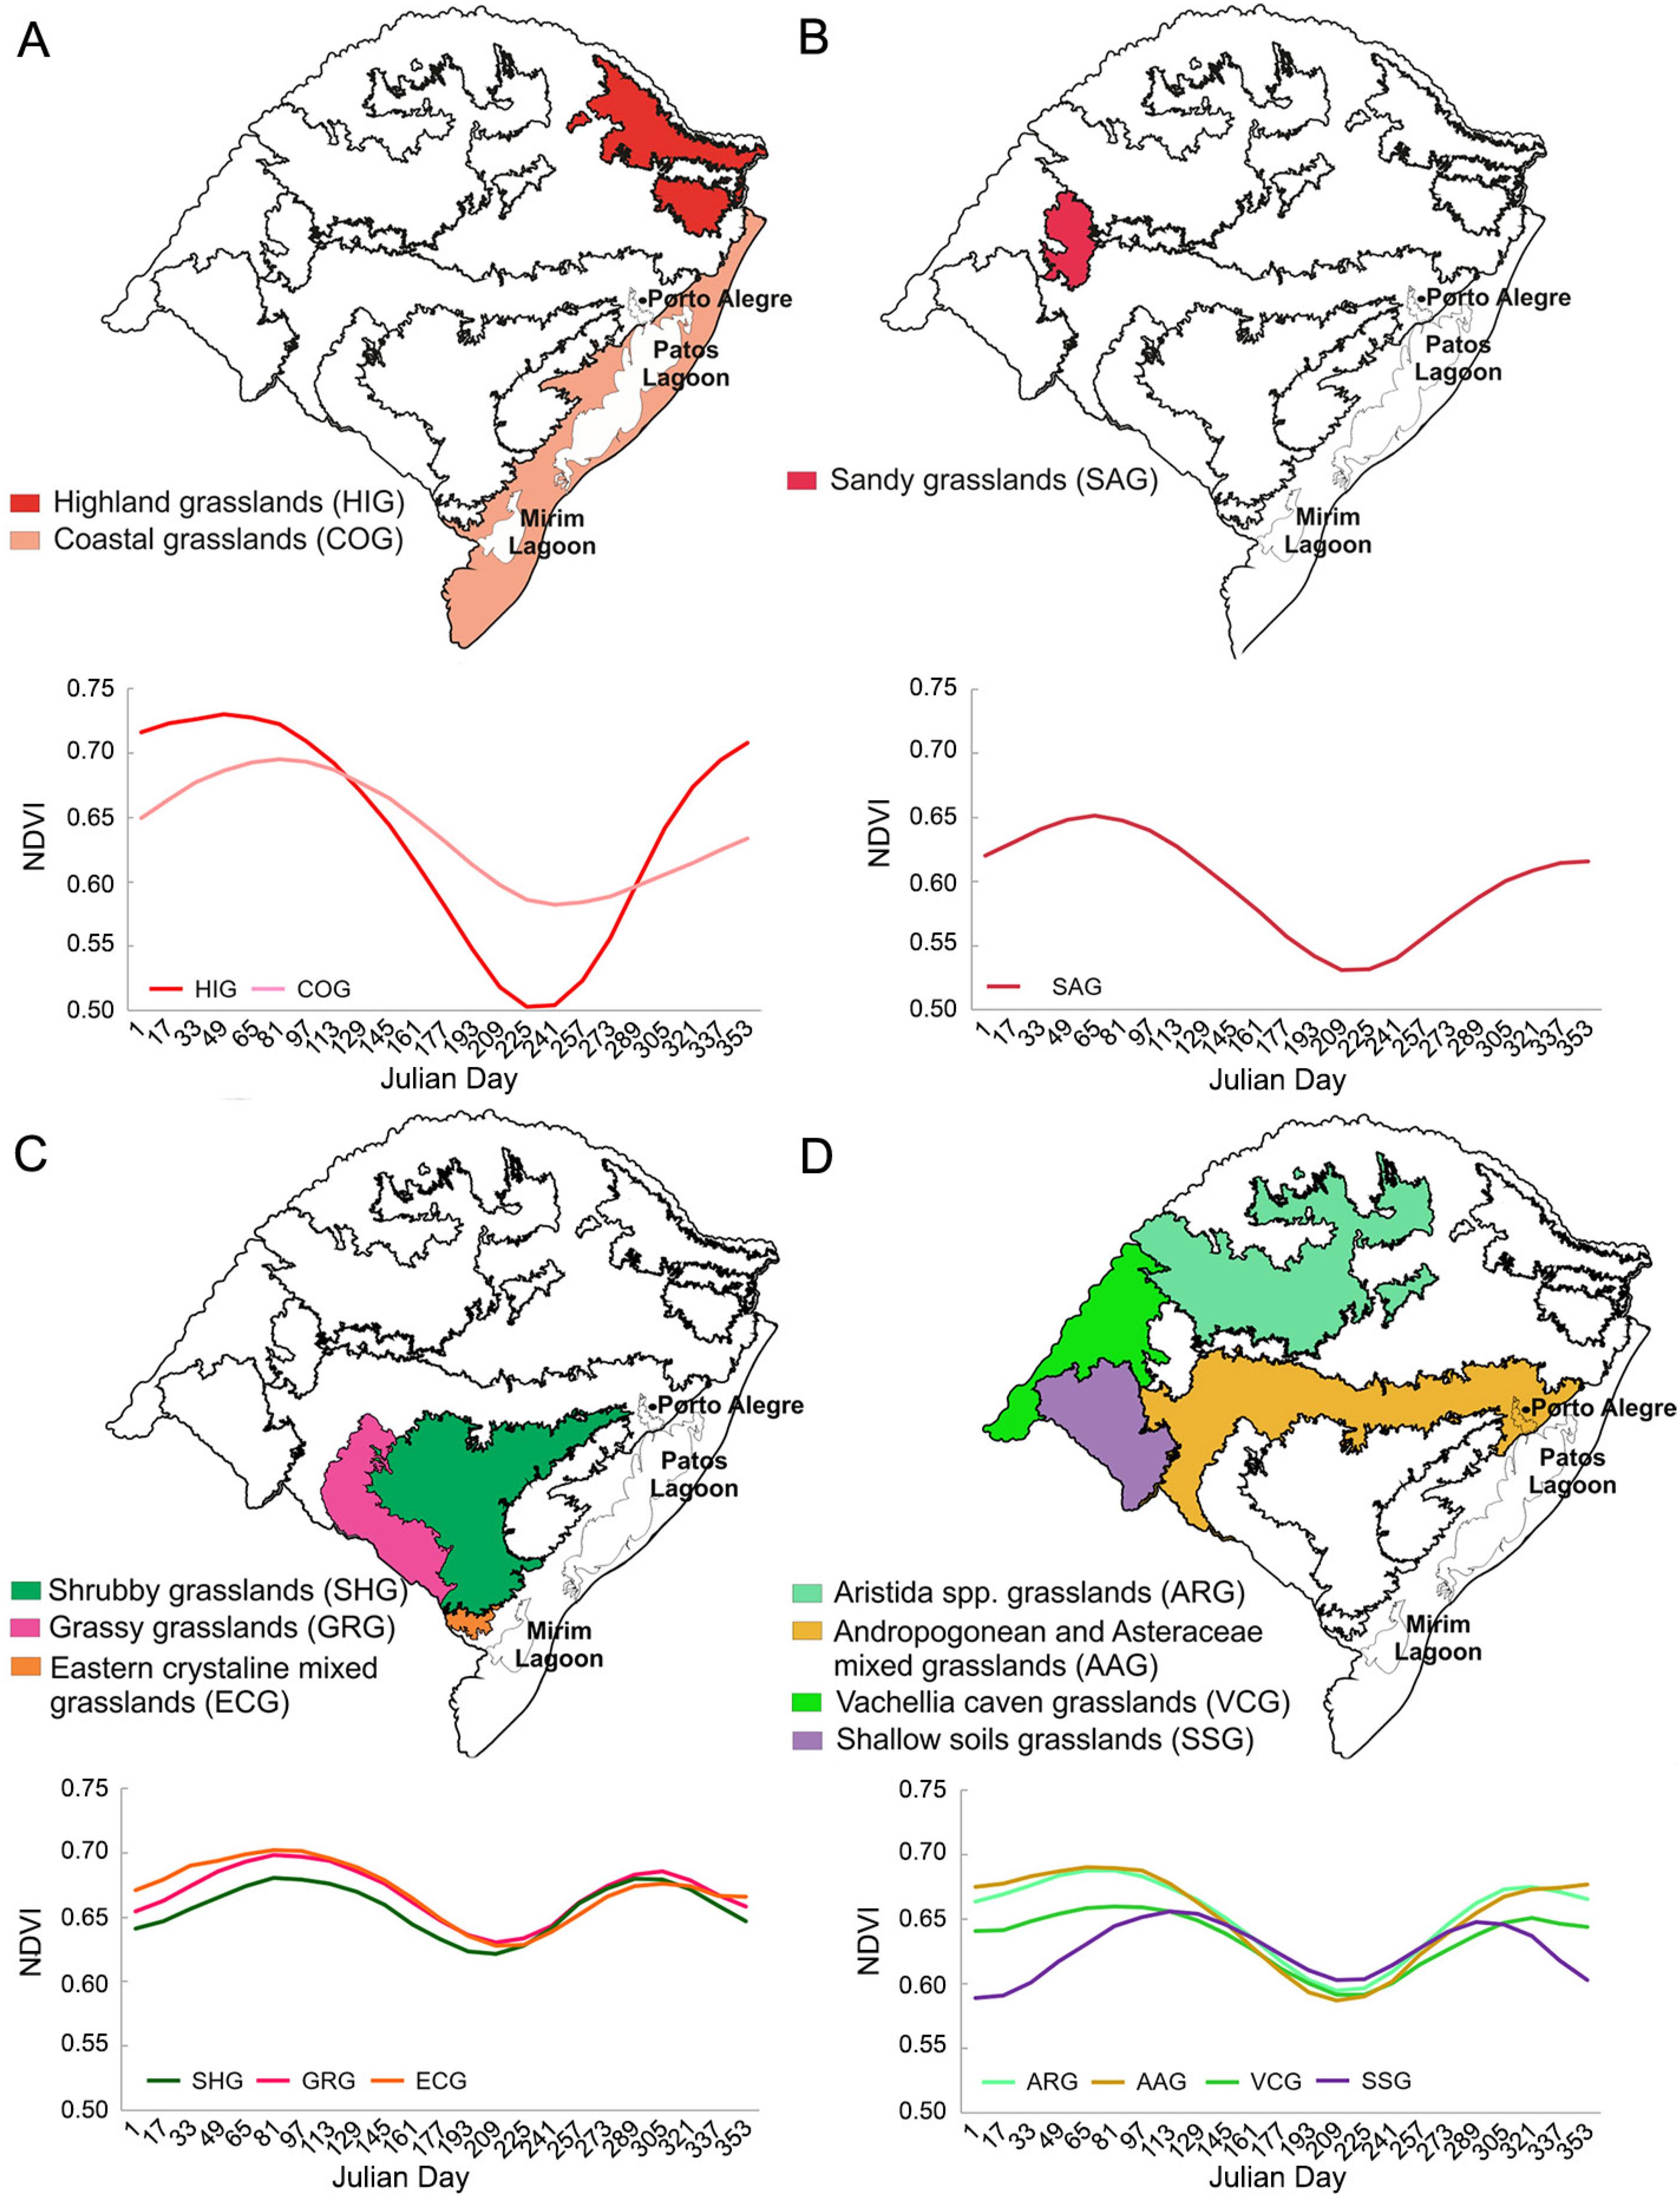
A time series cluster analysis was used to identify the relationships between grassland typologies according to seasonal patterns identified from the EVI and NDVI (Figure 4). The grassland typologies, HIG and COG (Group 1) and SHG, GRG and ECG (Group 3), for both indices, formed similar groups both in the average seasonal profile and proximity in spatial distribution (Figure 5A and C and Figure 6A and C), which is a consequence of the similarities in soil type, climate and composition of plant species, among others.
Cluster analysis for EVI and NDVI indices/MODIS of the grassland typologies of RS: Highland grasslands (HIG), Coastal grasslands (COG), Sandy grasslands (SAG), Andropogonean and Asteraceae mixed grasslands (AAG), Vachellia caven grasslands (VCG), Eastern crystaline mixed grasslands (ECG), Shrubby grasslands (SHG), Aristida spp. grasslands (ARG), Grassy grasslands (GRG) and Shallow soils grasslands (SSG) for the period 2000-2014.
Average values and spatial distribution of the EVI groups (A, B, C and D) to grassland typologies in RS, in the 2000-2014 period.
Average values and spatial distribution of the NDVI groups (A, B, C and D) to grassland typologies in RS,in the 2000-2014 period.
Between the EVI and NDVI indices, distinct clusters for the remaining grassland typologies were identified. For the EVI index, Group 2 comprises the SAG, VCG and SSG typologies and Group 4 the ARG and AAG typologies (Figure 5B and D). As for the NDVI index, the SAG typology differs from the others (Figure 6B) and Group 4 comprises the ARG, AAG, VCG and SSG typologies (Figure 6D). This difference between the groups can be associated with the ability of spectral indices to detect differences in the spectral pattern of the targets.
The NDVI index is given by the ratio between the reflectance of the bands of red and near infrared, being more sensitive to the presence of chlorophyll and other pigments responsible for absorption of solar radiation in the red band (Gao et al., 2000Gao, X.; Huete, A.R.; Ni, W.; Miura, T. 2000. Optical-biophysical relationships of vegetation spectra without background contamination. Remote Sensing of Environment 74: 609-620.), which makes it possible to highlight and identify changes in the seasonal profile of the vegetation cover. The EVI, however, has also increased sensitivity to structural and architectural changes in the typology canopy with higher density of biomass compared to NDVI, mitigating the effects of the atmosphere and soil (Huete et al., 2002Huete, A.R.; Didan, K.; Miura, T.; Rodriguez, E.P.; Gao, X.; Ferreira, L.G. 2002. Overview of the radiometric and biophysical performance of the MODIS vegetation indices. Remote Sensing of Environment 83: 195-213.).
Despite the formation of distinct groups, the spectral indices demonstrated the ability to identify the similarities and differences associated with the onset and duration of the growing season, green peak and senescence periods, which were used to determine the phenological pattern of grassland typologies. The characterization of this pattern may allow for the detection of anomalies that indicate stress or even favorable growth conditions in the grassland, even though the information is generated in spatio-temporal form.
For both vegetation indices, it was possible to distinguish the seasons in which there was an increase in biomass, growth period and leaf weight gain of the species, which began in the spring and reached a maximum value in the late summer to early autumn. Both indices demonstrated a decline at the end of autumn with the onset of the cold season, followed by the observation of the lowest values of EVI and NDVI associated with plant senescence. In all groups, for both EVI and NDVI (Table 1 and 2), the summer was the season with the highest values while the winter presented the lowest values, all statistically different from the other seasons. This shows that the seasonal variation in the grassland vegetation phenology is strongly influenced by the availability of solar radiation and air temperature.
Average values per group and season and Coefficient of Variation (CV) of the Enhanced Vegetation Index (EVI) of the grassland typologies of RS: Highland grasslands (HIG), Coastal grasslands (COG), Sandy grasslands (SAG), Andropogonean and Asteraceae mixed grasslands (AAG), Vachellia caven grasslands (VCG), Eastern crystaline mixed grasslands (ECG), Shrubby grasslands (SHG), Aristida spp. grasslands (ARG), Grassy grasslands (GRG) and Shallow soils grasslands (SSG) for the 2000-2014 time series.
Average values per group and season and Coefficient of Variation (CV) of the Enhanced Vegetation Index (NDVI) of the grassland typologies of RS: Highland grasslands (HIG), Coastal grasslands (COG), Sandy grasslands (SAG), Andropogonean and Asteraceae mixed grasslands (AAG), Vachellia caven grasslands (VCG), Eastern crystaline mixed grasslands (ECG), Shrubby grasslands (SHG), Aristida spp. grasslands (ARG), Grassy grasslands (GRG) and Shallow soils grasslands (SSG) for the 2000-2014 time series.
Previous studies using time profiles of vegetation indices have shown this association in different regions of the globe. Specifically, for the grassland vegetation in Rio Grande do Sul, Junges et al. (2015) analyzed images of NDVI and EVI/MODIS for natural grassland experimental units and attributed the decrease in NDVI and EVI values to the low air temperature and solar radiation during winter, which is associated with a reduction in plant growth. Also, the temporal profiles showed increased NDVI and EVI during spring because of summer species regrowth, and slightly decreased values in summer, especially in years when there was a water deficit, and increased values in the autumn associated with the beginning of winter forage development.
For spring and summer, there were differences according to the group and analyzed index, but, more often, summer presented higher EVI and NDVI values. However, the EVI showed greater capacity for differentiating between groups, for the autumn. For the NDVI, autumn showed values similar to the spring and autumn seasons in groups 2, 3 and 4. Only Group 1 (Table 1 and 2) showed a difference in average values between the four seasons, with a coefficient of variation (CV) with winter having the highest value. Group 3, composed of the same typologies for both indices, had higher CV values in summer and autumn, when there were also major differences between the average values over the seasonal profile (Figure 5C and 6C). This shows that the air temperature and the greater availability of solar radiation during the spring and summer shape the seasonality of the grassland vegetation. It was also possible to observe that, during the summer, periods of drought and lower water availability are more frequent, contributing to increased variability in the values of vegetation indices in this season.
A factor other than temperature that influences the difference in CV value during the autumn is that the C3 species begins to regrow. Another difference in CV can be attributed to variation in rainfall. Drought periods or irregular distribution of rainfall determines the occurrence of water stress in the grassland vegetation in RS and are more frequent during the summer reflected in the development/growth of vegetation until the beginning of autumn.
The southern grasslands are composed of complex ecosystems, with high floristic biodiversity, conditioned by the richness of plant species with the ability to resist or adapt to weather changes and forage value induced by different substrates (shallow soils and backgrounds, with rocky outcrops, etc.) and/or grazing regimes (Pillar et al., 2012Pillar, V.; Boldrini, I.I.; Bencke, G.; Medeiros, R. 2012. Southern grasslands = Campos do sul. p. 200-235. In: Sacarano, F.R.; Santos, I.L.; Martins, A.C.I.; Silva, J.M.C.; Guimarães, A.L.; Mittermeir, R.A., eds. Brazilian biomes: portraits of a plural country = Biomas Brasileiros: retratos de um país plural. Conservação Internacional, Rio de Janeiro, RJ, Brazil (in Portuguese).), showing the difficulty in discriminating the different grassland typologies. The diversity of these grasslands was characterized by EVI and NDVI indices.
Conclusion
The typologies studied show consistent EVI and NDVI profiles with the seasonal dynamics of grassland vegetation under the influence of the subtropical climate, with higher indices values during the warm seasons (spring and summer) and lower values during colder seasons (autumn and winter). Both indices have higher variability during the spring and summer, with a decrease during the autumn and winter.
Different groups were formed to show the different sensitivities of the analyzed indices associated with the spectral bands used in the preparation of indices, resulting in different potential for identifying variations in the seasonal dynamics of the typologies. The results suggest that the grassland formation in Rio Grande do Sul can be grouped into four typological groups according to EVI and NDVI vegetation indices.
The analysis presented here makes it possible to confirm the diversity of the grassland typologies of the southern grassland, expressed by vegetation indices in both temporal and spatial aspects. The grouping of typologies demonstrated their seasonal behavior, signaling distinct management needs in current and future conservation activities.
Acknowledgments
We thank the Coordenação de Aperfeiçoamento de Pessoal de Nível Superior (CAPES), for granting a PhD Scholarship to the first author.
References
- Alvares, C.A.; Stape, J.L.; Sentelhas, P.C.; Gonçalves, J.L.M.; Sparovek, G. Köppen's climate classification map for Brazil. Meteorologische Zeitschrift 22: 711-728.
- Boldrini, I.I.; Overbeck, G.; Trevisan, R. 2015. Biodiversity of plants = Biodiversidade de plantas. p. 51-56. In: Pillar, V.P.; Lange, O., eds. The southern grasslands. Network southern grasslands = Os campos do Sul. Rede Campos Sulinos. Universidade Federal do Rio Grande do Sul, Porto Alegre, RS, Brazil (in Portuguese).
- Chen, J.; Jönsson, P.; Tamura, M.; Gu, Z.; Matsushita, B.; Eklundh, L. 2004. A simple method for reconstructing a high-quality NDVI time-series data set based on the Savitzky-Golay filter. Remote Sensing of Environment 91: 332-344.
- Efron, B. 1979. Bootstrap methods: another look at the Jackknife. The Annals of Statistics 7: 1-26.
- Gao, X.; Huete, A.R.; Ni, W.; Miura, T. 2000. Optical-biophysical relationships of vegetation spectra without background contamination. Remote Sensing of Environment 74: 609-620.
- Hasenack, H.; Weber, E.; Boldrini, I.I.; Trevisan, R. 2010. Map of Ecological Systems of the Ecoregion of the Uruguayan Savannas on Scale 1:500,000 or Higher and Technical Report Describing Inputs Used and Methodology for Drawing up the Ecological Systems Map = Mapa de Sistemas Ecológicos da Ecorregião das Savanas Uruguaias em Escala 1:500.000 ou Superior e Relatório Técnico Descrevendo Insumos Utilizados e Metodologia de Elaboração do Mapa de Sistemas Ecológicos. Universidade Federal do Rio Grande do Sul, Centro de Ecologia. Porto Alegre, RS, Brazil (in Portuguese).
- Huete, A.R.; Didan, K.; Miura, T.; Rodriguez, E.P.; Gao, X.; Ferreira, L.G. 2002. Overview of the radiometric and biophysical performance of the MODIS vegetation indices. Remote Sensing of Environment 83: 195-213.
- Jönsson, P.; Eklundh, L. 2004. TIMESAT: a program for analyzing time-series of satellite sensor data. Computers and Geosciences 30: 833-845.
- Junges, A.H.; Bremm, C.; Fontana, D.B.; Oliveira, C.A.O.; Schaparini, L.P.; Carvalho, P.C.F. 2016. Temporal profiles of vegetation indices for characterizing grazing intensity on natural grasslands in Pampa biome. Scientia Agricola 73: 332-337.
- Lieth, H. 1974. Purpose of a phenology book. p. 3-19. In: Lieth, H., ed. Phenology and seasonality modeling. Springer, Berlin, Germany.
- Overbeck, G.E.; Müller, S.C.; Fidelis, A.; Pfadenhauer, J.; Pillar, V.D.; Blanco, C.C.; Boldrini, I.I.; Both, R.; Forneck, E.D. 2007. Brazil's neglected biome: the south Brazilian campos. Perspectives in plant ecology. Evolution and Systematics 9: 101-116.
- Overbeck, G.E.; Hermann, J.M.; Andrade, B.O.; Boldrini, I.I.; Kiehl, K.; Kirmer, A.; Koch, C.; Kollmann, J.; Meyer, S.T.; Müller, S.C.; Nabinger, C.; Pilger, G.E.; Trindade, J.P.P.; Vélez-Martin, E.; Walker, E.A.; Zimmermann, D.G.; Pillar, V. 2013. Restoration ecology in Brazil: time to step out of the forest. Natureza & Conservação 11: 92-95.
- Overbeck, G.E.; Boldrini, I.I.; Carmo, M.R.B.; Garcia, E.N.; Moro, R.S.; Pinto, C.E.; Trevisan, R.; Zannin, A. 2015. Grasslands physiognomy = Fisionomia dos campos. p. 31-39. In: Pillar, V.P.; Lange, O., eds. The southern grasslands. Network southern grasslands = Os campos do sul. Rede campos sulinos. Universidade Federal do Rio Grande do Sul, Porto Alegre, RS, Brazil (in Portuguese).
- Pillar, V.; Boldrini, I.I.; Bencke, G.; Medeiros, R. 2012. Southern grasslands = Campos do sul. p. 200-235. In: Sacarano, F.R.; Santos, I.L.; Martins, A.C.I.; Silva, J.M.C.; Guimarães, A.L.; Mittermeir, R.A., eds. Brazilian biomes: portraits of a plural country = Biomas Brasileiros: retratos de um país plural. Conservação Internacional, Rio de Janeiro, RJ, Brazil (in Portuguese).
- Pillar, V.; Tornquist, C.G.; Bayer, C. 2012. The southern Brazilian grassland biome: soil carbon stocks, fluxes and greenhouse gases and some options for mitigation. Brazilian Journal of Biology 72: 673-681.
- Scottá, F.C.; Fonseca, E.L. 2015. Multiscale trend analysis for pampa grasslands using ground data and vegetation sensor imagery. Sensors 15: 17666-17692.
- Soudani, K.; Hmimina, G.; Delpierre, N.; Pontailler, J.Y.; Aubinet, M.; Bonal, D.; Caquet, B.; Grandcourt, A.; Burban, B.; Flechard, C.; Guyon, D.; Granier, A.; Gross, P.; Heinesh, B.; Longdoz, B.; Loustau, D.; Moureaux, C.; Ourcival, J.M.; Rambal, S.; Saint André, L.; Dufrêne, E. 2012. Ground-based network of NDVI measurements for tracking temporal dynamics of canopy structure and vegetation phenology in different biomes. Remote Sensing of Environment 123: 234-245.
- Tan, B.; Morisette, J.; Wolfe, R.; Esaias, W.; Gao, F.; Ederer, G.; Nightingale, J.; Nickeson, J.E.; Ma, P.; Pedely, J. 2011. Modis vegetation phenology metrics estimated with an enhanced timesat algorithm. IEEE Journal of Selected Topics in Applied Earth Observations and Remote Sensing 4: 361-371.
- Vanschaik, C.P.; Terborgh, J.W.; Wright, S.J. 1993. The phenology of tropical forests: adaptive significance and consequences for primary consumers. Annual Review of Ecology and Systematics 24: 353-377.
- Ward Jr., J.H. 1963. Hierarchical grouping to optimize an objective function. Journal of the American Statistical Association 58: 236-244.
- Zhang, X.; Friedl, M.A.; Schaaf, C.B.; Strahler, A.H.; Hodges, J.C.F.; Gao, F.; Reed, B.C.; Huete, A. 2003 Monitoring vegetation phenology using MODIS. Remote Sensing of Environment 84: 471-475.
Edited by
Publication Dates
-
Publication in this collection
Jan-Feb 2019
History
-
Received
13 May 2017 -
Accepted
21 Sept 2017