ABSTRACT:
Soybean [Glycine max (L.) Merr.] grain yield is closely associated with the level of optimal nitrogen (N) supply, especially during the reproductive stages. Foliar fertilization with low rates of N have been considered as a strategy for furnishing additional N and enhancing grain yields. Field studies using 15N tracer were conducted over two growing seasons to investigate the impact of foliar N fertilization on grain yield, plant N content, the amount of N derived from fertilizer (NDFF) and N recovery efficiency (NRE). Four foliar N rates (0, 1300, 2600 and 3900 g ha−1) were supplied by two equal split applications at the R1 and R3 stages. Foliar N fertilization of soybean canopies did not affect grain yield, grain N content, shoot N content nor plant N content. Total NDFF was increased from 0.7 to 2.0 kg ha−1 across the N rates. Nonetheless, NRE was unaffected by foliar N fertilization, which averaged 53 %. Soybean plants allocated the same amount of N fertilizer to both grains and shoots. No significant effects of low rate foliar N fertilization were registered on soybean grain yield nor plant N content, despite considerable N fertilizer recovery by plant organs.
Keywords:
Glycine max (L.) Merr; foliar N fertilization; 15N tracer; foliar application; nitrogen recovery efficiency
Introduction
Foliar nitrogen (N) fertilization is an increasingly common practice in commercial grain soybean [Glycine max (L.) Merr.] production. Soybean N fixation will necessarily reflect variations in soil N supplying power, and although soybeans can fix appreciable amounts of N ~200 kg ha−1 (Unkovich and Pate, 2000Unkovich, M.J.; Pate, J.S. 2000. An appraisal of recent field measurements of symbiotic N2 fixation by annual legumes. Field Crops Research 65: 211-228.; Alves et al., 2003Alves, B.J.; Boddey, R.M.; Urquiaga, S. 2003. The success of BNF in soybean in Brazil. Plant and Soil 252: 1-9.; Herridge et al., 2008Herridge, D.F.; Peoples, M.B.; Boddey, R.M. 2008. Global inputs of biological nitrogen fixation in agricultural systems. Plant and Soil 311: 1-18.), recent studies document that N limits grain yield (Wilson et al., 2014Wilson, E.W.; Rowntree, S.C.; Suhre, J.J.; Weidenbenner, N.H.; Conley, S.P.; Davis, V.M.; Diers, B.W.; Esker, P.D.; Naeve, S.L.; Specht, J.E.; Casteel, S.N. 2014. Genetic gain × management interactions in soybean. II. Nitrogen utilization. Crop Science 54: 340-348.; Felipe et al., 2016Felipe, M.; Gerde, J.A.; Rotundo, J.L. 2016. Soybean genetic gain in maturity groups III to V in Argentina from 1980 to 2015. Crop Science 56: 3066-3077.). The application of low amounts of N as a foliar spray is a pathway for additional N, especially during the pod-filling stage when N demand is high (Gaspar et al., 2017Gaspar, A.P.; Laboski, C.A.; Naeve, S.L.; Conley, S.P. 2017. Phosphorus and potassium uptake, partitioning, and removal across a wide range of soybean seed yield levels. Crop Science 57: 2193-2204.). In addition, compatibility with pesticides commonly applied reduces costs and more foliar N applications may be performed.
Previous studies have shown grain yield increases resulting from foliar N fertilization (Vasilas et al., 1980Vasilas, B.; Legg, J.; Wolf, D. 1980. Foliar fertilization of soybeans: absorption and translocation of 15N-labeled urea. Agronomy Journal 72: 271-275.; Blandino and Reyneri, 2009Blandino, M.; Reyneri, A. 2009. Effect of fungicide and foliar fertilizer application to winter wheat at anthesis on flag leaf senescence, grain yield, flour bread-making quality and don contamination. European Journal of Agronomy 30: 275-282.; Ranđelović et al., 2009Ranđelović, V.; Prodanović, S.; Prijić, L.; Glamočlija, Đ.; Živanović, L.; Kolarić, L. 2009. Effect of foliar fertilization under stress conditions on two soybean varieties from different maturity groups. PKB Agroekonomik 15: 67-72.; Jyothi et al., 2013Jyothi, C.N.; Ravichandra, K.; Babu, K.S. 2013. Effect of foliar supplementation of nitrogen and zinc on soybean (Glycine max. L.) yield, quality and nutrient uptake. Indian Journal of Dryland Agricultural Research and Development 28: 46-48.; Khan et al., 2013Khan, A.Z.; Jan, A.; Shah, Z.; Ahmad, B.; Khalil, S.K.; Ali A.; Ahmad, F.; Nawaz, A. 2013. Foliar application of nitrogen at different growth stages influences the phenology, growth and yield of maize (Zea mays L.). Soil and Environment 32: 135-140.). It has been suggested that foliar N application may provide other advantages as well. Using foliar N application during the pod-filling, Ikeda et al. (1991)Ikeda, M.; Choi, W.; Yamada, Y. 1991. Sucrose fatty acid esters enhance efficiency of foliar-applied urea-nitrogen to soybeans. Nutrient Cycling in Agroecosystems 29: 127-131. reported increased photosynthetic productivity in leaves and the export of photosynthates to the nodules for an extended length of time. In studies investigating foliar application effects on grain N concentrations, such concentrations increased between 0.2 % and 2.4 % (Ruske et al., 2003Ruske, R.; Gooding, M.; Jones, S. 2003. The effects of adding picoxystrobin, azoxystrobin and nitrogen to a triazole programme on disease control, flag leaf senescence, yield and grain quality of winter wheat. Crop Protection 22: 975-987.; Blandino and Reyneri, 2009Blandino, M.; Reyneri, A. 2009. Effect of fungicide and foliar fertilizer application to winter wheat at anthesis on flag leaf senescence, grain yield, flour bread-making quality and don contamination. European Journal of Agronomy 30: 275-282.; Mandić et al., 2015Mandić, V.; Simić, A.; Krnjaja, V.; Bijelić, Z.; Tomić, Z.; Stanojković, A.; Ruzić-Muslić, D. 2015. Effect of foliar fertilization on soybean grain yield. Biotechnology in Animal Husbandry 31: 133-143.).
In contrast, a lack of grain yield effect has also been observed in many field studies. Excessive foliar damage may limit grain yield responses when high rates of N are applied under leaves (Phillips and Mullins, 2004Phillips, S.; Mullins, G. 2004. Foliar burn and wheat grain yield responses following topdress-applied nitrogen and sulfur fertilizers. Journal of Plant Nutrition 27: 921-930.). However, two reviews performed by Gooding and Davies (1992)Gooding, M.; Davies, W. 1992. Foliar urea fertilization of cereals: a review. Fertilizer Research 32: 209-222. and Fageria et al. (2009)Fageria, N.K.; Barbosa Filho, M.P.; Moreira, A.; Guimarães, C.M. 2009. Foliar fertilization of crop plants. Journal of Plant Nutrition 32: 1044-1064. showed that grain yield responses are also closely correlated with foliar application timing. The same authors observed that grain yield increases were most commonly obtained through foliar application during the reproductive stages and with negligible foliage burning.
While these studies provide valuable information about foliar N fertilization, only a few studies have investigated foliar fertilizer recovery efficiency in soybean crops. Moreover, previous studies have involved higher rates of foliar N fertilizer than are used in Brazilian soybean production to supply N while avoiding leaf damage. Knowledge of foliar N recovery efficiency (NRE) and its allocation in soybean crops could help to better implement foliar N application strategies and to better understand the effects on grain yield. Therefore, using 15N tracer methods, the main goal of this study was to investigate the effects of foliar N fertilization on grain yield and NRE.
Materials and Methods
Site description
The field experiment was performed in the state of São Paulo (49°15’08” W, 23°34’53.5” S, 545 m asl) over two growing seasons in 2012-2013 (Year 1) and 2013-2014 (Year 2). Located in the southwest of Brazil, this experimental area has a subtropical humid climate (Köppen, 1936Köppen, W. 1936. Das geographische system der climate. p. 1-44. In: KÖPPEN, W; GEIGER, R., eds. Handbuch der Klimatologie, Gebrüder Borntraeger, Berlin, BL, Germany.) with low seasonal precipitation variation. The rainfall and mean temperature for crop seasons are shown in Figures 1A and B. Based on the USDA (1999)United States Department of Agriculture [USDA]. 1999. Soil Taxonomy: A Basic System of Soil Classifications for Making and Interpreting Soil Surveys. USDA, Washington, DC, USA. classification system the soil is classified as a Typic Hapludalf with 657 g kg−1 clay, 253 g kg−1 silt and 190 g kg−1 sand. Before planting, the soil chemical properties were measured at a 0-20 cm depth, and provided the following results: pH of 5.5 (CaCl2), 40 g of organic matter dm−3, 2.2 g of N kg−1, P (resin extractable) of 19 mg kg−1, exchangeable K of 0.76cmolc kg−1 and base saturation of 70 %.
Rainfall and average air temperature during the soybean growing season in 2012-13 (A) and 2013-14 (B). Planting and growth stages are specified in accordance with Fehr and Caviness (1977)Fehr, W.R.; Caviness, C.E. 1977. Stages of Soybean Development. Iowa State University, Ames, IA, USA..
The experiment was conducted using a randomized block design with four replicates. Treatments consisted of four foliar N rates (0, 1300, 2600 and 3900 g ha−1) applied as urea through two equal split applications at R1 and R3 stages (Fehr and Caviness, 1977Fehr, W.R.; Caviness, C.E. 1977. Stages of Soybean Development. Iowa State University, Ames, IA, USA.). No foliage burning was noted across the applications. Each plot consisted of 10 m-long rows spaced 0.45 m apart. The Nideira 5909 RR variety was planted at 226,000 and 247,000 seeds ha−1 for years 1 and 2, respectively. Phosphorus and potassium were applied in the furrow during planting as triple superphosphate (86 kg ha−1 P2O5) and KCl (65 kg ha−1 K2O).
N internal efficiency (NIE) indicates how efficiently soybean grains produce relative to the N accumulated by the aboveground biomass (kg grain produced/kg aboveground biomass N content) (Fageria, 2014Fageria, N.K. 2014. Nitrogen Management in Crop Production. CRC Press, New York, NY, USA.).
Foliar N fertilizer was applied using a manual backpack sprayer pressurized with CO2 and equipped with a flat spray tip applying a 200 L ha−1 spray volume. The soybean canopy was situated 0.5 m below the spray tip.
15N methods
Each treatment plot, a microplot with four 1 m rows and a total area of 1.8 m2 received labeled fertilizer spread containing 2.53 atom % 15N, according to the rates and stages described earlier. The remaining plants in the plot were treated with unlabeled fertilizer.
Labeled samples were taken at the R7 stage (Fehr and Caviness, 1977Fehr, W.R.; Caviness, C.E. 1977. Stages of Soybean Development. Iowa State University, Ames, IA, USA.) to evaluate the total N and the N derived from fertilizer (NDFF) amounts in the soybean biomass above ground. Four plants were collected from each of the two rows in the middle of the microplots and divided into grain and shoot categories (petiole, leaf, steam and pod). This early sample aimed to avoid leaf drop and increase the non-recovery of 15N (NRN). Grain yield was obtained using unlabeled samples taken at physiological maturity and by adjusting the moisture level to 130 g kg−1. Approximately 100 plants were collected within 3 m of the three central rows of each plot.
All samples were dried in a forced air circulation laboratory oven at 65 °C, weighed and carefully ground into fine powder using a Wiley mill. The 15N/14N ratios as well as the total N concentration in plant samples were determined in an automated mass spectrometer coupled to an ANCA-GSL N analyzer (Sercon Co., UK). The term N recovery efficiency (NRE) was used to indicate the percent of N fertilizer recovery by the whole plant. The NDFF was used to indicate the amount of N fertilizer recovery in compartments of the whole plant, expressed in kg ha−1. NDFF values were obtained using the following equation.
where: NDFF is the amount of N derived from the fertilizer (kg ha−1), α the abundance of 15N atoms in the sample (%), β the natural abundance of 15N atoms, γ the abundance of 15N atoms in the fertilizer (2.53 % atoms), and total N the total N (15N+14N) contained in the sample (kg ha−1).
where: NRE is the percentage of 15N recovered from the whole soybean plant, Total NDFF the amount of 15N recovered from whole plant (kg ha−1), and the fertilizer N rate the rate of enriched fertilizer applied (kg ha−1).
Statistical analyses
All data were analyzed using the statistical software program (SAS v. 9.2, 2009). Before analysis, the observations from the response variables were tested for homoscedasticity using the Box-Cox test (Box and Cox, 1964Box, G.E.; Cox, D.R. 1964. An analysis of transformations. Journal of the Royal Statistical Society. Series B (Methodological) 26: 211-252.). F-tests were performed at a 5 % probability to identify the effects and their interactions. If the null hypothesis was rejected, the mean was compared via Fisher's least significant difference (LSD) test at p ≤ 0.05 probability, and regressions were fitted to the rates when necessary.
Results
Foliar N fertilization had no effect on grain yield (Table 1) and yield components such as the number of nodes, pods, stems or seed weight (data not shown). Nonetheless, we registered differences between grain years. Grain yield means were 3.7 and 4.2 Mg ha−1 for years 1 and 2, respectively. Plant N content and NIE had similar responses to foliar N application, and while no difference was registered across rates, differences between years were significant for grain and plant N content. Grain and plant N content ranged between 185-197 kg ha−1 and 254-281 kg ha−1, respectively, throughout the two years of the study. Average shoot N content was 79 kg ha−1.
Grain yield, N internal efficiency (NIE), and N content for grain, shoot and plant for different years and rates.
As might be expected, high rates of foliar N resulted in greater grain NDFF. There were statistical differences between years (Year 1 > Year 2), but no interaction between year and rate (Table 2). A positive linear regression between grain NDFF and rates was fitted (Figure 2A).
Foliar N rates effects on grain (A), shoot (B), total NDFF (C) and NRE (D). N derived from fertilizer, NDFF and N recovery efficiency, NRE. **Significance at p ≤ 0.01; ***Significance at p ≤ 0.001.
Grain, shoot and total N derived from fertilizer (NDFF) and N recovery efficiency (NRE) for different years and rates.
There was no difference in NDFF between years and their interaction with rates. Nevertheless, the shoot NDFF was significantly different across the rates and ranged from 0.32 to 0.83 kg ha−1 (Figure 2B).
As noted for grains and shoots, total NDFF was significantly affected by rates. Despite the year difference, there was no interaction effect between year and rate. Our regression analysis showed that total NDFF increased ~0.5 g N kg−1 when N fertilizer was applied (Figure 2C).
There was no difference between the rates of foliar N applied for NRE. Even though the years differed, the interaction between year and rate was not significantly affected (Table 2 and Figure 2D). On average, NRE was 53 % for foliar N applications performed on soybean canopies.
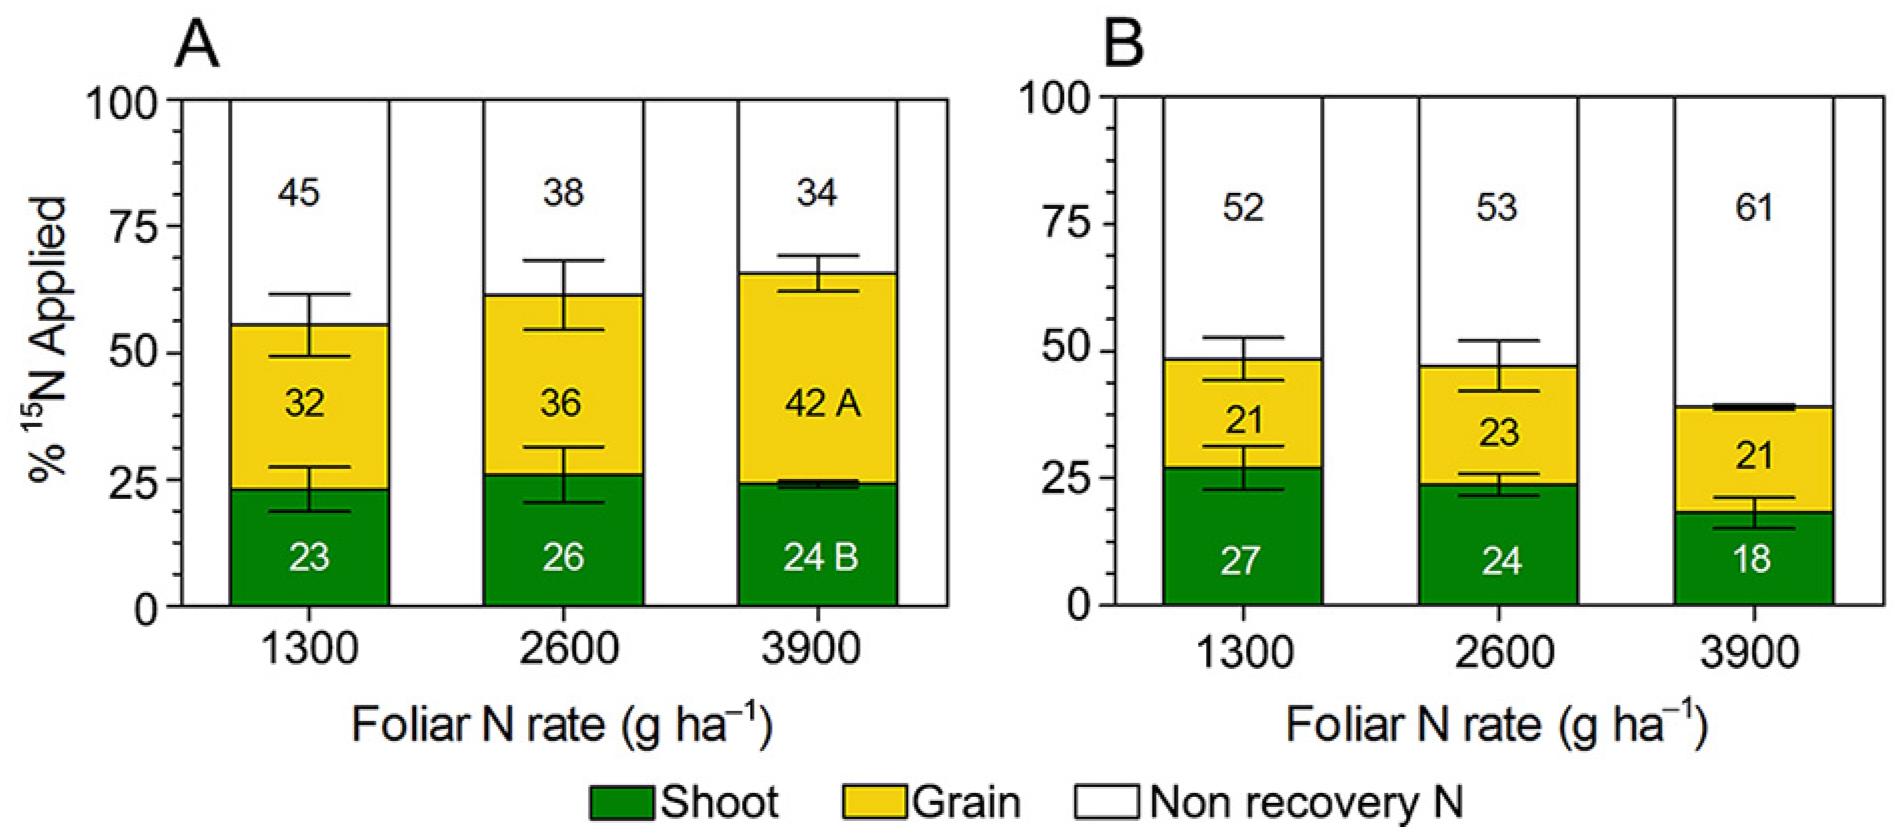
N fertilizer distribution is shown in Figures 3A and B. Except for the higher rate in year 1, the same amounts of N fertilizer were allocated in the grains and shoots (p > 0.05). Overall, shoot recovery ranged from 18 % to 27 % and grain recovery ranged from 21 % to 42 %.
Allocation of N fertilizer sprayed under soybean leaves. Year 1 (A) and Year 2 (B). Uppercase letters indicate significant difference between organs for the same foliar N rate.
Discussion
Differences between years for grain yield may be a combination of a slight increase (~8 %) of planting rate in year 2 (De Bruin and Pedersen, 2008De Bruin, J.L.; Pedersen, P. 2008. Effect of row spacing and seeding rate on soybean yield. Agronomy Journal 100: 704-710.; Cox and Cherney, 2011Cox, W.J.; Cherney, J.H. 2011. Growth and yield responses of soybean to row spacing and seeding rate. Agronomy Journal 103: 123-128.), accompanied by better growing conditions (Figure 1A and B). However, N provided by low rates of foliar applications showed no differences in soybean grain yield. Previously reported in the literature, Troedson et al. (1989)Troedson, R.; Lawn, R.; Byth, D.; Wilson, G. 1989. Response of field-grown soybean to saturated soil culture 2. Effect of treatments to alter photosynthesis and leaf nitrogen supply. Field Crops Research 21: 189-201. and Haq and Mallarino (2000)Haq, M.U.; Mallarino, A.P. 2000. Soybean yield and nutrient composition as affected by early season foliar fertilization. Agronomy Journal 92: 16-24. showed that foliar N fertilization effects on grain yield were usually insignificant. Recently, despite high grain yields (> 4.2 Mg ha−1), Saturno et al. (2017)Saturno, D.F.; Cerezini, P.; Moreira, P.D.S.; Oliveira, A.B.D.; Oliveira, M.C.N.D.; Hungria, M.; Nogueira, M.A. 2017 Mineral nitrogen impairs the biological nitrogen fixation in soybean of determinate and indeterminate growth types. Journal of Plant Nutrition: 1690-1701. and Moreira et al. (2017)Moreira, A.; Moraes, L.; Schroth, G.; Becker, F.; Mandarino, J. 2017. Soybean yield and nutritional status response to nitrogen sources and rates of foliar fertilization. Agronomy Journal 109: 629-635. have found similar results to those in this study using foliar N rates ranging from 5-20 kg ha−1 and 5-10 kg ha−1, respectively. For the same studies, only one out of five year sites had significant, but small, grain yield gains (~0.14 Mg ha−1).
Our results agree with the lack of effects of foliar N fertilization on grain yield previously found in literature, but also showed that the lack of effect on grain yield is not linked to low efficiency of fertilizer application since approximately 53 % of the foliar N fertilizer was recovered. Rather, the implication is that low rates of foliar N were of no benefit to the soybean crop, either for directly supplying N or indirectly increasing green leaf area index.
For soybeans, NIE values ranging from 6.4 to 18.8 and with a mean of 12.7 have been reported (Salvagiotti et al., 2008Salvagiotti, F.; Cassman, K.G.; Specht, J.E.; Walters, D.T.; Weiss, A.; Dobermann, A. 2008. Nitrogen uptake, fixation and response to fertilizer N in soybeans: a review. Field Crops Research 108: 1-13. and references cited therein). Mid to upper NIE values indicate N is the main limiting factor for grain yield. Thus, our results reflect higher NIE (~15) when compared with historical means, demonstrating that the low rates of foliar N might not be enough to support N demand. However, it is not clear how much exogenous N would be the optimal to achieve greater grain yields.
While there was an appreciable increase in NDFF (amount of fertilizer recovery) for all rates, the NRE (percent of fertilizer recovery) was similar, with an average value of 53 % (Figure 2A, B and C). The NRE was comparable to that previously reported by Afza et al. (1987)Afza, R.; Hardarson, G.; Zapata, F.; Danso, S. 1987. Effects of delayed soil and foliar N fertilization on yield and N2 fixation of soybean. Plant and Soil 97: 361-368., which was 43-67 % of the total foliar N applied. In a recent study investigating the effects of low rates of foliar N fertilization on soybeans (Pierozan Junior et al., 2015Pierozan Junior, C.; Favarin, J.L.; Almeida, R.E.M.; Oliveira, S.M.; Lago, B.C.; Trivelin, P.C.O. 2015. Uptake and allocation of nitrogen applied at low rates to soybean leaves. Plant and Soil 393: 83-94.), the authors show a mean NRE of 64 % that was not affected by rates ranging from 650 to 1950 g N ha−1. Thus, foliar N fertilization was an efficient pathway to supply N in soybean plants, despite its lack of effect on grain yield.
Generally, our results showed that foliar N fertilization had little to no effect on 15N partitioning. The lack of differences between grains and shoots could be attributed to N investment in the leaf blends and their photosynthesis rates (Makino et al., 1997Makino, A.; Sato, T.; Nakano, H.; Mae, T. 1997. Leaf photosynthesis, plant growth and nitrogen allocation in rice under different irradiances. Planta 203: 390-398.). When the N was applied between the R1 and R3 growth stages, the grain sink capacity remained low to medium, but rubisco and light harvesting proteins had a high N demand. Accordingly, Vasilas et al. (1980)Vasilas, B.; Legg, J.; Wolf, D. 1980. Foliar fertilization of soybeans: absorption and translocation of 15N-labeled urea. Agronomy Journal 72: 271-275. reported up to 94 % 15N allocation in the grain when spraying foliar N as urea at the R5-R7 growth stages.
Conclusions
The NRE had no effect across all the foliar N rates and 53 % of N sprayed under leaves was recovered. Overall, grains and shoots allocated N from fertilizer equally well and recovered 29 % and 24 %, respectively. Despite the considerable recovery of N supplied to soybean plants, low rates of N sprayed in the earlier pod-filling stage was not an effective method for enhancing grain yield and dynamic N uptake. The foliar N fertilization effect is not fully understood and is worth further study, especially during pod-filling.
Acknowledgments
Funding was provided by Stoller do Brasil Ltda. The funders had no role in data collection and analysis, decision to publish, or preparation of the manuscript. We thank José Luiz Motta de Almeida and his staff for logistical support. The authors would also like to acknowledge the Fundação de Amparo à Pesquisa do Estado de São Paulo (FAPESP, 2012/24266-5), the Conselho Nacional de Desenvolvimento Científico e Tecnológico (CNPq, 141444/2014-2) and the Coordenação de Aperfeiçoamento de Pessoal de Nível Superior (CAPES, 8881.134205/2016-01) for providing graduate scholarships.
References
- Afza, R.; Hardarson, G.; Zapata, F.; Danso, S. 1987. Effects of delayed soil and foliar N fertilization on yield and N2 fixation of soybean. Plant and Soil 97: 361-368.
- Alves, B.J.; Boddey, R.M.; Urquiaga, S. 2003. The success of BNF in soybean in Brazil. Plant and Soil 252: 1-9.
- Blandino, M.; Reyneri, A. 2009. Effect of fungicide and foliar fertilizer application to winter wheat at anthesis on flag leaf senescence, grain yield, flour bread-making quality and don contamination. European Journal of Agronomy 30: 275-282.
- Box, G.E.; Cox, D.R. 1964. An analysis of transformations. Journal of the Royal Statistical Society. Series B (Methodological) 26: 211-252.
- Cox, W.J.; Cherney, J.H. 2011. Growth and yield responses of soybean to row spacing and seeding rate. Agronomy Journal 103: 123-128.
- De Bruin, J.L.; Pedersen, P. 2008. Effect of row spacing and seeding rate on soybean yield. Agronomy Journal 100: 704-710.
- Fageria, N.K.; Barbosa Filho, M.P.; Moreira, A.; Guimarães, C.M. 2009. Foliar fertilization of crop plants. Journal of Plant Nutrition 32: 1044-1064.
- Fageria, N.K. 2014. Nitrogen Management in Crop Production. CRC Press, New York, NY, USA.
- Fehr, W.R.; Caviness, C.E. 1977. Stages of Soybean Development. Iowa State University, Ames, IA, USA.
- Felipe, M.; Gerde, J.A.; Rotundo, J.L. 2016. Soybean genetic gain in maturity groups III to V in Argentina from 1980 to 2015. Crop Science 56: 3066-3077.
- Gaspar, A.P.; Laboski, C.A.; Naeve, S.L.; Conley, S.P. 2017. Phosphorus and potassium uptake, partitioning, and removal across a wide range of soybean seed yield levels. Crop Science 57: 2193-2204.
- Gooding, M.; Davies, W. 1992. Foliar urea fertilization of cereals: a review. Fertilizer Research 32: 209-222.
- Haq, M.U.; Mallarino, A.P. 2000. Soybean yield and nutrient composition as affected by early season foliar fertilization. Agronomy Journal 92: 16-24.
- Herridge, D.F.; Peoples, M.B.; Boddey, R.M. 2008. Global inputs of biological nitrogen fixation in agricultural systems. Plant and Soil 311: 1-18.
- Ikeda, M.; Choi, W.; Yamada, Y. 1991. Sucrose fatty acid esters enhance efficiency of foliar-applied urea-nitrogen to soybeans. Nutrient Cycling in Agroecosystems 29: 127-131.
- Jyothi, C.N.; Ravichandra, K.; Babu, K.S. 2013. Effect of foliar supplementation of nitrogen and zinc on soybean (Glycine max L.) yield, quality and nutrient uptake. Indian Journal of Dryland Agricultural Research and Development 28: 46-48.
- Khan, A.Z.; Jan, A.; Shah, Z.; Ahmad, B.; Khalil, S.K.; Ali A.; Ahmad, F.; Nawaz, A. 2013. Foliar application of nitrogen at different growth stages influences the phenology, growth and yield of maize (Zea mays L.). Soil and Environment 32: 135-140.
- Köppen, W. 1936. Das geographische system der climate. p. 1-44. In: KÖPPEN, W; GEIGER, R., eds. Handbuch der Klimatologie, Gebrüder Borntraeger, Berlin, BL, Germany.
- Makino, A.; Sato, T.; Nakano, H.; Mae, T. 1997. Leaf photosynthesis, plant growth and nitrogen allocation in rice under different irradiances. Planta 203: 390-398.
- Mandić, V.; Simić, A.; Krnjaja, V.; Bijelić, Z.; Tomić, Z.; Stanojković, A.; Ruzić-Muslić, D. 2015. Effect of foliar fertilization on soybean grain yield. Biotechnology in Animal Husbandry 31: 133-143.
- Moreira, A.; Moraes, L.; Schroth, G.; Becker, F.; Mandarino, J. 2017. Soybean yield and nutritional status response to nitrogen sources and rates of foliar fertilization. Agronomy Journal 109: 629-635.
- Phillips, S.; Mullins, G. 2004. Foliar burn and wheat grain yield responses following topdress-applied nitrogen and sulfur fertilizers. Journal of Plant Nutrition 27: 921-930.
- Pierozan Junior, C.; Favarin, J.L.; Almeida, R.E.M.; Oliveira, S.M.; Lago, B.C.; Trivelin, P.C.O. 2015. Uptake and allocation of nitrogen applied at low rates to soybean leaves. Plant and Soil 393: 83-94.
- Ranđelović, V.; Prodanović, S.; Prijić, L.; Glamočlija, Đ.; Živanović, L.; Kolarić, L. 2009. Effect of foliar fertilization under stress conditions on two soybean varieties from different maturity groups. PKB Agroekonomik 15: 67-72.
- Ruske, R.; Gooding, M.; Jones, S. 2003. The effects of adding picoxystrobin, azoxystrobin and nitrogen to a triazole programme on disease control, flag leaf senescence, yield and grain quality of winter wheat. Crop Protection 22: 975-987.
- Salvagiotti, F.; Cassman, K.G.; Specht, J.E.; Walters, D.T.; Weiss, A.; Dobermann, A. 2008. Nitrogen uptake, fixation and response to fertilizer N in soybeans: a review. Field Crops Research 108: 1-13.
- Saturno, D.F.; Cerezini, P.; Moreira, P.D.S.; Oliveira, A.B.D.; Oliveira, M.C.N.D.; Hungria, M.; Nogueira, M.A. 2017 Mineral nitrogen impairs the biological nitrogen fixation in soybean of determinate and indeterminate growth types. Journal of Plant Nutrition: 1690-1701.
- Troedson, R.; Lawn, R.; Byth, D.; Wilson, G. 1989. Response of field-grown soybean to saturated soil culture 2. Effect of treatments to alter photosynthesis and leaf nitrogen supply. Field Crops Research 21: 189-201.
- United States Department of Agriculture [USDA]. 1999. Soil Taxonomy: A Basic System of Soil Classifications for Making and Interpreting Soil Surveys. USDA, Washington, DC, USA.
- Unkovich, M.J.; Pate, J.S. 2000. An appraisal of recent field measurements of symbiotic N2 fixation by annual legumes. Field Crops Research 65: 211-228.
- Vasilas, B.; Legg, J.; Wolf, D. 1980. Foliar fertilization of soybeans: absorption and translocation of 15N-labeled urea. Agronomy Journal 72: 271-275.
- Wilson, E.W.; Rowntree, S.C.; Suhre, J.J.; Weidenbenner, N.H.; Conley, S.P.; Davis, V.M.; Diers, B.W.; Esker, P.D.; Naeve, S.L.; Specht, J.E.; Casteel, S.N. 2014. Genetic gain × management interactions in soybean. II. Nitrogen utilization. Crop Science 54: 340-348.
Edited by
Publication Dates
-
Publication in this collection
Jul-Aug 2019
History
-
Received
23 Nov 2017 -
Accepted
24 Feb 2018