ABSTRACT:
A key issue in large-area inventories is defining a suitable sampling design and the effort required to obtain reliable estimates of species richness and forest attributes, especially in species-diverse forests. To address this issue, data from 418 systematically distributed 0.4 ha plots were collected. Estimators of nonparametric species richness were employed to assess the floristic representativeness of data collected in three forest types in the Brazilian Atlantic Forest. The sampling sufficiency of forest attributes was evaluated as a function of sample size. Altogether, 831 tree/shrub species were recorded. The data acquired through the systematic sampling design were representative of both species richness and basal area. The confidence intervals’ length would not substantially decrease by using more than 70 % of the reference sample (n = 364), thereby reaching a length of ∼5 % of the sample mean. Nevertheless, reliable estimates of species richness for diverse forests demand a thorough sampling approach far more exacting so as to achieve acceptable population estimates of forest attributes. Though the study area is regarded as a biodiversity hotspot, the forest stands showed diminished species richness, basal area, stem volume and biomass when compared to old-growth stands. As regards species richness, the data provided evidence of contrasting great γ-diversity (at the forest type level) and small α-diversity (at the forest stand level). Amongst anthropic impacts, illegal logging and extensive cattle grazing within stands are undoubtedly key factors that threaten forest conservation in the study area.
Keywords:
forest attributes estimation; species richness; forest monitoring; systematic sampling; secondary forests
Introduction
The main target of forest inventories is to generate both quantitative and qualitative data about forests and related ecosystems, taking a multi-temporal approach, and providing information for managers in terms of species composition, structure, growing stock, and forest dynamics (Vidal et al., 2008Vidal, C.; Lanz, A.; Tomppo, E.; Schadauer, K.; Gschwantner, T.; Di Cosmo, L.; Robert, N. 2008. Establishing forest inventory reference definitions for forest and growing stock: a study towards common reporting. Silva Fennica 42: 247–266.). Thus, many countries rely on continuously updated National Forest Inventories (NFIs) with systematic sampling designs and multi-source approaches which integrate field data and remotely sensed imagery.
Nevertheless, there are fewer (sub)tropical countries with completed NFIs (e.g., Mexico, Chile, and Tanzania) than European and North American countries (Tomppo et al., 2010Tomppo, E.; Gschwantner, T.; Lawrence, M.; McRoberts, R.E. 2010. National Forest Inventories: Pathways for Common Reporting. Springer, Dordrecht, The Netherlands.). Many of these (sub)tropical countries lack the support of a public forest administration and stable financial support. Additionally, operational constraints (e.g., difficult access to remote areas, and lack of qualified personnel), and the vast―but scarcely known―flora, may hinder the implementation of NFIs.
Two of the main challenges NFIs struggle with are the actual planning of the sampling design and defining the number of field sample plots to be measured (Köhl et al., 2006Köhl, M.; Magnussen, S.S.; Marchetti, M. 2006. Sampling Methods, Remote Sensing and GIS Multiresource Forest Inventory. Springer, Heidelberg, Germany.). The sampling design should be able to generate solid data about structural attributes (e.g., basal area, and tree density) and species diversity metrics (McRoberts et al., 2013McRoberts, R.E.; Tomppo, E.O.; Vibrans, A.C.; Freitas, J.V. 2013. Design considerations for tropical forest inventories. Brazilian Journal of Forestry Research 33: 189–202.; Tomppo et al., 2010Tomppo, E.; Gschwantner, T.; Lawrence, M.; McRoberts, R.E. 2010. National Forest Inventories: Pathways for Common Reporting. Springer, Dordrecht, The Netherlands.). Nonetheless, the sampling effort needed to achieve reliable population estimates of forest attributes and species richness may differ, at least in sub(tropical) forests, which, in turn, may be composed mostly of rare tree species (Caiafa and Martins, 2010Caiafa, A.N.; Martins, F.R. 2010. Forms of rarity of tree species in the southern Brazilian Atlantic rainforest. Biodiversity Conservation 19: 2597–2618.; ter Steege et al., 2013ter Steege, H.; Pitman, N.C.A.; Sabatier, D.; Baraloto, C.,; Salomão, R.P.; Guevara, J.E.; Phillips, O.L.; Castilho, C.V.; Magnusson, W.E.; Molino, J.F.; Abel Monteagudo, A.; Núñez Vargas, P.; Montero, J.C.; Feldpausch, T.R.; Coronado, E.N.H.; Killeen, T.J.; Mostacedo, B.; Vasquez, R.; Assis, R.L.; Terborgh, J.; Wittmann, F.; Andrade, A.; Laurance, W.F.; Laurance, S.G.W.; Marimon, B.S.; Marimon Jr., B.-H.; Vieira, I.C.G.; Amaral, I.L.; Brienen, R.; Castellanos, H.; Cárdenas López, D.; Duivenvoorden, J.F.; Mogollón, H.F.; Matos, F.D.A.; Dávila, N.; García-Villacorta, R.; Diaz, P.R.S.; Costa, F.; Emilio, T.; Levis, C.; Schietti, J.; Souza, P.; Alonso, A.; Dallmeier, F.; Montoya, A.J.D.; Fernandez Piedade, M.T.; Araujo-Murakami, A.; Arroyo, L.; Gribel, R.; Fine, P.V.A.; Peres, C.A.; Toledo, M.; Aymard C., G.A.; Baker, T.R.; Cerón, C.; Engel, J.; Henkel, T.W.; Maas, P.; Petronelli, P.; Stropp, J.; Zartman, C.E.; Daly, D.; Neill, D.; Silveira, M.; Ríos Paredes, M.; Chave, J.; Lima Filho, D.A.; Jørgensen, P.M.;Fuentes, A.; Schöngart, J.; Cornejo Valverde, F.; Di Fiore, A.; Jimenez, E.M.; Peñuela Mora, M.C.; Phillips, J.F.; Rivas, G.; van Andel, T.R.; von Hildebrand, P.; Hoffman, B.;Zent, E.L.; Malhi, Y.; Prieto, A.; Rudas, A.; Ruschell, A.R.; Silva, N.; Vos, V.; Zent, S.; Oliveira, A.A.; Schutz, A.C.; Gonzales, T.; Nascimento, M.T.; Ramirez-Ângulo, H.; Sierra, R.; Tirado, M.; Umaña Medina, M.N.; van der Heijden, G.; A. Vela, C.I.; Vilanova Torre, R.; Vriesendorp, C.; Wang, O.; Young, K.R.; Baider, C.; Balslev, H.; Ferreira, C.; Mesones, I.; Torres-Lezama, A.; Urrego Giraldo, L.E.; Zagt, R.; Alexiades, M.N.; Hernandez, L.; Huamantupa-Chuquimaco, I.; Milliken, W.; Palacios Cuenca, W.; Pauletto, D.; Valderrama Sandoval, E.; Valenzuela Gamarra, L.; Dexter, K.G.; Feeley, K.; Lopez-Gonzalez, G.; Silman, M.R.2013. Hyperdominance in the Amazonian tree flora. Science 342: 1243092.). Given this, the Forest and Floristic Inventory of Santa Catarina (IFFSC), which is integrated into the NFI-Brazil (Freitas et al., 2010Freitas, J.V.; Oliveira, Y.M.; Rosot, M.A.D.; Gomide, G.L.A.; Mattos, P.P. 2010. National Forest Inventories: Brazil. p. 89–96. In: Tomppo, E.; Gschwantner, T.; Lawrence, M.; McRoberts, R.E., eds. National Forest Inventories: pathways for common reporting. Springer, Amsterdam, The Netherlands.), creates an unprecedented opportunity to verify data variability, sampling sufficiency and floristic representativeness, at both the forest stand and forest type levels in the shrinking and threatened Atlantic Forest (Ribeiro et al., 2009Ribeiro, M.C.; Metzger, J.P.; Martensen, A.C.; Ponzoni, F.J.; Hirota, M.M. 2009. The Brazilian Atlantic forest: how much is left, and how is the remaining forest distributed? Implications for conservation. Biological Conservation 142: 1141–1153.).
This context leads to the main issues addressed in this paper, namely, (i) to estimate the species richness at both forest stand and forest type levels, and propose a straightforward algorithm to assess the floristic representativeness at the forest stand level, (ii) to evaluate the sampling sufficiency of forest attributes by forest type and as a function of sample size, and (iii) to analyze the conservation status of forests.
Materials and Methods
Study area
The study area was defined as the Brazilian state of Santa Catarina, located between latitudes 25°57’ and 29°21’ S, and longitudes 48°62’ and 53°50’ W, covering an area of 95,738 km² (Figure 1). The state's native forest area is estimated to be ∼29 % of its total area, while forest plantations of exotic species cover another 10 % (Vibrans et al., 2013Vibrans, A.C.; McRoberts, R.E.; Moser, P.; Nicoletti, A.L. 2013. Using satellite image-based maps and ground inventory data to estimate the area of the remaining Atlantic forest in the Brazilian state of Santa Catarina. Remote Sensing of Environment 130: 87–95.). The land ownership structure is molded by an overwhelming number of smallholders owning less than 20 ha of land. Thus, the forest cover is highly fragmented; about 85 % of the total forest area consists of patches smaller than 50 ha.
Forest type map of Santa Catarina (Southern Brazil) and the IFFSC sampling design and sample plot layout.
Three forest types can be found in Santa Catarina: semi-deciduous forest (SF), Araucaria forest (AF), and evergreen rainforest (ERF) (Oliveira-Filho et al., 2015Oliveira-Filho, A.T.; Budke, J.C.; Jarenkow, J.A.; Eisenlohr, P.V.; Neves, D.R.M. 2015. Delving into the variations in tree species composition and richness across South American subtropical Atlantic and Pampean forests. Journal of Plant Ecology 8: 242–260.). The altitude ranges (m a.s.l.) of each forest type considered in this study were 503–898 m (SF), 514–1,560 m (AF), and 2–1,195 m (ERF), respectively.
According to the Köppen climate classification system, Santa Catarina has two climate types: Cfa―humid subtropical climate with warm summers, and Cfb―humid subtropical climate with cool summers (Alvares et al., 2013Alvares, C.A.; Stape, J.L.; Sentelhas, P.C.; Gonçalves, J.L.M.; Sparovek, G. 2013. Köppen's climate classification map for Brazil. Meteorologische Zeitschrift 22: 711–728.). Average annual precipitation varies between 1,100 and 2,900 mm, and annual average relative humidity varies between 74 and 88 % (Pandolfo et al., 2002Pandolfo, C.; Braga, H.J.; Silva Junior, V.P.; Massignan, A.M.; Pereira, E.S.; Thomé, V.M.R. 2002. Climatologic Atlas of Santa Catarina State. = Atlas Climatológico do Estado de Santa Catarina. EPAGRI, Florianópolis, SC, Brazil (in Portuguese).). Long-term (> 30 years) average annual temperatures are 18.4, 16.4 and 18.9 °C for the SF, AF and ERF, respectively, and average annual precipitation is 1,646, 1,632 and 1,574 mm for the SF, AF and ERF, respectively.
Forest inventory data
The IFFSC data were gathered between 2007 and 2010 from 418 ground sample plots located at every intersection of a 10 km × 10 km grid. For the highly fragmented SF, a 5 km × 5 km grid was used to guarantee representativeness. The sample plots were located in native forest land after land use pre-stratification based on land cover maps; these maps were drawn up from medium resolution multispectral satellite images and their accuracy was assessed by Vibrans et al. (2013)Vibrans, A.C.; McRoberts, R.E.; Moser, P.; Nicoletti, A.L. 2013. Using satellite image-based maps and ground inventory data to estimate the area of the remaining Atlantic forest in the Brazilian state of Santa Catarina. Remote Sensing of Environment 130: 87–95.. Among the 418 sample plots, 78 were located in the SF, 143 in the AF, and 197 in the ERF. The sample plot consists of a cluster of four crosswise subplots with an area of 1,000 m2 (20 m × 50 m) each, located 30 m from the sample plot center (Figure 1). Each subplot is composed of 10 subunits with an area of 100 m² (10 m × 10 m). Inside the sample plot's limits, all living trees with dbh ≥ 10 cm, including palms and tree ferns, except lianas, were identified; living and standing dead trees were calipered.
The understory/regeneration layer in the SF and AF was assessed within one 5 m × 5 m subunit located at the end of each subplot (i.e., four understory subunits per sample plot), where all individuals with dbh < 10 cm and height (h) ≥ 1.5 m were measured. In turn, due to methodological adjustments, four subunits in each subplot were allocated in the ERF, resulting in 16 subplots per sample plot, wherein individuals with dbh < 10 cm and h ≥ 0.5 m were measured.
Species identification was carried out by a network of taxonomists; all vouchers are deposited at FURB Herbarium. The APG IV (2016)Angiosperm Phylogeny Group [APG]. 2016. An update of the Angiosperm Phylogeny Group classification for the orders and families of flowering plants: APG IV. Botanical Journal of the Linnean Society 181: 1–20. and PPG I (2016)Pteridophyte Phylogeny Group [PPG]. 2016. A community-derived classification for extant lycophytes and ferns. Journal of Systematics and Evolution 54: 563–603. classification systems were adopted for angiosperms and ferns, respectively; the list provided by JBRJ (2017)Jardim Botânico do Rio de Janeiro [JBRJ]. Brazilian Flora 2020. = Flora do Brasil 2020. 2017. Available at: http://floradobrasil.jbrj.gov.br/ [Accessed Jul 4, 2017] (in Portuguese).
http://floradobrasil.jbrj.gov.br/...
was used for spelling and synonymization of species names. The recorded species were classified into ecological groups (i.e., pioneer, secondary or climax species) according to Flora Ilustrada Catarinense (Reitz, 1965Reitz, R. 1965. Collection plan. In: Reitz, R., ed. Illustrated Flora of Santa Catarina. = Plano de coleção. Flora Ilustrada de Santa Catarina. Herbário Barbosa Rodrigues, Itajaí, SC, Brazil (in Portuguese).) and Swaine and Whitmore (1988)Swaine, M.D.; Whitmore, T.C. 1988. On the definition of ecological species groups in tropical rain forests. Vegetatio 75: 81–86., and into seed dispersal syndromes as per van der Pijl (1969)Van der Pijl, L. 1969. Principles of Dispersal in Higher Plants. Springer, New York, NY, USA..
Conservation status data
In each sample plot, field crews recorded the presence or absence of the following anthropic activities: (i) clear cutting (even at small scale); (ii) exotic tree species; (iii) cattle grazing/trampling; (iv) evidence of hunting; (v) exploitation of erva-mate tea leaves (Ilex paraguariensis A.St.-Hil.) in the AF, and palmito-juçara palm heart (Euterpe edulis Mart.) in the ERF; (vi) roads; (vii) selective logging; (viii) evidence of fire; (ix) understory mowing; and (x) surrounding land use classes.
The field crews also evaluated forest structural attributes, such as the number of layers, presence of large-diameter trees (dbh > 50 cm), canopy closure (visual estimates), presence of vascular epiphytes and lianas, and general plant diversity. Subsequently, forest stands were assigned to one of four successional stages: (i) initial regeneration – few species (< 10), young trees (dbh < 10 cm, total height < 8 m); (ii) intermediate regeneration – more species (between 10 and 30), but climax species are still missing in greater number; multiple layers and tall/large shade tolerant species are absent; (iii) advanced regeneration – greater species richness (> 30), presence of large-diameter trees and epiphytes―i.e., it is similar to the old-growth stage, although it presents signs of anthropic activities; and (iv) old-growth – similar to the advanced regeneration stage, although many large-diameter trees of climax species have been found and no evidence of recent anthropic activities has been perceived.
Data analysis
Assessing species richness and floristic representativeness
The species richness of each forest type (γ-diversity) was estimated by extrapolated sample-based rarefaction curves (Colwell et al., 2012Colwell, R.K.; Chao, A.; Gotelli, N.J.; Lin, S.Y.; Mao, C.X.; Chazdon, R.L.; Longino, J.T. 2012. Models and estimators linking individual-based and sample-based rarefaction, extrapolation and comparison of assemblages. Journal of Plant Ecology 5: 3–21.); therefore, the original sample (size) was doubled, as suggested by Chao et al. (2014)Chao, A.; Gotelli, N.J.; Hsieh, T.C.; Sander, E.L.; Ma, K.H.; Colwell, R.K.; Ellison, A.M. 2014. Rarefaction and extrapolation with Hill numbers: a framework for sampling and estimation in species diversity studies. Ecological Monographs 84: 45–67.. In addition, the total potential species richness was predicted by the Jackknife2 nonparametric estimator (Magurran, 2004Magurran, A.E. 2004. Measuring Biological Diversity. Blackwell, Oxford, UK.). This estimator outperformed other nonparametric estimators for Santa Catarina's forest types considering bias and precision (Oliveira et al., 2016Oliveira, L.Z.; Moser, P.; Vibrans, A.C.; Piazza, G.A.; Gasper, A.L.; Oliveira-Filho, A.T. 2016. Insights for selecting the most suitable nonparametric species richness estimators for subtropical Brazilian Atlantic Forests. Brazilian Journal of Botany 39: 593–603.). Floristic similarity among forest types was assessed through the Venn diagram and the Sørensen index calculated on a species matrix considering both common and exclusive species in each forest type.
At the sample plot level (α-diversity), the representativeness of the recorded species richness was investigated by differentiating a sample-based extrapolated rarefaction curve, which was constructed as per Colwell et al. (2012)Colwell, R.K.; Chao, A.; Gotelli, N.J.; Lin, S.Y.; Mao, C.X.; Chazdon, R.L.; Longino, J.T. 2012. Models and estimators linking individual-based and sample-based rarefaction, extrapolation and comparison of assemblages. Journal of Plant Ecology 5: 3–21.. A conservative approach of the 10/10 % criterion suggested by Cain and Castro (1959)Cain, S.A.; Castro, G.M.O. 1959. Manual of Vegetation Analysis. Harper, New York, NY, USA. was adopted. It conjectures that the sampling effort may be regarded as representative when an increase of 10 % in the sampled area is reflected in less than 10 % of increase in new species. The steps of the algorithm to apply the 10/10 % criterion were:
-
Construct a sample-based extrapolated rarefaction curve for the ith sample plot;
-
Record the number of species found in 4,000 m² (Sobs);
-
Fit a mathematical model to the rarefaction curve, namely S(A);
-
Differentiate S(A), apply the derivative for A = 4,000, and multiply it by 400 (ΔA) to obtain the theoretical species richness increase (ΔS);
-
If ΔS is smaller than 10 % of Sobs, the representativeness is achieved according to the 10/10 % criterion.
Estimates of forest attributes by forest type
The generation of estimates of forest attribute means and confidence intervals by forest type consisted of two major steps: (i) at the forest stand level, extrapolate the value obtained in a given sample plot to hectare; (ii) at the forest type level, calculate the variable mean and standard 95 % confidence interval based on the respective set of extrapolations generated at the forest stand level. It is important to state that the treatment of a systematic sampling design based on the simple random sampling assumption is valid. However, it is assumed that the sample variance may be overestimated, but never underestimated (Särndal et al., 1992Särndal, C.; Swensson, B.; Wretman, J. 1992. Model assisted survey sampling. Springer, New York, NY, USA.).
In the process of extrapolating forest attributes to hectare, the sample plot was regarded as the sample space and each subunit (100 m²) was regarded as an observation. Therefore, the sample plot area was 4,000 m² when all subunits were classified as valid measurements, i.e., subunits which were accessible to field crews, regardless of their land use class, or which were inaccessible but were not covered by forest. Conversely, subunits located in inaccessible sites (e.g., steep cliffs) were classified as invalid measurements when they were covered by forest. Thus, when invalid measurements were observed, the sample plot area considered in the extrapolation to hectare was less than 4,000 m².
The following attributes were considered for both living and dead trees (dbh ≥ 10 cm): dbh (cm); stem height (m; height until the bole divides and branching begins); total tree height (m); tree density (ind ha−1); basal area (m² ha−1); stem volume (m³ ha−1); above ground dry weight (AGDW) (Mg ha−1); and above ground carbon stock (AGCS) (Mg ha−1). The stem volume of angiosperms was predicted through models fitted by Vibrans et al. (2015)Vibrans, A.C.; Moser, P.; Oliveira, L.Z.; Maçaneiro, J.P. 2015. Generic and specific stem volume models for three subtropical forest types in southern Brazil. Annals of Forest Science 72: 865–874.. McRoberts et al. (2015)McRoberts, R.E.; Moser, P.; Oliveira, L.Z.; Vibrans, A.C. 2015. A general method for assessing the effects of uncertainty in individual-tree volume model predictions on large-area volume estimates with a subtropical forest illustration. Canadian Journal of Forest Research 45: 44–51. showed, using data gathered by the IFFSC, that the effects of a model's residual and parameter uncertainty on large-scale volume estimates in Santa Catarina are negligible. For Araucaria angustifolia (Bertol.) Kuntze, the model fitted by Netto (1984)Netto, S.P. 1984. National Forest Inventory, native forests: Paraná and Santa Catarina. = Inventário Florestal Nacional, florestas nativas: Paraná e Santa Catarina. Instituto Brasileiro de Desenvolvimento Florestal, Brasília, DF, Brazil (in Portuguese). was applied. Trees with crooked stems that were not fit to be sawn, palms, and tree ferns were not considered in the stem volume estimates. The AGDW was estimated through regional models fitted by Vogel et al. (2006)Vogel, H.L.M.; Schumacher, M.V.; Trüby, P. 2006. Biomass quantification in a seasonal deciduous forest in Itaara, RS, Brazil. Ciência Florestal 16: 419–425 (in Portuguese, with abstract in English). and Silveira (2009)Silveira, P. 2009. Adjustment of mathematical models for estimating above-ground biomass in a Dense Ombrophilous Forest. Floresta 39: 743–752 (in Portuguese, with abstract in English).. To obtain estimates of AGCS, the estimates of AGDW were multiplied by a conversion factor of 0.5.
Sampling sufficiency of forest attributes
The sampling sufficiency assessment by forest type considered the tree density (ind ha−1), basal area (m² ha−1), and stem volume (m³ ha−1). The sample size required to build confidence intervals with a length of 10 % of the sample mean with a confidence level of 95 % was applied (Köhl et al., 2006Köhl, M.; Magnussen, S.S.; Marchetti, M. 2006. Sampling Methods, Remote Sensing and GIS Multiresource Forest Inventory. Springer, Heidelberg, Germany.). The estimator may be denoted as , where is the sample variance, t the percentile of Student's two-tailed distribution with n – 1 degrees of freedom, and the sample mean. The sample variance () was estimated through the ratio estimator given by Cochran (1977)Cochran, W.G. 1977. Sampling Techniques. 3ed. John Wiley, New York, NY, USA. due to variations in the sample plots’ areas.
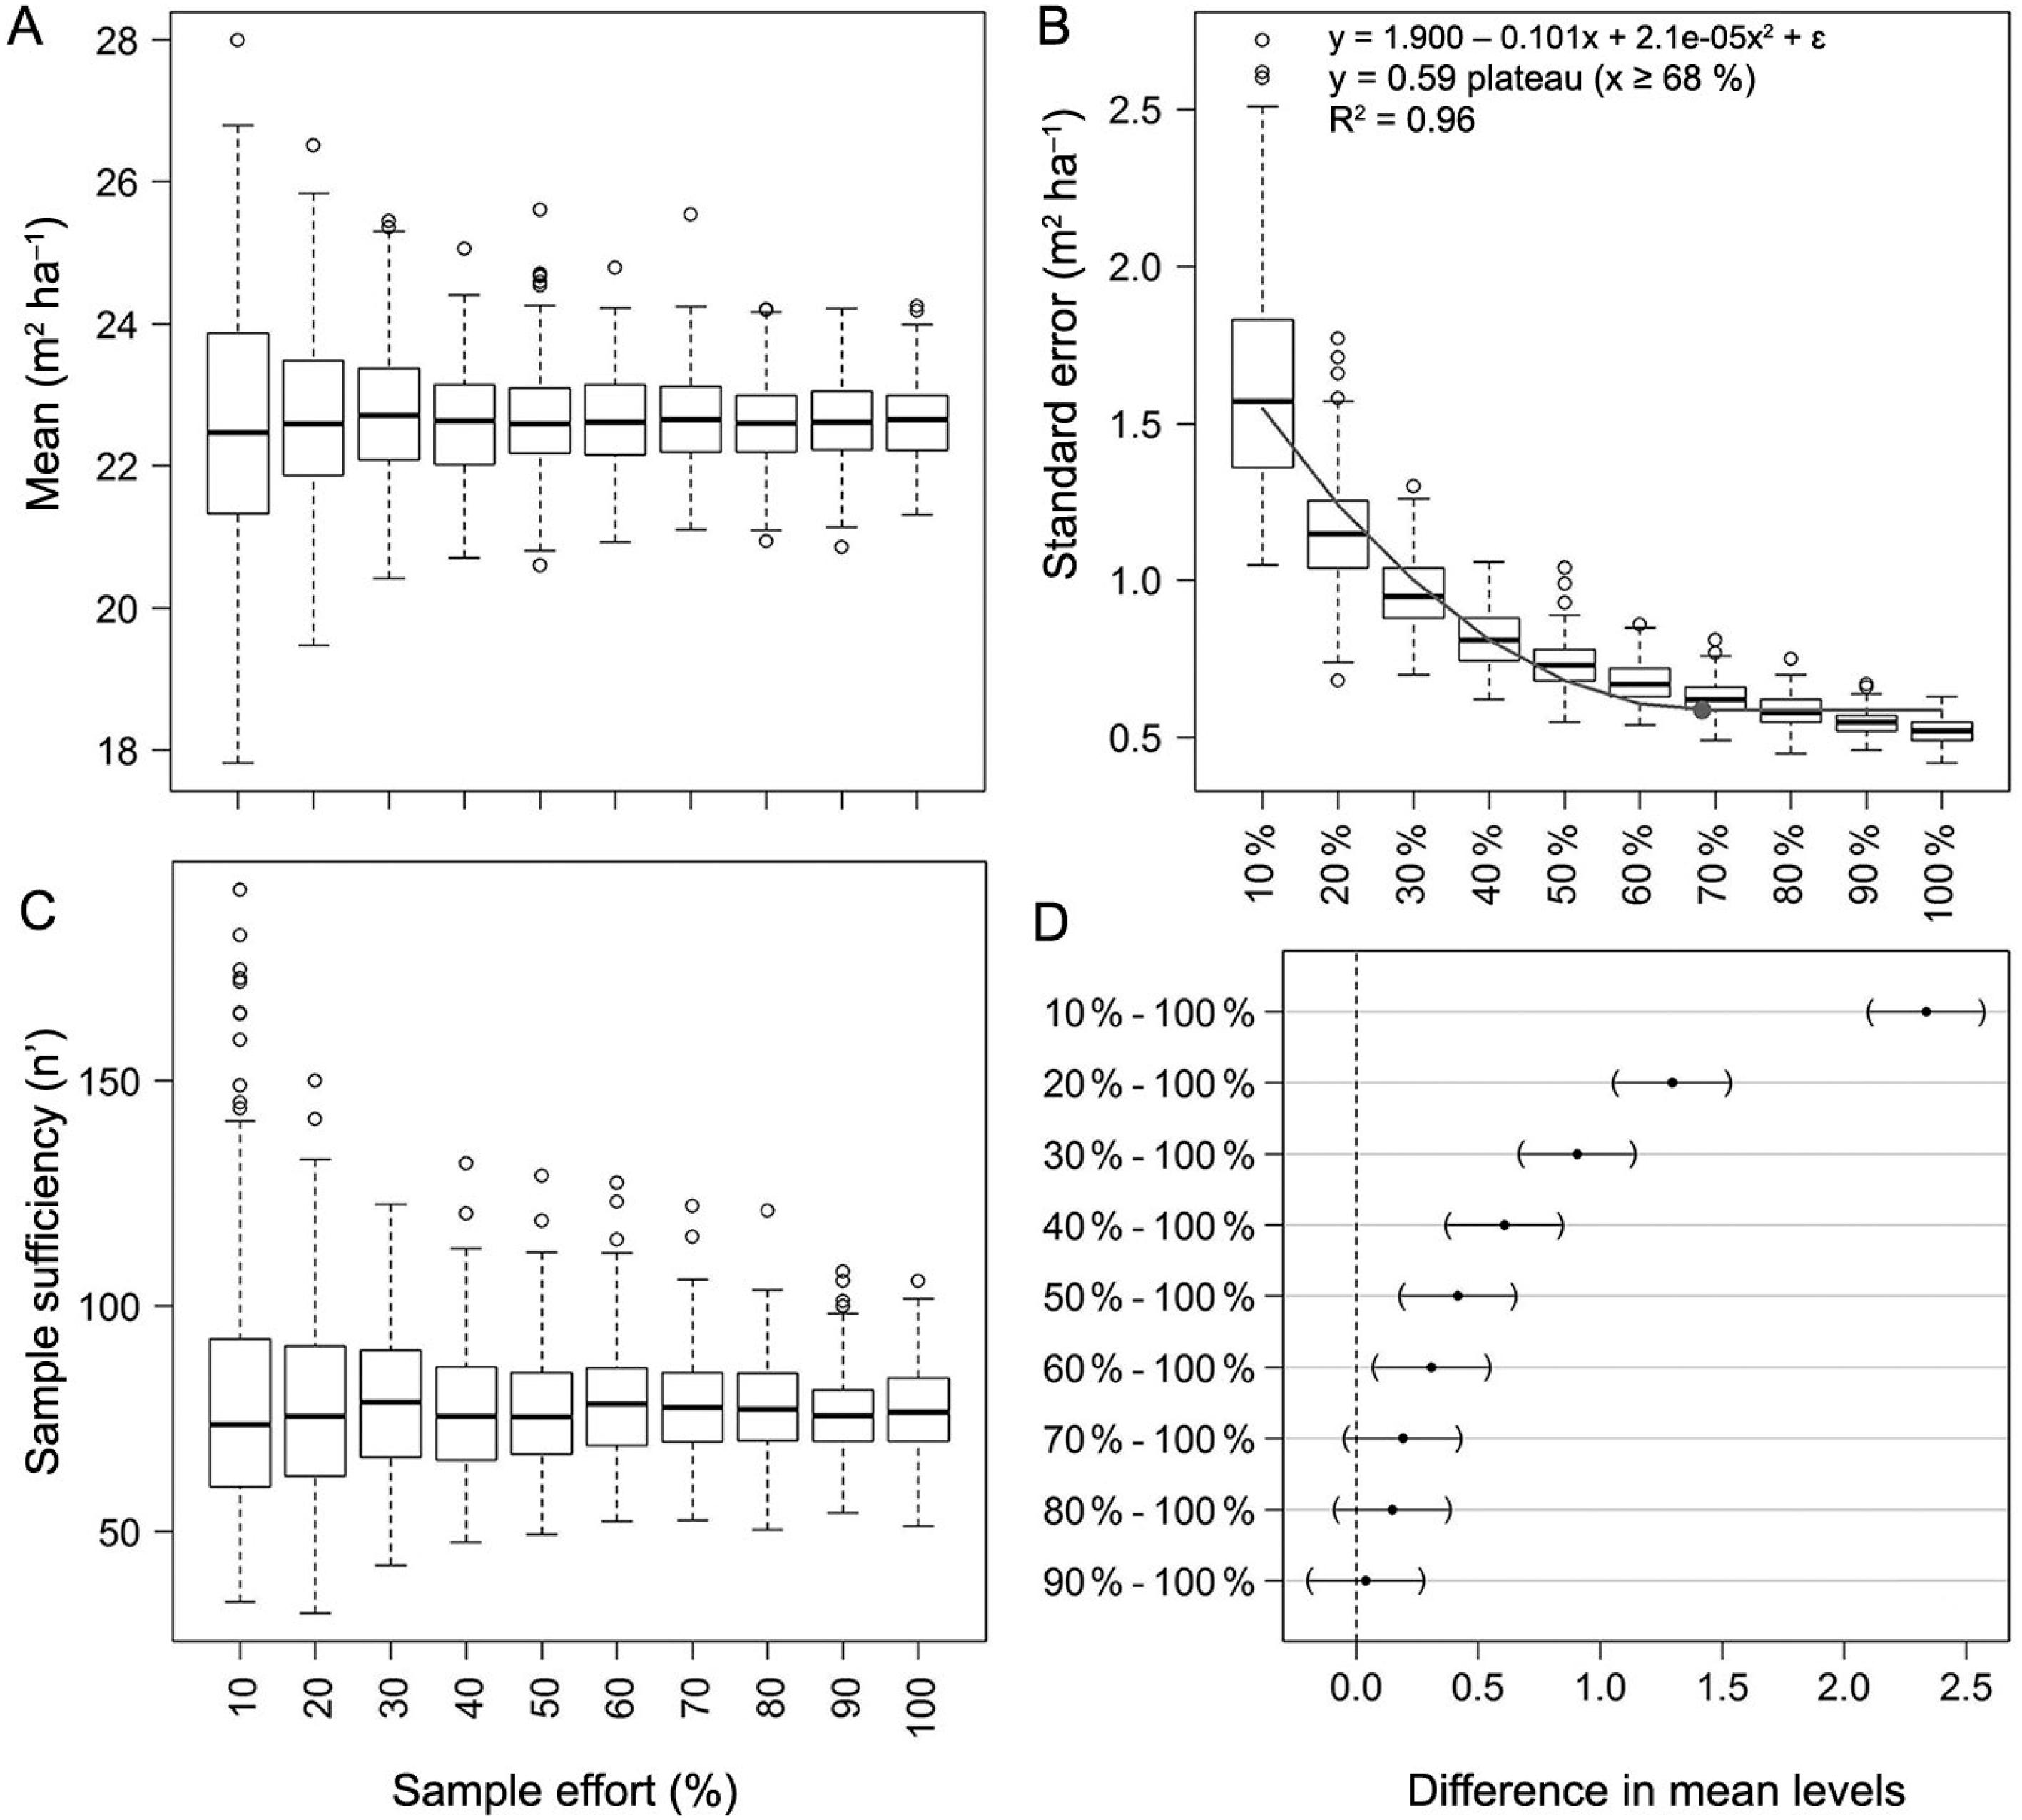
As for planning future large-area inventories in sub(tropical) regions, such as the Brazilian NFI, the behavior of the mean basal area (m² ha−1), its standard error, and sampling sufficiency as a function of sample size were assessed through the following steps:
-
Select a subsample of size n’ from the reference sample (n = 364) by means of resampling with replacement; the subsamples’ sizes ranged from 10 % to 100 % of the reference sample, which included all sample plots of the 10 km × 10 km grid (i.e., nSF = 24; nAF = 143; and nERF = 197);
-
For each subsample of size n’, calculate the sample mean, standard error (SE), standard 95 % confidence band, and the sampling sufficiency estimator for an infinite population with an error boundary of 10 % and α = 0.05, with obtained through the ratio estimator;
-
Repeat the process for each sample size class until the mean and standard error over the iterations stabilize.
To assume a point where the SE did not substantially decrease with the increasing of sample effort, a quadratic plateau model was fitted considering the mean SE over the iterations for each sample size class as the response variable, and the sample size classes as the predictor variable. In addition, a random sample (n = 30) of the estimated confidence bands for each sample size class was selected and Dunnett's family-wise 95 % confidence intervals were constructed to compare each sample size class to the 100 % class.
Results
Species richness and floristic representativeness
In total, 831 tree and shrub species were found in Santa Catarina's forests. From these, 649 species were registered in the canopy layer (dbh ≥ 10 cm), and 735 in the understory/regeneration layer (dbh < 10 cm). Remarkably, 96 species found in the canopy layer were not recorded in the understory/regeneration layer, of which 71 % are shade tolerant, and 29 % are not shade tolerant. The smallest species richness was registered in the SF: 244 species, from which 211 were found in the canopy layer, and 164 in the understory/regeneration layer. In the AF, 460 species were recorded: 367 in the canopy layer, and 380 in the understory/regeneration layer. In contrast, the ERF presented the greatest species richness: 735 species were recorded (567 in the canopy layer, and 644 in the understory/regeneration layer). Considering all the recorded species, 213 were classified into one of the IUCN's conservation status; from these species, 154 were assigned to the LC (Least Concern) category, and 59 species were assigned to the categories VU (Vulnerable), EN (Endangered), NT (Near Threatened), and CR (Critically endangered) (CNCFlora, 2018CNCFlora. 2018. National Center of Flora Conservation = Centro Nacional de Conservação da Flora. Available at: http://cncflora.jbrj.gov.br [Accessed June 8, 2018] (in Portuguese).
http://cncflora.jbrj.gov.br...
).
Considering the canopy layer, the smallest Sørensen similarity was between the ERF and the SF (0.43), while the AF presented greater similarity to the SF (0.59), and to the ERF (0.65). Figure 2 illustrates that forest types contain a considerable number of exclusive species. From the successional point of view, within tree species, 26 % were pioneers, 51 % were secondary, and 23 % were climax species. Taxonomic screening showed that most species’ seed dispersal type was zoochory (∼80 %).
Venn diagram of common and exclusive species (dbh ≥ 10 cm) of the three main forest types in Santa Catarina, southern Brazil, along with Sørensen indices. SF = semi-deciduous forest (n = 78); AF = Araucaria forest (n = 143); ERF = evergreen rainforest (n = 197).
In all forest types, the proportion of species richness found in half of the sample plots was greater than 80 % of the total species richness per forest type. The doubling of the original samples through the sample-based extrapolated rarefaction resulted in an increase in new species of 11 % for the SF, 11 % for the AF, and 12 % for the ERF (Figure 3). Assuming that the Jackknife2 estimator yielded the total potential species richness by forest type, the IFFSC recorded 76 %, 78 % and 76 % of the potential richness of the SF, AF and ERF, respectively.
Curves generated by the extrapolated sample-based rarefaction and by the Jackknife2 nonparametric estimator for three forest types in Santa Catarina, southern Brazil: (A) extrapolated rarefaction curves with 95 % confidence intervals; dashed lines represent the extrapolated curves; (B) Jackknife2 curves with standard deviations. SF = semi-deciduous forest (n = 78); AF = Araucaria forest (n = 143); ERF = evergreen rainforest (n = 197).
At the sample plot level, species richness was not uniformly distributed within the study area and forest types (Figure 4A, B, C). Only 12 sample plots (3 %) in the ERF contained more than 80 species each. This forest type presented an average richness of 54 species. The SF and AF presented a mean richness of 35 and 33 species, and a maximum of 56 and 53 species, respectively. The average understory/regeneration richness was 14, 13 and 55 species in the SF, AF and ERF, respectively. The 10/10 % criterion was fulfilled in 73 % of the sample plots in the SF, in 73 % of the sample plots in the AF, and in 87 % of the sample plots in the ERF (Figure 4D).
Observed (Sobs) and estimated species richness (extrapolated rarefaction curve; Sext.(2x)) by sample plot and their spatial distribution in Santa Catarina (A and B), and quartiles’ position (C). The interpolated maps were generated by kriging (exponential model), where: SF's sample plots (▲); AF's sample plots (+); ERF's sample plots (▄); thin black traces: rivers; and the thick black trace: Uruguay River. Figure (D) refers to the fulfillment of the 10/10 % criterion―gray bars represent the sample plots that fulfilled the criterion and black bars represent the ones that did not fulfill the criterion. SF = semi-deciduous forest (n = 78); AF = Araucaria forest (n = 143); ERF = evergreen rainforest (n = 197).
Forest attributes estimates
The differences among forest attribute means among forest types did not follow the pattern regarding species richness, in which the SF presented the smallest, and the ERF the greatest species richness, except for the mean dbh and tree density (Table 1). The forest types presented no differences in terms of stem volume and above ground carbon stock. The larger basal area found in the AF may be related to the inclusion of tree ferns, which corresponded to 16 % of its total basal area: solely Dicksonia sellowiana Hook., the most abundant species, contributed to 96 % of the tree fern density in the AF. The tree density, basal area, stem volume, and dry weight distributions are shown in Figure 5.
Forest attributes’ distributions according to the data gathered by the Forest and Floristic Inventory of Santa Catarina (IFFSC). SF = semi-deciduous forest (n = 78); AF = Araucaria forest (n = 143); ERF = evergreen rainforest (n = 197).
Means and confidence interval (α = 0.05) of forest attributes of living and dead trees of the semi-deciduous forest (SF), Araucaria forest (AF), and evergreen rainforest (ERF).
Likewise, dead trees accounted for 7 %, 6 % and 6 % of the living trees density, and 8 %, 6 % and 7 % of the living trees basal area of the SF, AF and ERF, respectively.
Sampling sufficiency of forest attributes
Sampling sufficiency was achieved for all the evaluated variables and forest types, with the exception of stem volume (m³ ha−1) for the SF (Table 2).
The behavior of the distribution of the basal area (m² ha−1) sample means, standard errors and sampling sufficiency as a function of sample size is shown in Figure 6. In this regard, the subsequent remarks are relevant:
(A) Distributions of the estimated sample means, (B) standard errors of the means, (C) sample sufficiency, and (D) Dunnett's pairwise comparison of confidence bands for basal area (m² ha−1). The reference sample is composed of 364 sample plots measured by the Forest and Floristic Inventory of Santa Catarina (IFFSC).
Mean: The variability in the distribution of sample means reduced considerably after the sample size class of 50 % (n’ ≈ 182) of the reference sample (n = 364) (Figure 6A); the variability of the distribution of sample means for each sample size class is presented in Figure 6A.
Standard error (SE): The increase in sample size did not add extra variability to the pooled standard deviation estimates, and the SE therefore decreased following the square root of the sample size. The quadratic plateau model presented a satisfactory goodness-of-fit (R² = 0.96) and all its parameters were different from zero (α = 0.05); its plateau was defined at 68 % of the reference sample size (n’ ≈ 248) (Figure 6B). This evidence suggests that the SE of the mean would not dramatically change with the increase in sample effort from this point on.
Sample sufficiency: The mean number of sample plots (among the iterations) needed to achieve sufficiency, adopting an error boundary of 10 % and α = 0.05, was ∼78; this corresponds to ∼21 % of the reference sample (n = 364); the variability of the distributions of each sample size class is shown in Figure 6C.
Comparison of confidence bands: The confidence bands constructed with 70 %, 80 % and 90 % of the reference sample were not different from those constructed with 100 % of the reference sample according to Dunnett's family-wise confidence intervals (α = 0.05) (Figure 6D).
Conservation status
Most of the forest stands were classified as second-growth: 54 % were assigned to the intermediate regeneration stage; 41 % to the advanced regeneration stage; and only 3 % to the old-growth stage, while scarcely 2 % to the initial regeneration stage.
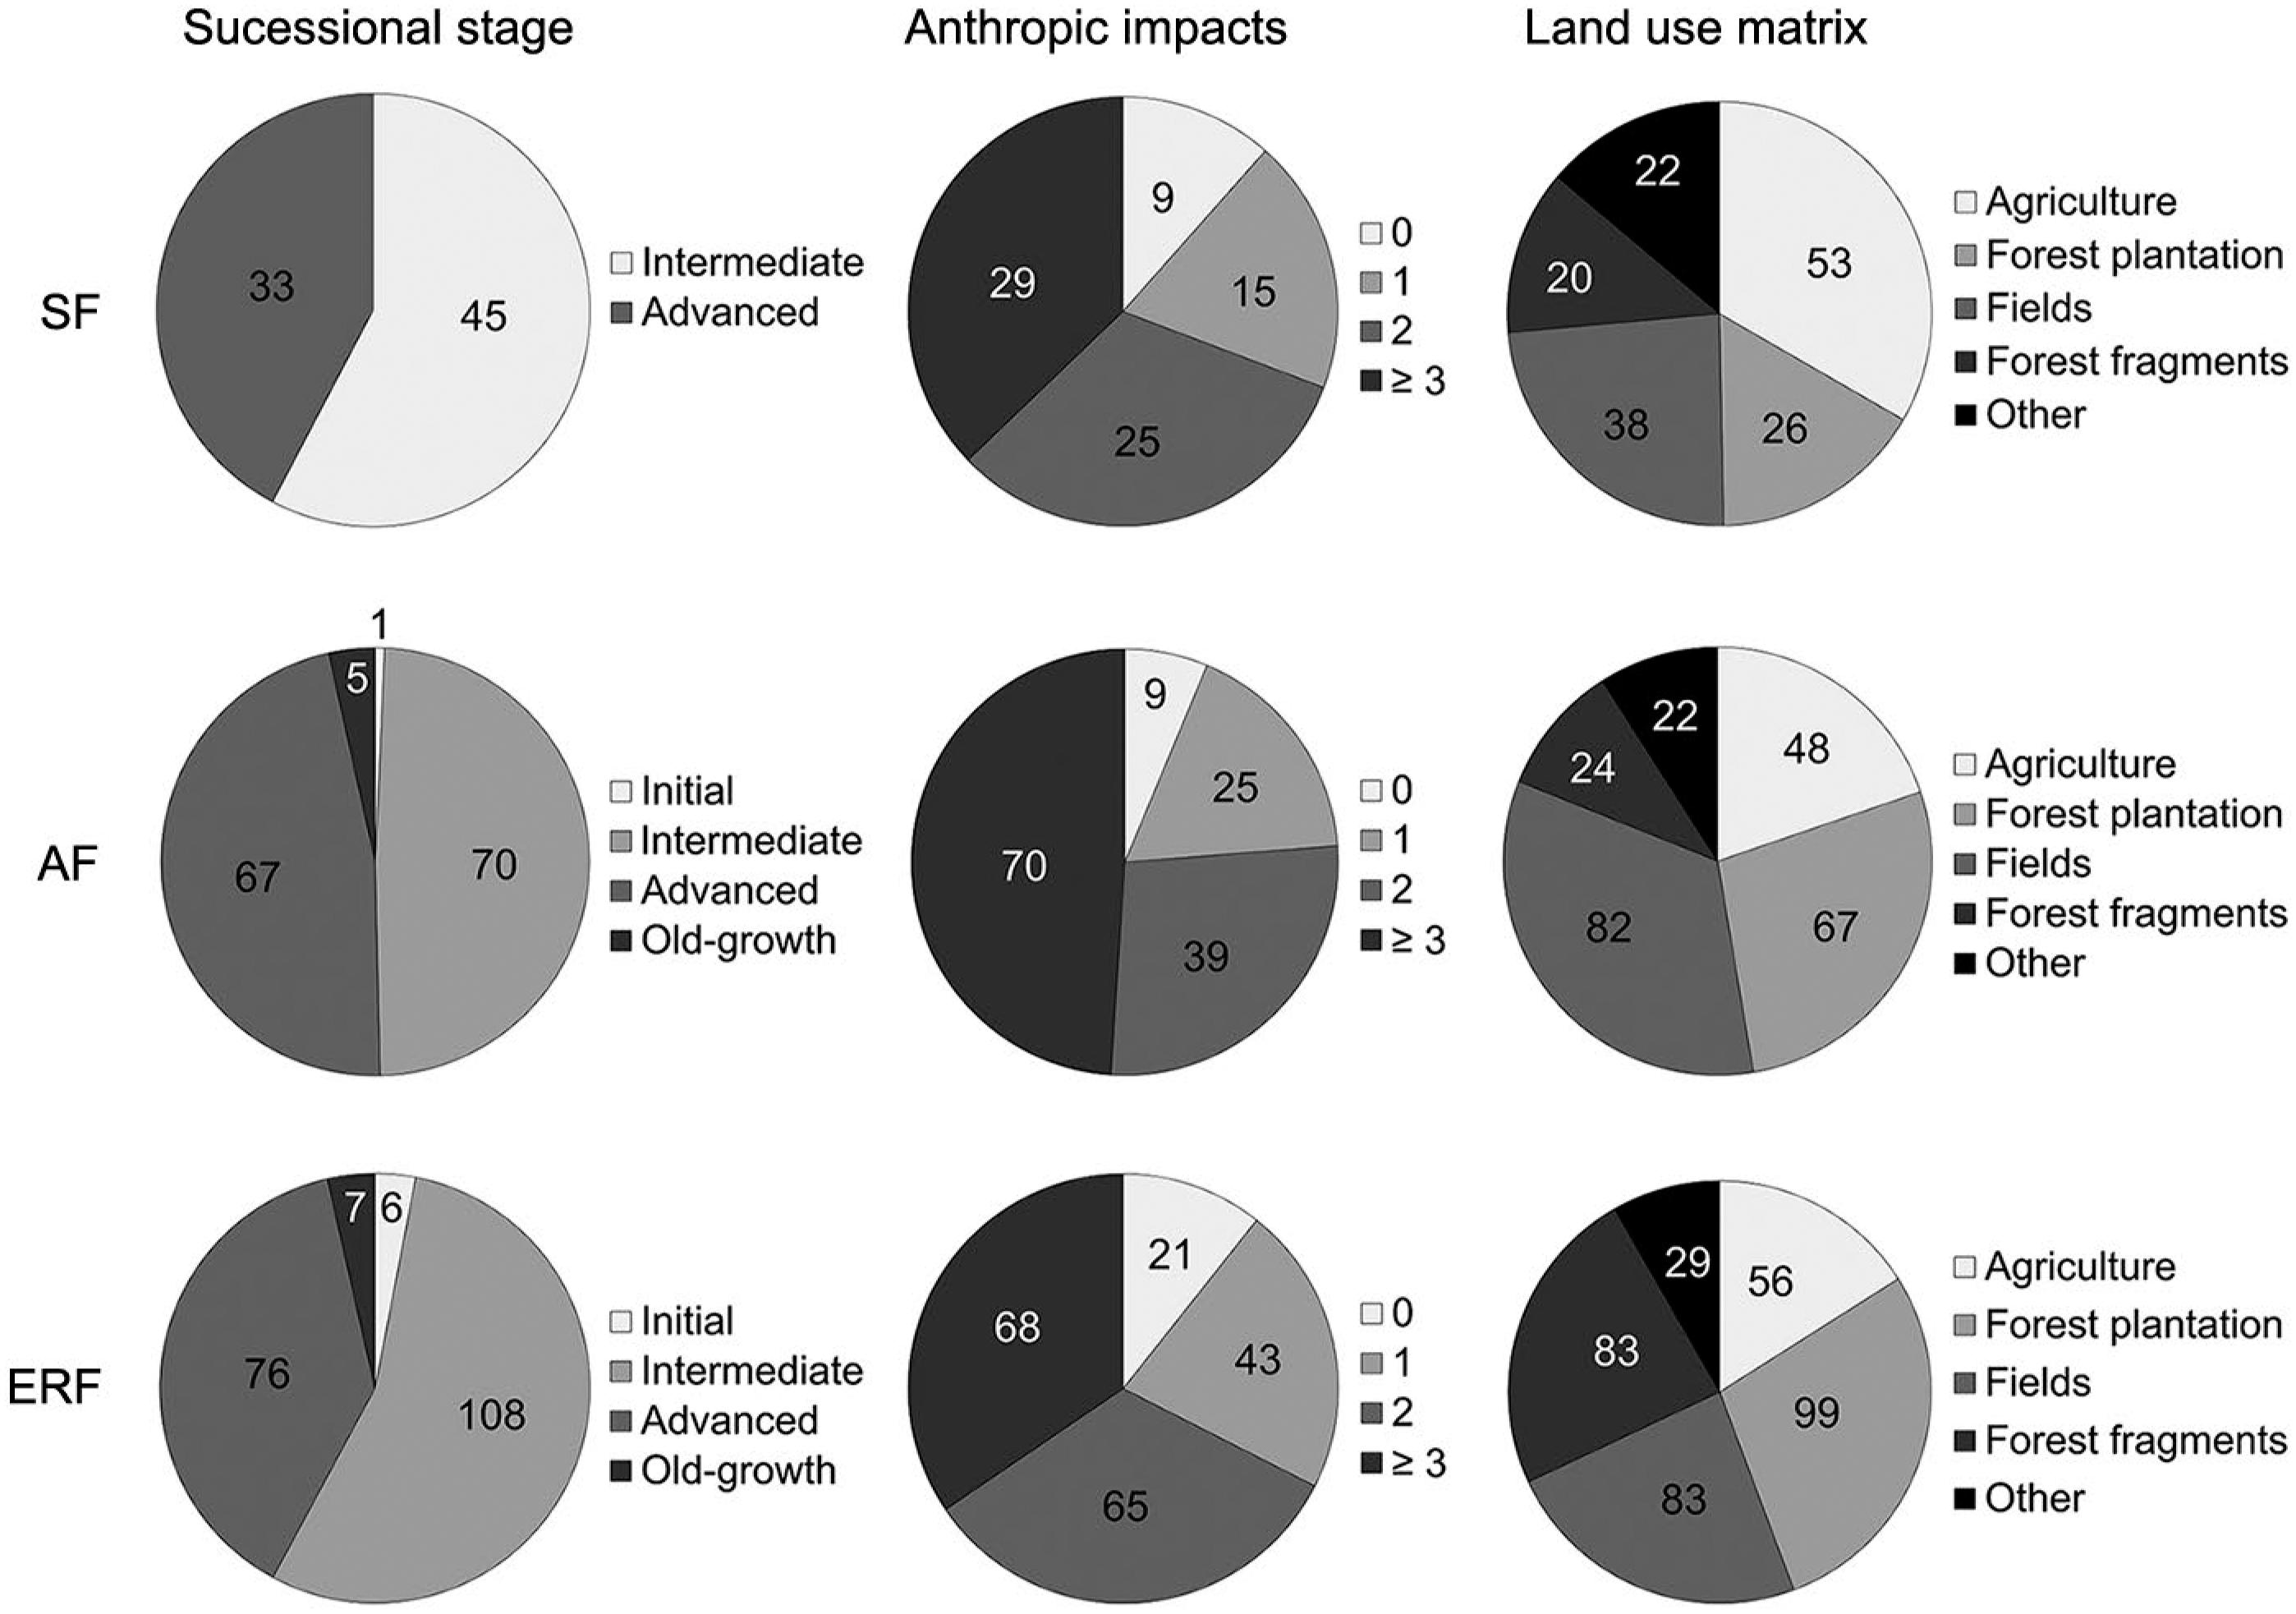
The main anthropic impacts in forests (often occurring simultaneously) were illegal selective logging, clear cutting, fire, understory mowing, and understory cattle grazing/trampling. These impacts were probably intensified by surrounding land uses, such as those associated with agriculture, pastures, and forest plantations (Figure 7).
Number of sample plots classified into different successional stages, anthropic impacts and land use in the sample plots’ surroundings. SF = semi-deciduous forest (n = 78); AF = Araucaria forest (n = 143); ERF = evergreen rainforest (n = 197). The anthropic impacts classes refer to the number of impacts observed within the sample plot.
Discussion
Insights on floristic representativeness
It is not a trivial task to assess the γ-diversity of complex (sub)tropical forest types, as most species have small populations or restricted spatial distribution, or are even habitat specialists (Caiafa and Martins, 2010Caiafa, A.N.; Martins, F.R. 2010. Forms of rarity of tree species in the southern Brazilian Atlantic rainforest. Biodiversity Conservation 19: 2597–2618.; Ricklefs, 2000Ricklefs, R.E. 2000. Rarity and diversity in Amazonian forest trees. Trends in Ecology & Evolution 15: 83–84.). Using the IFFSC data, Rezende et al. (2014)Rezende, V.L.; Oliveira-Filho, A.T.; Eisenlohr, P.V.; Kamino, L.H.Y.; Vibrans, A.C. 2014. Restricted geographic distribution of tree species calls for urgent conservation efforts in the Subtropical Atlantic Forest. Biodiversity and Conservation 24: 1057–1071. showed that ∼72 % of the tree species growing in Santa Catarina present a restricted geographical distribution. A simulation based on the IFFSC data revealed the species recording capacity of two grids with different densities: when nonparametric species richness estimators were applied using data from a 20 km × 20 km grid, richness estimates were even smaller than the observed richness attained by a 10 km × 10 km grid (Oliveira et al., 2016Oliveira, L.Z.; Moser, P.; Vibrans, A.C.; Piazza, G.A.; Gasper, A.L.; Oliveira-Filho, A.T. 2016. Insights for selecting the most suitable nonparametric species richness estimators for subtropical Brazilian Atlantic Forests. Brazilian Journal of Botany 39: 593–603.). Moreover, another challenge is related to the botanical identification of material collected in highly diverse forests. Altogether, the IFFSC featured up to 36 volunteer specialists around the country and abroad for identifying its huge amount of botanical material.
Despite all efforts, a considerable number of species (∼150) listed in previous studies was not registered (Gasper et al., 2013aGasper, A.L.; Sevegnani, L.; Vibrans, A.C.; Sobral, M.; Uhlmann, A.; Lingner, D.V.; Rigon-Júnior, M.J.; Verdi, M.; Stival-Santos, A.; Dreveck, S.; Korte, A. 2013a. Flora of the mixed ombrophyllous forest in Santa Catarina state, according of the forest and floristic inventory of Santa Catarina. Rodriguésia 64: 201–210 (in Portuguese, with abstract in English).,bGasper, A.L.; Uhlmann, A.; Sevegnani, L.; Lingner, D.V.; Rigon-Júnior, M.J., Verdi, M.; Stival-Santos, A.; Dreveck, S.; Sobral, M.; Vibrans, A.C. 2013b. Floristic and Forest Inventory of Santa Catarina: species of Seasonal Deciduous Forests. Rodriguésia 64: 427–443 (in Portuguese, with abstract in English).; Gasper et al., 2014Gasper, A.L.; Uhlmann, A.; Sevegnani, L.; Meyer, L.; Lingner, D.V.; Verdi, M.; Stival-Santos, A.; Sobral, M.; Vibrans, A.C. 2014. Floristic and Forest Inventory of Santa Catarina: species of evergreen rainforest. Rodriguésia 65: 807–816.). Between the 1950s and 1960s, pioneer vegetation studies in 180 one hectare plots were conducted in Santa Catarina (Reitz, 1965Reitz, R. 1965. Collection plan. In: Reitz, R., ed. Illustrated Flora of Santa Catarina. = Plano de coleção. Flora Ilustrada de Santa Catarina. Herbário Barbosa Rodrigues, Itajaí, SC, Brazil (in Portuguese).). The present study was concluded nearly 50 years later; in the intervening period, the state suffered from continuous and intense deforestation (Ribeiro et al., 2009Ribeiro, M.C.; Metzger, J.P.; Martensen, A.C.; Ponzoni, F.J.; Hirota, M.M. 2009. The Brazilian Atlantic forest: how much is left, and how is the remaining forest distributed? Implications for conservation. Biological Conservation 142: 1141–1153.); nevertheless, the state still has one of the most substantial native forest covers in Brazil. Even with the advance of deforestation, the IFFSC recorded 831 tree/shrub species within 418 sample plots; this number illustrates the NFI's potential of recording an impressive richness of tree species.
Therefore, considering that the sampling design of national or regional inventories must accomplish multiple goals, the species richness estimates presented in this study may still be regarded as satisfactory, suggesting that only species with small and geographically restricted populations were not recorded. It is not just restricted geographical distributions and small populations that are an issue, as missing species may be more abundant in specific environments, such as riparian vegetation or remote old-growth forests. However, we cannot discard the possibility that these ‘occult species’ have indeed vanished due to strong anthropic activities over time, such as logging and land use changes.
The above issues may be appeased by increasing the collection efforts (Feeley and Silman, 2011Feeley, K.J.; Silman, M.R. 2011. Keep collecting: accurate species distribution modelling requires more collections than previously thought. Diversity and Distributions 17: 1132–1140.). In this sense, the IFFSC carried out a concomitant ‘extra floristic survey’, which made efforts to collect not only fertile vascular plants in the sample plots, but also any accessible fertile species in their surroundings and access tracks (Gasper et al., 2013aGasper, A.L.; Sevegnani, L.; Vibrans, A.C.; Sobral, M.; Uhlmann, A.; Lingner, D.V.; Rigon-Júnior, M.J.; Verdi, M.; Stival-Santos, A.; Dreveck, S.; Korte, A. 2013a. Flora of the mixed ombrophyllous forest in Santa Catarina state, according of the forest and floristic inventory of Santa Catarina. Rodriguésia 64: 201–210 (in Portuguese, with abstract in English).,bGasper, A.L.; Uhlmann, A.; Sevegnani, L.; Lingner, D.V.; Rigon-Júnior, M.J., Verdi, M.; Stival-Santos, A.; Dreveck, S.; Sobral, M.; Vibrans, A.C. 2013b. Floristic and Forest Inventory of Santa Catarina: species of Seasonal Deciduous Forests. Rodriguésia 64: 427–443 (in Portuguese, with abstract in English).; Gasper et al., 2014Gasper, A.L.; Uhlmann, A.; Sevegnani, L.; Meyer, L.; Lingner, D.V.; Verdi, M.; Stival-Santos, A.; Sobral, M.; Vibrans, A.C. 2014. Floristic and Forest Inventory of Santa Catarina: species of evergreen rainforest. Rodriguésia 65: 807–816.). Although this may have augmented the time frame needed to conclude the measurement of the trees in a sample plot, it stood as an effective low-budget workaround to increase the understanding of the state's flora, as well as to enrich its herbariums, and other relevant databases, such as the NeoTropTree, GFBI (Global Forest Biodiversity Initiative), and sPlot/GIVD (Global Index of Vegetation-Plot Databases) (Jansen et al., 2012Jansen, F.; Glöckler, F.; Chytrý, M.; Cáceres, M.; Ewald, J.; Finckh, M.; Lopez-Gonzalez, G.; Oldeland, G.; Peet, R.K.; Chaminée, J.H.J.; Dengler, J. 2012. News from the Global Index of Vegetation-Plot Databases (GIVD): the metadata platform, available data, and their properties. Biodiversity & Ecology 4: 77–82.; Liang et al., 2016Liang, J.; Crowther, T.W.; Picard, N.; Wiser, S.; Zhou, M.; Alberti, G.; Schulze, E.; McGuire, A.D.; Bozzato, F.; Pretzsch, H.; de-Miguel, S.; Paquette, A.; Hérault, B.; Scherer-Lorenzen, M.; Barrett, C.B.;Glick, H.B.; Hengeveld, G.M.; Nabuurs, G.-J., Pfautsch, S.; Viana, H.; Vibrans, A.C.;Ammer, C.; Schall, P.; Verbyla, D.;Tchebakova, N.;Fischer, M.; Watson, J.V.; Chen, H.Y.H.; Lei, X.; Schelhaas, M.-J.;Lu, H.; Gianelle, D.; Parfenova, E.I.; Salas, C.; Lee, E.; Lee, B.; Kim, H.S.;Bruelheide, H.; Coomes, D.A.; Piotto, D.; Sunderland, T.;Schmid, B.;Gourlet-Fleury, S.; Sonké, B.; Tavani, R.; Zhu, J.; Brandl, S.; Vayreda, J.;Kitahara, F.; Searle, E.B.; Neldner, V.J.; Ngugi, M.R.; Baraloto, C.; Frizzera, L.;Bałazy, R.; Oleksyn, J.; Zawiła-Niedźwiecki, T.; Bouriaud, O.; Bussotti, F.;Finér, L.; Jaroszewicz, B.; Jucker, T.; Valladares, F.; Jagodzinski, A.M.; Peri, P.L.; Gonmadje, C.; Marthy, W.; O’Brien, T.; Martin, E.H.; Marshall, A.R.; Rovero, F.; Bitariho, R.; Niklaus, P.A.; Alvarez-Loayza, P.; Chamuya, N.; Valencia, R.; Mortier, F.; Wortel, V.; Engone-Obiang, N.L.;Ferreira, L.V.; Odeke, D.E.; Vasquez, R.M.; Lewis, S.L.; Reich, P.B. 2016. Positive biodiversity-productivity relationship predominant in global forests. Science 354: aaf8957.; Oliveira-Filho et al., 2017Oliveira-Filho, A.T. 2017. NeoTropTree: Tree flora of the neotropical region: a database involving biogeography, diversity and conservation. Available at: http://www.neotroptree.info/ [Accessed Feb 6, 2018]
http://www.neotroptree.info/...
). Accordingly, another 1,352 species of vascular plants were recorded by the extra floristic survey, with an average of 26 fertile plants per sample plot. In addition, two new species have been described so far (Silva and Costa, 2011Silva, J.G.; Costa, A.F. 2011. A Taxonomic revision of Vriesea corcovadensis group (Bromeliaceae: Tillandsioideae) with description of two new species. Systematic Botany 36: 291–309.; Pessoa and Alves, 2015Pessoa, E.; Alves, M. 2015. Three new species of Campylocentrum (Vandeae, Orchidaceae) from Brazil. Phytotaxa 217: 265–272.).
Hence, NFIs―especially those in (sub)tropical countries―could develop similar methodologies to enhance their databases, thus contributing to regional and broader biodiversity assessments (Chirici et al., 2012Chirici, G.; McRoberts, R.E.; Winter, S.; Bertini, R.; Brändli, U.; Asensio, I.A.; Bastrup-Birk, A.; Rondeux, J.; Barsoum, N.; Marchetti, M. 2012. National Forest Inventory contributions to forest biodiversity monitoring. Forest Science 58: 257–268.). As the number of recorded species is related to the survey time (Zhang et al., 2014Zhang, J.; Nielsen, S.E.; Grainger, T.N.; Kohler, M.; Chipchar, T.; Farr, D.R. 2014. Sampling plant diversity and rarity at landscape scales: importance of sampling time in species detectability. PLoS One 9: e95334.), the amount of time to be spent on an ‘extra floristic survey’ or similar may be planned based on cost-efficiency trade-offs and the current political and social demands related to plant biodiversity conservation (Gardner, 2010Gardner, T. 2010. Monitoring Forest Biodiversity: Improving Conservation through Ecologically Responsible Management. Earthscan, London, UK.).
Floristic representativeness at the forest stand level (or even at broader scales), as assessed in our study, is not a major concern in most NFIs (Tomppo et al., 2010Tomppo, E.; Gschwantner, T.; Lawrence, M.; McRoberts, R.E. 2010. National Forest Inventories: Pathways for Common Reporting. Springer, Dordrecht, The Netherlands.). As an exception to the general rule, Scolforo et al. (2008)Scolforo, J.R.; Oliveira, A.D.; Mello, J.M.; Silva, C.P.C.; Guedes, I.C.L.; Andrade, I.S.; Abreu, E.C.R. 2008. Sampling sufficiency of seasonal deciduous forests. = Suficiência amostral para a fisionomia floresta estacional decidual. p. 89-95. In: Mello, J.M.; Scolforo, J.R.; Carvalho, L.M.T., eds. In: Forest Inventory of Minas Gerais: Seasonal deciduous forests: floristics, structure, similarity, diameter and height distribution, volumetry, increment and management tendencies. = Inventário florestal de Minas Gerais: floresta estacional decidual: florística, estrutura, similaridade, distribuição diamétrica e de altura, volumetria, tendências de crescimento e manejo florestal. Editora UFLA, Lavras, MG, Brazil (in Portuguese). fitted linear plateau regressions to the curves of the accumulated tree species richness per sampled area to assess floristic representativeness in the Minas Gerais State Forest Inventory in Brazil. Assessing the reliability of species richness estimates at the forest stand level, and thus evaluating it on a broader scale such as an entire state or country, may be an essential step in the planning of forest policies including forest conservation, restoration, management, and the payment for ecosystem services (Gardner, 2010Gardner, T. 2010. Monitoring Forest Biodiversity: Improving Conservation through Ecologically Responsible Management. Earthscan, London, UK.). Thus, the proposed algorithm for testing Cain and Castro's 10/10 % criterion is a straightforward tool for obtaining stronger evidence regarding floristic representativeness than, for instance, the classic (and subjective) search for an asymptotic curve of accumulated species richness per sampled area, which is not easily reached in diverse (sub)tropical forests (Condit et al., 1996Condit, R.; Hubbell, S.P.; Lafrankie, J.V.; Sukumar, R.; Manokaran, N.; Foster, R.B.F.; Ashton, P.S. 1996. Species-area and species individual relationships for tropical trees: a comparison of three 50-ha plots. Journal of Ecology 8: 549–562.). In summary, our findings suggest that a thorough sampling effort is required to generate reliable species richness estimates at the forest type level. Even though nonparametric estimators may suffice as feasible and low-biased tools for the Brazilian NFI (Oliveira et al., 2016Oliveira, L.Z.; Moser, P.; Vibrans, A.C.; Piazza, G.A.; Gasper, A.L.; Oliveira-Filho, A.T. 2016. Insights for selecting the most suitable nonparametric species richness estimators for subtropical Brazilian Atlantic Forests. Brazilian Journal of Botany 39: 593–603.), it is worth considering that their estimates are never greater than twice the value recorded in the sample plots (Smith and van Belle, 1984Smith, E.P.; van Belle, G. 1984. Nonparametric estimation of species richness. Biometrics 49: 119–129.). Moreover, Gardner (2010)Gardner, T. 2010. Monitoring Forest Biodiversity: Improving Conservation through Ecologically Responsible Management. Earthscan, London, UK. states that the lack of reliable data regarding species diversity will prevent the establishment of management strategies and definition of priority areas for conservation. Inasmuch as NFIs may concentrate their efforts in collecting and selecting indicators related to forest structural diversity (Chirici et al., 2012Chirici, G.; McRoberts, R.E.; Winter, S.; Bertini, R.; Brändli, U.; Asensio, I.A.; Bastrup-Birk, A.; Rondeux, J.; Barsoum, N.; Marchetti, M. 2012. National Forest Inventory contributions to forest biodiversity monitoring. Forest Science 58: 257–268.), which are undoubtedly important (McElhinny et al., 2005McElhinny, C.; Gibbons, P.; Brack, C.; Bauhus, J. 2005. Forest and woodland stand structural complexity: its definition and measurement. Forest Ecology and Management 218: 1–24.), species diversity data will always be useful and cannot be sufficiently predicted through standalone forest structure indicators (Gardner, 2010Gardner, T. 2010. Monitoring Forest Biodiversity: Improving Conservation through Ecologically Responsible Management. Earthscan, London, UK.).
Sampling sufficiency of forest attributes
The investigation of the influence of different sample sizes on inferences regarding the mean basal area (m² ha−1) for the entire state of Santa Catarina revealed interesting results. Sampling sufficiency would be achieved by measuring about 50 to 100 sample plots. The estimated confidence intervals would not be dramatically improved after n ≈ 248 (about 70 % of the reference sample, n = 364), thereby reaching a narrow width (± ∼5 % of the sample mean).
The reduced sample size required for sufficiency may reflect the structural homogenization of the forest stands sampled in the three forest types. It was to be expected that samples from a systematic forest inventory covering a complex area in terms of biogeographic fluctuation would present an attenuated variability of forest attributes, such as basal area. Hence, the structural variability among forest stands would be triggered by forests growing on sites with more constricted environmental conditions, such as rocky dystrophic soils, or in sites prone to host exuberant vegetation with many layers and large trees. Given this, old populations of species like A. angustifolia in the AF, Ocotea catharinensis Mez in the ERF, and Apuleia leiocarpa (Vogel) J.F. Macbr. in the SF, would, most likely, be drivers of forest heterogeneity among sample plots.
So far, the basal area can be considered sufficiently sampled by the IFFSC. The sample effort in subsequent remeasurement cycles could be reduced, and thus focused on forest increment, as species richness was assessed in the first cycle. However, as mentioned above, reliable estimates of species richness in highly diverse forests require a thorough sampling approach, far more exacting than the requirements to achieve satisfactory estimates of the population parameters of forest attributes.
Conservation status
As a general observation, great γ-diversity is in contrast with small α-diversity. As shown by Gasper et al. (2013aGasper, A.L.; Sevegnani, L.; Vibrans, A.C.; Sobral, M.; Uhlmann, A.; Lingner, D.V.; Rigon-Júnior, M.J.; Verdi, M.; Stival-Santos, A.; Dreveck, S.; Korte, A. 2013a. Flora of the mixed ombrophyllous forest in Santa Catarina state, according of the forest and floristic inventory of Santa Catarina. Rodriguésia 64: 201–210 (in Portuguese, with abstract in English).,bGasper, A.L.; Uhlmann, A.; Sevegnani, L.; Lingner, D.V.; Rigon-Júnior, M.J., Verdi, M.; Stival-Santos, A.; Dreveck, S.; Sobral, M.; Vibrans, A.C. 2013b. Floristic and Forest Inventory of Santa Catarina: species of Seasonal Deciduous Forests. Rodriguésia 64: 427–443 (in Portuguese, with abstract in English).; Gasper et al., 2014Gasper, A.L.; Uhlmann, A.; Sevegnani, L.; Meyer, L.; Lingner, D.V.; Verdi, M.; Stival-Santos, A.; Sobral, M.; Vibrans, A.C. 2014. Floristic and Forest Inventory of Santa Catarina: species of evergreen rainforest. Rodriguésia 65: 807–816.), the IFFSC's sample plot survey plus the extra floristic survey recorded in the SF, AF, and ERF, respectively, 420, 925 and 1,473 vascular plant species, or 62 %, 43 % and 19 % of all species registered in the Atlantic Forest by Stehmann et al. (2009)Stehmann, J.R.; Forzza, R.C.; Salino, A.; Sobral, M.; Costa, D.P.; Kamino, L.H.Y. 2009. Plants of the Atlantic Forest. = Plantas da Floresta Atlântica. Jardim Botânico do Rio de Janeiro, Rio de Janeiro, RJ, Brazil (in Portuguese).. Down at the local level, the IFFSC found a mean of only 31 (14), 29 (13) and 53 (55) tree species by sample plot in the canopy layer (and understory/regeneration layer), and 18.1, 24.4 and 21.8 m² ha−1 of basal area in the SF, AF and ERF, respectively.
These estimates regarding young-aged, second-growth or intensively exploited stands with reduced species richness and basal area are less than half of that expected in well-conserved old-growth forests. Comparisons with well-conserved forests in southern Brazil support this finding: Kilca and Longhi (2011)Kilca, V.R.; Longhi, J.S. 2011. Composition and structure of secondary forests at the souther border of the plateau. p. 53-83. In: Schumacher, M.V.; Lognhi, S.J.; Brun, E.J.; Kilca, R.V., eds. The subtropical seasonal forest: description and ecology at the southern border of the plateau.. Pallotti, Santa Maria, RS, Brazil. (in Portuguese, with abstract in English). found approximately 52 tree species and up to 37 m² of basal area in 1 ha of an old-growth SF stand. Jarenkow and Budke (2009)Jarenkow, J.A.; Budke, J.C. 2009. Floristic patterns and strucuture analysis of Araucaria forest remnants.. p. 113-126. In: Fonseca, C.R.; Souza, A.F.; Leal-Zanchet, A.M.; Dutra, T.; Backes, A.; Ganado, D., eds. Araucaria forests: ecology, conservation and sustainable development.. Holos, Ribeirão Preto, SP, Brazil. (in Portuguese, with abstract in English). mentioned 120 species ha−1, 50 m² ha−1 of basal area, and 38 m of canopy height as features of well-conserved old-growth AF stands. In turn, Maçaneiro et al. (2016)Maçaneiro, J.P.; Oliveira, L.Z.; Eisenlohr, P.V.; Schorn, L.A. 2016. Paradox between species diversity and conservation: a subtropical Atlantic Forest Reserve in Brazil has similar tree species diversity to unprotected sites in the same region. Tropical Conservation Science 9: 1–19. reported 144 woody species in ∼1 ha of an old-growth ERF stand. As a word of caution, a caveat regarding basal area should be acknowledged: this attribute by itself may not be the most powerful indicator of conservation status, as second-growth forests may present substantial basal area values, even without having reached late successional stages, as shown by Guariguata and Ostertag (2001)Guariguata, M.R.; Ostertag, R. 2001. Neotropical secondary forest succession: changes in structural and functional characteristics. Forest Ecology and Management 148: 185–206..
Especially alarming is the small number of understory/regeneration species in the SF and AF compared to the number of canopy species. Understory mowing and cattle grazing/trampling are putting the forests’ future at risk, not only in southern Brazil but also in other regions of the country (Pereira et al., 2015Pereira, J.A.A.; Oliveira-Filho, A.T.; Eisenlohr, P.V.; Miranda, P.L.S.; Lemos Filho, J.P. 2015. Human impacts affect tree community features of 20 forest fragments of a vanishing neotropical hotspot. Environmental Management 55: 296–307.; Vibrans et al., 2011Vibrans, A.C.; Sevegnani, L., Uhlmann, A.; Schorn, L.A.; Sobral, M.G.; Gasper, A.L.; Lingner, D.V., Brogni, E.; Klemz, G.; Godoy, M.B.; Verdi, M. 2011. Structure of mixed ombrophyllous forests with Araucaria angustifolia (Araucariaceae) under external stress in southern Brazil. Revista de Biologia Tropical 59: 1371–1387.). The lack of regeneration and understory impoverishment invoke similarities to the ‘empty forests’ described by Richards (1996)Richards, P.W. 1996. The Tropical Rain Forest: An Ecological Study. Cambridge University Press, Cambridge, UK. as being in the process of regressive succession due to continuous degrading impacts. The cattle grazing inside forest stands and understory mowing remain as a cultural heritage of European settlers who often implemented silvopastoral systems called faxinal and caíva: forest stands were maintained for the sake of managing tree species of interest, while animals were raised beneath the forest canopy, drastically reducing the understory species richness.
Most of the forests in the study area seemed to be between 50 and 80 years old; this perception was confirmed by the results of an associated dendrochronological study (Lisi et al., 2008Lisi, C.S.; Fo, M.T.; Botosso, P.C.; Roig, F.A.; Maria, V.R.B.; Ferreira-Fedele, L.; Voigt, A.R.A. 2008. Tree-ring formation, radial increment periodicity, and phenology of tree species from a seasonal semi-deciduous forest in southeast Brazil. IAWA Journal 29: 189–207.). It might suggest that such young forests started their regeneration process in the middle of the 20th century. This period matches the peak of the deforestation process in Santa Catarina according to evidence reported by Baptista and Rudel (2006)Baptista, S.R.; Rudel, T.K. 2006. A re-emerging Atlantic forest? Urbanization, industrialization and the forest transition in Santa Catarina, southern Brazil. Environmental Conservation 33: 195–202..
Conclusions
The conclusions of this study are fourfold. First, through this regional inventory, satisfactory estimates of species richness for both stand and forest type levels were achieved. These provided evidence of contrasting great γ-diversity and small α-diversity. Broadly speaking, the great number of observed species illustrates the NFI's potential for recording an impressive amount of data, as well as the importance of continuous plant collection for conservation and scientific purposes.
Second, the small number of understory/regeneration species may be the result of canopy opening, which generates inadequate conditions for shade tolerant species, and of continuous negative impacts such as cattle grazing and understory mowing.
Third, through the investigation of the influence of different sample sizes on the estimates of parametric confidence intervals for forest attributes, it was found that the intervals did not become narrower when constructed using more than 70 % of the reference sample; hence, the sample size could be reduced in future remeasurements.
Fourth, Santa Catarina's forest cover is composed mainly of floristically and structurally simplified second-growth forests in the process of regeneration after intensive logging or clear cutting practices conducted in the last century. Such forests are characterized by young and small trees, low-merchantable stocks and the absence of typical tree species found in old-growth forests.
Acknowledgments
The authors thank the Fundação de Amaparo à Pesquisa e Inovação de Santa Catarina (FAPESC) for supporting the Inventário Florístico Florestal de Santa Catarina(IFFSC - grant number 2015TR441, 2016TR2524) and the Conselho Nacional de Desenvolvimento Científico e Tecnológico (CNPq) for the research grant awarded to the first author (312075/2013-8). The authors are grateful to Marcos Sobral and his colleagues for screening more than 100,000 collected specimens and to 36 associated taxonomists for identifying the botanical material.
We dedicate this study to the memory of Lucia Sevegnani (1959-2015) who continually encouraged, with enthusiasm and dedication, young students and plant diversity research in Santa Catarina, persistently championing the causes of biological conservation and ecological education.
References
- Alvares, C.A.; Stape, J.L.; Sentelhas, P.C.; Gonçalves, J.L.M.; Sparovek, G. 2013. Köppen's climate classification map for Brazil. Meteorologische Zeitschrift 22: 711–728.
- Angiosperm Phylogeny Group [APG]. 2016. An update of the Angiosperm Phylogeny Group classification for the orders and families of flowering plants: APG IV. Botanical Journal of the Linnean Society 181: 1–20.
- Baptista, S.R.; Rudel, T.K. 2006. A re-emerging Atlantic forest? Urbanization, industrialization and the forest transition in Santa Catarina, southern Brazil. Environmental Conservation 33: 195–202.
- Caiafa, A.N.; Martins, F.R. 2010. Forms of rarity of tree species in the southern Brazilian Atlantic rainforest. Biodiversity Conservation 19: 2597–2618.
- Cain, S.A.; Castro, G.M.O. 1959. Manual of Vegetation Analysis. Harper, New York, NY, USA.
- Chao, A.; Gotelli, N.J.; Hsieh, T.C.; Sander, E.L.; Ma, K.H.; Colwell, R.K.; Ellison, A.M. 2014. Rarefaction and extrapolation with Hill numbers: a framework for sampling and estimation in species diversity studies. Ecological Monographs 84: 45–67.
- Chirici, G.; McRoberts, R.E.; Winter, S.; Bertini, R.; Brändli, U.; Asensio, I.A.; Bastrup-Birk, A.; Rondeux, J.; Barsoum, N.; Marchetti, M. 2012. National Forest Inventory contributions to forest biodiversity monitoring. Forest Science 58: 257–268.
- CNCFlora. 2018. National Center of Flora Conservation = Centro Nacional de Conservação da Flora. Available at: http://cncflora.jbrj.gov.br [Accessed June 8, 2018] (in Portuguese).
» http://cncflora.jbrj.gov.br - Cochran, W.G. 1977. Sampling Techniques. 3ed. John Wiley, New York, NY, USA.
- Colwell, R.K.; Chao, A.; Gotelli, N.J.; Lin, S.Y.; Mao, C.X.; Chazdon, R.L.; Longino, J.T. 2012. Models and estimators linking individual-based and sample-based rarefaction, extrapolation and comparison of assemblages. Journal of Plant Ecology 5: 3–21.
- Condit, R.; Hubbell, S.P.; Lafrankie, J.V.; Sukumar, R.; Manokaran, N.; Foster, R.B.F.; Ashton, P.S. 1996. Species-area and species individual relationships for tropical trees: a comparison of three 50-ha plots. Journal of Ecology 8: 549–562.
- Feeley, K.J.; Silman, M.R. 2011. Keep collecting: accurate species distribution modelling requires more collections than previously thought. Diversity and Distributions 17: 1132–1140.
- Jardim Botânico do Rio de Janeiro [JBRJ]. Brazilian Flora 2020. = Flora do Brasil 2020. 2017. Available at: http://floradobrasil.jbrj.gov.br/ [Accessed Jul 4, 2017] (in Portuguese).
» http://floradobrasil.jbrj.gov.br/ - Freitas, J.V.; Oliveira, Y.M.; Rosot, M.A.D.; Gomide, G.L.A.; Mattos, P.P. 2010. National Forest Inventories: Brazil. p. 89–96. In: Tomppo, E.; Gschwantner, T.; Lawrence, M.; McRoberts, R.E., eds. National Forest Inventories: pathways for common reporting. Springer, Amsterdam, The Netherlands.
- Gardner, T. 2010. Monitoring Forest Biodiversity: Improving Conservation through Ecologically Responsible Management. Earthscan, London, UK.
- Gasper, A.L.; Sevegnani, L.; Vibrans, A.C.; Sobral, M.; Uhlmann, A.; Lingner, D.V.; Rigon-Júnior, M.J.; Verdi, M.; Stival-Santos, A.; Dreveck, S.; Korte, A. 2013a. Flora of the mixed ombrophyllous forest in Santa Catarina state, according of the forest and floristic inventory of Santa Catarina. Rodriguésia 64: 201–210 (in Portuguese, with abstract in English).
- Gasper, A.L.; Uhlmann, A.; Sevegnani, L.; Lingner, D.V.; Rigon-Júnior, M.J., Verdi, M.; Stival-Santos, A.; Dreveck, S.; Sobral, M.; Vibrans, A.C. 2013b. Floristic and Forest Inventory of Santa Catarina: species of Seasonal Deciduous Forests. Rodriguésia 64: 427–443 (in Portuguese, with abstract in English).
- Gasper, A.L.; Uhlmann, A.; Sevegnani, L.; Meyer, L.; Lingner, D.V.; Verdi, M.; Stival-Santos, A.; Sobral, M.; Vibrans, A.C. 2014. Floristic and Forest Inventory of Santa Catarina: species of evergreen rainforest. Rodriguésia 65: 807–816.
- Guariguata, M.R.; Ostertag, R. 2001. Neotropical secondary forest succession: changes in structural and functional characteristics. Forest Ecology and Management 148: 185–206.
- Jansen, F.; Glöckler, F.; Chytrý, M.; Cáceres, M.; Ewald, J.; Finckh, M.; Lopez-Gonzalez, G.; Oldeland, G.; Peet, R.K.; Chaminée, J.H.J.; Dengler, J. 2012. News from the Global Index of Vegetation-Plot Databases (GIVD): the metadata platform, available data, and their properties. Biodiversity & Ecology 4: 77–82.
- Jarenkow, J.A.; Budke, J.C. 2009. Floristic patterns and strucuture analysis of Araucaria forest remnants.. p. 113-126. In: Fonseca, C.R.; Souza, A.F.; Leal-Zanchet, A.M.; Dutra, T.; Backes, A.; Ganado, D., eds. Araucaria forests: ecology, conservation and sustainable development.. Holos, Ribeirão Preto, SP, Brazil. (in Portuguese, with abstract in English).
- Kilca, V.R.; Longhi, J.S. 2011. Composition and structure of secondary forests at the souther border of the plateau. p. 53-83. In: Schumacher, M.V.; Lognhi, S.J.; Brun, E.J.; Kilca, R.V., eds. The subtropical seasonal forest: description and ecology at the southern border of the plateau.. Pallotti, Santa Maria, RS, Brazil. (in Portuguese, with abstract in English).
- Köhl, M.; Magnussen, S.S.; Marchetti, M. 2006. Sampling Methods, Remote Sensing and GIS Multiresource Forest Inventory. Springer, Heidelberg, Germany.
- Liang, J.; Crowther, T.W.; Picard, N.; Wiser, S.; Zhou, M.; Alberti, G.; Schulze, E.; McGuire, A.D.; Bozzato, F.; Pretzsch, H.; de-Miguel, S.; Paquette, A.; Hérault, B.; Scherer-Lorenzen, M.; Barrett, C.B.;Glick, H.B.; Hengeveld, G.M.; Nabuurs, G.-J., Pfautsch, S.; Viana, H.; Vibrans, A.C.;Ammer, C.; Schall, P.; Verbyla, D.;Tchebakova, N.;Fischer, M.; Watson, J.V.; Chen, H.Y.H.; Lei, X.; Schelhaas, M.-J.;Lu, H.; Gianelle, D.; Parfenova, E.I.; Salas, C.; Lee, E.; Lee, B.; Kim, H.S.;Bruelheide, H.; Coomes, D.A.; Piotto, D.; Sunderland, T.;Schmid, B.;Gourlet-Fleury, S.; Sonké, B.; Tavani, R.; Zhu, J.; Brandl, S.; Vayreda, J.;Kitahara, F.; Searle, E.B.; Neldner, V.J.; Ngugi, M.R.; Baraloto, C.; Frizzera, L.;Bałazy, R.; Oleksyn, J.; Zawiła-Niedźwiecki, T.; Bouriaud, O.; Bussotti, F.;Finér, L.; Jaroszewicz, B.; Jucker, T.; Valladares, F.; Jagodzinski, A.M.; Peri, P.L.; Gonmadje, C.; Marthy, W.; O’Brien, T.; Martin, E.H.; Marshall, A.R.; Rovero, F.; Bitariho, R.; Niklaus, P.A.; Alvarez-Loayza, P.; Chamuya, N.; Valencia, R.; Mortier, F.; Wortel, V.; Engone-Obiang, N.L.;Ferreira, L.V.; Odeke, D.E.; Vasquez, R.M.; Lewis, S.L.; Reich, P.B. 2016. Positive biodiversity-productivity relationship predominant in global forests. Science 354: aaf8957.
- Lisi, C.S.; Fo, M.T.; Botosso, P.C.; Roig, F.A.; Maria, V.R.B.; Ferreira-Fedele, L.; Voigt, A.R.A. 2008. Tree-ring formation, radial increment periodicity, and phenology of tree species from a seasonal semi-deciduous forest in southeast Brazil. IAWA Journal 29: 189–207.
- Maçaneiro, J.P.; Oliveira, L.Z.; Eisenlohr, P.V.; Schorn, L.A. 2016. Paradox between species diversity and conservation: a subtropical Atlantic Forest Reserve in Brazil has similar tree species diversity to unprotected sites in the same region. Tropical Conservation Science 9: 1–19.
- Magurran, A.E. 2004. Measuring Biological Diversity. Blackwell, Oxford, UK.
- McElhinny, C.; Gibbons, P.; Brack, C.; Bauhus, J. 2005. Forest and woodland stand structural complexity: its definition and measurement. Forest Ecology and Management 218: 1–24.
- McRoberts, R.E.; Moser, P.; Oliveira, L.Z.; Vibrans, A.C. 2015. A general method for assessing the effects of uncertainty in individual-tree volume model predictions on large-area volume estimates with a subtropical forest illustration. Canadian Journal of Forest Research 45: 44–51.
- McRoberts, R.E.; Tomppo, E.O.; Vibrans, A.C.; Freitas, J.V. 2013. Design considerations for tropical forest inventories. Brazilian Journal of Forestry Research 33: 189–202.
- Netto, S.P. 1984. National Forest Inventory, native forests: Paraná and Santa Catarina. = Inventário Florestal Nacional, florestas nativas: Paraná e Santa Catarina. Instituto Brasileiro de Desenvolvimento Florestal, Brasília, DF, Brazil (in Portuguese).
- Oliveira, L.Z.; Moser, P.; Vibrans, A.C.; Piazza, G.A.; Gasper, A.L.; Oliveira-Filho, A.T. 2016. Insights for selecting the most suitable nonparametric species richness estimators for subtropical Brazilian Atlantic Forests. Brazilian Journal of Botany 39: 593–603.
- Oliveira-Filho, A.T. 2017. NeoTropTree: Tree flora of the neotropical region: a database involving biogeography, diversity and conservation. Available at: http://www.neotroptree.info/ [Accessed Feb 6, 2018]
» http://www.neotroptree.info/ - Oliveira-Filho, A.T.; Budke, J.C.; Jarenkow, J.A.; Eisenlohr, P.V.; Neves, D.R.M. 2015. Delving into the variations in tree species composition and richness across South American subtropical Atlantic and Pampean forests. Journal of Plant Ecology 8: 242–260.
- Pandolfo, C.; Braga, H.J.; Silva Junior, V.P.; Massignan, A.M.; Pereira, E.S.; Thomé, V.M.R. 2002. Climatologic Atlas of Santa Catarina State. = Atlas Climatológico do Estado de Santa Catarina. EPAGRI, Florianópolis, SC, Brazil (in Portuguese).
- Pereira, J.A.A.; Oliveira-Filho, A.T.; Eisenlohr, P.V.; Miranda, P.L.S.; Lemos Filho, J.P. 2015. Human impacts affect tree community features of 20 forest fragments of a vanishing neotropical hotspot. Environmental Management 55: 296–307.
- Pessoa, E.; Alves, M. 2015. Three new species of Campylocentrum (Vandeae, Orchidaceae) from Brazil. Phytotaxa 217: 265–272.
- Pteridophyte Phylogeny Group [PPG]. 2016. A community-derived classification for extant lycophytes and ferns. Journal of Systematics and Evolution 54: 563–603.
- Reitz, R. 1965. Collection plan. In: Reitz, R., ed. Illustrated Flora of Santa Catarina. = Plano de coleção. Flora Ilustrada de Santa Catarina. Herbário Barbosa Rodrigues, Itajaí, SC, Brazil (in Portuguese).
- Rezende, V.L.; Oliveira-Filho, A.T.; Eisenlohr, P.V.; Kamino, L.H.Y.; Vibrans, A.C. 2014. Restricted geographic distribution of tree species calls for urgent conservation efforts in the Subtropical Atlantic Forest. Biodiversity and Conservation 24: 1057–1071.
- Ribeiro, M.C.; Metzger, J.P.; Martensen, A.C.; Ponzoni, F.J.; Hirota, M.M. 2009. The Brazilian Atlantic forest: how much is left, and how is the remaining forest distributed? Implications for conservation. Biological Conservation 142: 1141–1153.
- Richards, P.W. 1996. The Tropical Rain Forest: An Ecological Study. Cambridge University Press, Cambridge, UK.
- Ricklefs, R.E. 2000. Rarity and diversity in Amazonian forest trees. Trends in Ecology & Evolution 15: 83–84.
- Särndal, C.; Swensson, B.; Wretman, J. 1992. Model assisted survey sampling. Springer, New York, NY, USA.
- Scolforo, J.R.; Oliveira, A.D.; Mello, J.M.; Silva, C.P.C.; Guedes, I.C.L.; Andrade, I.S.; Abreu, E.C.R. 2008. Sampling sufficiency of seasonal deciduous forests. = Suficiência amostral para a fisionomia floresta estacional decidual. p. 89-95. In: Mello, J.M.; Scolforo, J.R.; Carvalho, L.M.T., eds. In: Forest Inventory of Minas Gerais: Seasonal deciduous forests: floristics, structure, similarity, diameter and height distribution, volumetry, increment and management tendencies. = Inventário florestal de Minas Gerais: floresta estacional decidual: florística, estrutura, similaridade, distribuição diamétrica e de altura, volumetria, tendências de crescimento e manejo florestal. Editora UFLA, Lavras, MG, Brazil (in Portuguese).
- Silva, J.G.; Costa, A.F. 2011. A Taxonomic revision of Vriesea corcovadensis group (Bromeliaceae: Tillandsioideae) with description of two new species. Systematic Botany 36: 291–309.
- Silveira, P. 2009. Adjustment of mathematical models for estimating above-ground biomass in a Dense Ombrophilous Forest. Floresta 39: 743–752 (in Portuguese, with abstract in English).
- Smith, E.P.; van Belle, G. 1984. Nonparametric estimation of species richness. Biometrics 49: 119–129.
- Stehmann, J.R.; Forzza, R.C.; Salino, A.; Sobral, M.; Costa, D.P.; Kamino, L.H.Y. 2009. Plants of the Atlantic Forest. = Plantas da Floresta Atlântica. Jardim Botânico do Rio de Janeiro, Rio de Janeiro, RJ, Brazil (in Portuguese).
- Swaine, M.D.; Whitmore, T.C. 1988. On the definition of ecological species groups in tropical rain forests. Vegetatio 75: 81–86.
- ter Steege, H.; Pitman, N.C.A.; Sabatier, D.; Baraloto, C.,; Salomão, R.P.; Guevara, J.E.; Phillips, O.L.; Castilho, C.V.; Magnusson, W.E.; Molino, J.F.; Abel Monteagudo, A.; Núñez Vargas, P.; Montero, J.C.; Feldpausch, T.R.; Coronado, E.N.H.; Killeen, T.J.; Mostacedo, B.; Vasquez, R.; Assis, R.L.; Terborgh, J.; Wittmann, F.; Andrade, A.; Laurance, W.F.; Laurance, S.G.W.; Marimon, B.S.; Marimon Jr., B.-H.; Vieira, I.C.G.; Amaral, I.L.; Brienen, R.; Castellanos, H.; Cárdenas López, D.; Duivenvoorden, J.F.; Mogollón, H.F.; Matos, F.D.A.; Dávila, N.; García-Villacorta, R.; Diaz, P.R.S.; Costa, F.; Emilio, T.; Levis, C.; Schietti, J.; Souza, P.; Alonso, A.; Dallmeier, F.; Montoya, A.J.D.; Fernandez Piedade, M.T.; Araujo-Murakami, A.; Arroyo, L.; Gribel, R.; Fine, P.V.A.; Peres, C.A.; Toledo, M.; Aymard C., G.A.; Baker, T.R.; Cerón, C.; Engel, J.; Henkel, T.W.; Maas, P.; Petronelli, P.; Stropp, J.; Zartman, C.E.; Daly, D.; Neill, D.; Silveira, M.; Ríos Paredes, M.; Chave, J.; Lima Filho, D.A.; Jørgensen, P.M.;Fuentes, A.; Schöngart, J.; Cornejo Valverde, F.; Di Fiore, A.; Jimenez, E.M.; Peñuela Mora, M.C.; Phillips, J.F.; Rivas, G.; van Andel, T.R.; von Hildebrand, P.; Hoffman, B.;Zent, E.L.; Malhi, Y.; Prieto, A.; Rudas, A.; Ruschell, A.R.; Silva, N.; Vos, V.; Zent, S.; Oliveira, A.A.; Schutz, A.C.; Gonzales, T.; Nascimento, M.T.; Ramirez-Ângulo, H.; Sierra, R.; Tirado, M.; Umaña Medina, M.N.; van der Heijden, G.; A. Vela, C.I.; Vilanova Torre, R.; Vriesendorp, C.; Wang, O.; Young, K.R.; Baider, C.; Balslev, H.; Ferreira, C.; Mesones, I.; Torres-Lezama, A.; Urrego Giraldo, L.E.; Zagt, R.; Alexiades, M.N.; Hernandez, L.; Huamantupa-Chuquimaco, I.; Milliken, W.; Palacios Cuenca, W.; Pauletto, D.; Valderrama Sandoval, E.; Valenzuela Gamarra, L.; Dexter, K.G.; Feeley, K.; Lopez-Gonzalez, G.; Silman, M.R.2013. Hyperdominance in the Amazonian tree flora. Science 342: 1243092.
- Tomppo, E.; Gschwantner, T.; Lawrence, M.; McRoberts, R.E. 2010. National Forest Inventories: Pathways for Common Reporting. Springer, Dordrecht, The Netherlands.
- Van der Pijl, L. 1969. Principles of Dispersal in Higher Plants. Springer, New York, NY, USA.
- Vibrans, A.C.; Sevegnani, L., Uhlmann, A.; Schorn, L.A.; Sobral, M.G.; Gasper, A.L.; Lingner, D.V., Brogni, E.; Klemz, G.; Godoy, M.B.; Verdi, M. 2011. Structure of mixed ombrophyllous forests with Araucaria angustifolia (Araucariaceae) under external stress in southern Brazil. Revista de Biologia Tropical 59: 1371–1387.
- Vibrans, A.C.; McRoberts, R.E.; Moser, P.; Nicoletti, A.L. 2013. Using satellite image-based maps and ground inventory data to estimate the area of the remaining Atlantic forest in the Brazilian state of Santa Catarina. Remote Sensing of Environment 130: 87–95.
- Vibrans, A.C.; Moser, P.; Oliveira, L.Z.; Maçaneiro, J.P. 2015. Generic and specific stem volume models for three subtropical forest types in southern Brazil. Annals of Forest Science 72: 865–874.
- Vidal, C.; Lanz, A.; Tomppo, E.; Schadauer, K.; Gschwantner, T.; Di Cosmo, L.; Robert, N. 2008. Establishing forest inventory reference definitions for forest and growing stock: a study towards common reporting. Silva Fennica 42: 247–266.
- Vogel, H.L.M.; Schumacher, M.V.; Trüby, P. 2006. Biomass quantification in a seasonal deciduous forest in Itaara, RS, Brazil. Ciência Florestal 16: 419–425 (in Portuguese, with abstract in English).
- Zhang, J.; Nielsen, S.E.; Grainger, T.N.; Kohler, M.; Chipchar, T.; Farr, D.R. 2014. Sampling plant diversity and rarity at landscape scales: importance of sampling time in species detectability. PLoS One 9: e95334.
Edited by
Publication Dates
-
Publication in this collection
01 July 2019 -
Date of issue
2020
History
-
Received
21 Feb 2018 -
Accepted
21 July 2018