ABSTRACT:
Polymer coatings are used to control the rate of release of plant available nutrients from fertilizers as well as to reduce nutrient losses such as ammonia (NH3) volatilization. Although the literature presents several examples of materials used to coat urea, little is known about nitrogen (N) release properties such as the mechanism involved and phenomena (e.g., pore opening) in the polymer coating. Thus, this study investigated urea release from polyurethane (PU) derived from two renewable raw materials (castor oil and soybean oil), to explain how the oil structure and coating microstructure influence release and urea-N dynamics in soil. The results demonstrated that the profile of urea release and the urea-N mineralization in the soil could be controlled by altering the thickness of the coating on the urea granules. Coating by eco-friendly polymer was efficient in controlling urea release in soil to reduce volatilization of ammonia and increase the availability of N in the soil.
Keywords:
polyurethane; controlled release; plant nutrition; soil fertility; nitrogen
Introduction
The growth of the global human population directly affects the demand for food, increasing the challenge faced by agriculture to deliver efficient and sustainable production. This necessitates adequate applications of fertilizers while minimizing nutrient losses (Manzatto et al., 2002Manzatto, C.V.; Freitas Junior, E.; Peres, J.R.R. 2002. Agricultural use of Brazilian soils = Uso Agrícola dos Solos Brasileiros. Embrapa Solos, Rio de Janeiro, RJ, Brazil (in Portuguese).; Yan et al., 2008Yan, X.; Jin, J.J.; He, P.; Liang, M.Z. 2008. Recent advances in technology of increasing fertilizer use efficiency. Agricultural Sciences in China 7: 469-479.). Urea is the most widely used conventional fertilizer, mainly because of its high N content and low cost (Ni et al., 2009Ni, B.; Liu, M.; Lu, S. 2009. Multifunctional slow-release urea fertilizer from ethylcellulose and superabsorbent coated formulations. Chemical Engineering Journal 155: 892-898.). However, N loss due to NH3 volatilization can account for as much as 50 % of the applied urea (Chen et al., 2008Chen, L.; Xie, Z.; Zhuang, X.; Chen, X.; Jing, X. 2008. Controlled release of urea encapsulated by starch-g-poly (L-lactide). Carbohydrate Polymers 72: 342-348.; Ni et al., 2014Ni, K.; Pacholski, A.; Kage, H. 2014. Ammonia volatilization after application of urea to winter wheat over three years affected by novel urease and nitrification inhibitors. Agriculture, Ecosystems & Environment 197: 184-194.; Suter et al., 2013Suter, H.; Sultana, H.; Turner, D.; Davies, R.; Walker, C.; Chen, D. 2013. Influence of urea fertiliser formulation, urease inhibitor and season on ammonia loss from ryegrass. Nutrient Cycling in Agroecosystems 95: 175-185.). When incorporated or applied to the soil surface, urea is hydrolyzed to ammonium (NH4) by urease enzymes at a rate that depends on the amount of active enzyme and factors that influence their activity, such as temperature, humidity, soil pH, and urea concentration (Abalos et al., 2014Abalos, D.; Jeffery, S.; Sanz-Cobena, A.; Guardia, G.; Vallejo, A. 2014. Meta-analysis of the effect of urease and nitrification inhibitors on crop productivity and nitrogen use efficiency. Agriculture, Ecosystems & Environment 189: 136-144.; Soares et al., 2012Soares, J.R.; Cantarella, H.; Menegale, M.L.C. 2012. Ammonia volatilization losses from surface-applied urea with urease and nitrification inhibitors. Soil Biology and Biochemistry 52: 82-89.; Wang et al., 2004Wang, C.; Xing, X.; Han, X. 2004. Advances in study of factors affecting soil N mineralization in grassland ecosystems. Chinese Journal of Applied Ecology 15: 2184-2188.). Subsequently, nitrification results in oxidation of NH4 to NO2 and NO3, which can be readily lost from agricultural soils due to leaching and denitrification (Krajewska, 2009Krajewska, B. 2009. Ureases. I. Functional, catalytic and kinetic properties: a review. Journal of Molecular Catalysis B: Enzymatic 59: 9-21.). These losses have important economic and environmental implications (FAO, 2017Food and Agriculture Organization. [FAO]. 2017. Agri-Environmental Indicators - Fertilizers. Available at: http://www.fao.org/faostat/en/#data/EF/ [Accessed Nov 21, 2017]
http://www.fao.org/faostat/en/#data/EF/...
).
Technological strategies are required for overcoming the problem of NH3 volatilization loss from urea (Bremner, 1996Bremner, J.M. 1996. Nitrogen total. p. 1085-1122. In: Sparks, D.L.; Page, A.L.; Helmke, P.A.; Loeppert, R.H.; Soltanpour, P.N.; Tabatabai, M.A.; Johnston, C.T.; Sumner, M.E., eds. Methods of soil analysis. Part 3. Chemical methods. Soil Science Society of America, Madison, WI, USA. (SSSA Book Series, 5).; Estiu and Merz, 2007Estiu, G.; Merz, K.M. 2007. Competitive hydrolytic and elimination mechanisms in the urease catalyzed decomposition of urea. The Journal of Physical Chemistry B 111: 10263-10274.). One option is the application of a polymer coating to urea granules to create a physical barrier. Previous studies have shown that coatings can be prepared to control the release rate of nutrients (Bortoletto-Santos et al., 2016Bortoletto-Santos, R.; Ribeiro, C.; Polito, W.L. 2016. Controlled release of nitrogen-source fertilizers by natural-oil-based poly(urethane) coatings: the kinetic aspects of urea release. Journal of Applied Polymer Science 133: 43790. DOI: doi.org/10.1002/app.43790
doi.org/10.1002/app.43790...
; Cruz et al., 2017Cruz, D.F.; Bortoletto-Santos, R.; Guimarães, G.G.F.; Polito, W.L.; Ribeiro, C. 2017. Role of polymeric coating on the phosphate availability as a fertilizer: insight from phosphate release by castor polyurethane coatings. Journal of Agricultural and Food Chemistry 65: 5890-5895.; Lan et al., 2011Lan, R.; Liu, Y.; Wang, G.; Wang, T.; Kan, C.; Jin, Y. 2011. Experimental modeling of polymer latex spray coating for producing controlled-release urea. Particuology 9: 510-516.; Liu et al., 2008Liu,Y.; Wang, T.; Qin, L.; Jin, Y. 2008. Urea particle coating for controlled release by using DCPD modified sulfur. Powder Technology 183: 88-93.). However, there is a lack of information in the literature about the effect of coatings on nitrogen release kinetics. In addition, few authors have studied the role of fertilizer coatings on nitrogen release and how the kinetics measured in the laboratory compare with release in soil. The literature is not conclusive about the feasibility of coating for this purpose. Furthermore, its structure and properties are not correlated to the laboratory and soil results, as in studies by Shaviv et al. (2003)Shaviv, A.; Raban, S.; Zaidel, E. 2003. Modeling controlled nutrient release from a population of polymer coated fertilizers: statistically based model of diffusion release. Environmental Science and Technology 37: 2257-2261., Xiaoyu et al. (2013)Xiaoyu, N.; Yuejin, W.; Zhengyan, W.; Lin, W.; Guannan, Q.; Lixiang, Y. 2013. A novel slow-release urea fertilizer: physical and chemical analysis of its structure and study of its release mechanism. Biosystems Engineering 115: 274-282.; and Halvorson et al. (2010)Halvorson, A.D.; Del Grosso, S.J.; Alluvione, F. 2010. Tillage and nitrogen source effects on nitrous oxide emissions from irrigated cropping systems. Soil Science Society of America Journal 74: 435-445.. In soil, environmental factors and dynamic changes in the forms of N may strongly influence the effectiveness of a coating strategy and hinder interpretation of the processes occurring, which can be problematic in terms of product design. The structure, solubility, and biodegradability of the coating can play important roles that are yet to be clarified.
Thus, the aim of our study was the evaluation of the kinetics of urea release from granules coated with polyurethanes prepared from two oil sources - polyols from soybean oil and castor oil. Our aim is to improve knowledge about the effectiveness of polyurethanes (PUs) by quantifying the rate of urea release, changes in the form of N, and reduction of losses by volatilization in soil, using different proportions of urea and coating.
Thus, we were interested in explaining how the oil structure and coating microstructure influence N release as well as the results which showed that despite similar chemical structures, the quality of the coating was important in controlling urea release and was determined by the production procedure and the oil source used.
Materials and Methods
Coating of urea
Urea granules were coated using two systems based on polyurethane resins derived from modified biobased oils (castor oil or soybean oil). The process followed the methodology of Bortoletto-Santos et al. (2016)Bortoletto-Santos, R.; Ribeiro, C.; Polito, W.L. 2016. Controlled release of nitrogen-source fertilizers by natural-oil-based poly(urethane) coatings: the kinetic aspects of urea release. Journal of Applied Polymer Science 133: 43790. DOI: doi.org/10.1002/app.43790
doi.org/10.1002/app.43790...
and in both cases involved a reaction with commercial 4.4’-diphenylmethane diisocyanate (MDI), from Bayer. The mass ratio was fixed at 60:40 (oil:MDI) and the quantities of polyurethane used were calculated so as to represent a certain percentage, on a mass basis, of the amount of urea used. For example, a coating containing 50 g of resin per kg of urea (5 %) was prepared by dispersing the resin among the urea granules (typical diameter 3 mm). Coatings were prepared at a strength between 2 % and 8 % polyurethane (w/w), for both systems studied. The coating process was performed at 50-70 °C using a metal turntable with 20 cm side shields and a 1 kg sample capacity, rotating at 30 rpm under a flow of air.
Characterization of the granules
The total amount of N in the materials was determined by elemental analysis as well as being performed in three replicates. The results and their respective standard deviations are presented in Table 1 as well as the samples’ nomenclature.
Analysis of the morphology of the urea and coating was performed by X-ray microtomography. The images were acquired under the following conditions: 3.94 μm spatial resolution (voxel size), 0.2° rotation step, 180° rotation, and an averaging of 10 frames. The reconstruction of the tomographic images was performed using NRecon SkyScan software.
Release of urea and N transformation in soil
The soil used in the study was an Oxisol collected from the surface layer (0-20 cm) of an agricultural plot in the region of São Carlos, in the state of São Paulo, Brazil (22°01’ S, 47°54’ W; 856 m above sea level). The soil (particle size < 2 mm) had the following characteristics: 433 g kg−1 sand, 35 g kg−1 silt, and 532 g kg−1 clay, according to textural analysis by the pipette method (Kilmer and Alexander, 1949Kilmer, V.J.; Alexander, L.T. 1949. Methods of making mechanical analysis of soils. Soil Science 68: 15-24.); water holding capacity (WHC) (Embrapa, 1979Empresa Brasileira de Pesquisa Agropecuária [Embrapa]. 1979. Manual of Soil Analysis Methods = Manual de Métodos de Análise de Solo. Embrapa Solos, Rio de Janeiro, RJ, Brazil (in Portuguese).) of 200 g kg−1; pH (H2O) 5.18, measured with a glass electrode; organic C content of 7.56 g kg−1, as measured by the Walkley-Black method (Nelson and Sommers, 1996Nelson, D.W.; Sommers, L.E. 1996. Total carbon, organic carbon, and organic matter. p. 961-1010. In: Sparks, D.L.; Page, A.L.; Helmke, P.A.; Loeppert, R.H.; Soltanpour, P.N.; Tabatabai, M.A.; Johnston, C.T.; Sumner, M.E., eds. Methods of soil analysis. Part 3. Chemical methods. SSSA, Madison, WI, USA. (SSSA Book Series, 5).); total N 1.15 g kg−1, as measured by the Kjeldahl method (Bremner and Chai, 1986Bremner, J.M.; Chai, H. 1986. Evaluation of N-butyl phosphorothioictriamide for retardation of urea hydrolysis in soil. Communications in Soil Science and Plant Analysis 17: 337-351.); cation exchange capacity (CEC) of 4.23 cmolc kg−1 and urease activity of 7.12 mg N kg− 1 h−1 (Tabatabai and Bremner, 1972Tabatabai, M.A.; Bremner, J.M. 1972. Assay of urease activity in soils. Soil Biology and Biochemistry 4: 479-487.).
Samples of urea, with or without polymeric coatings, were incubated in 10 g portions of soil, using a ratio between 0.9 and 1.1 g N kg−1 soil in 125 mL polyethylene bottles. Bottles were placed in an incubation system similar in design to the unit described by Bremner and Douglas (1971)Bremner, J.M.; Douglas, L.A. 1971. Inhibition of urease activity in soils. Soil Biology and Biochemistry 3: 297-307. according to the modifications proposed by Guimarães et al. (2016)Guimarães, G.G.F.; Mulvaney, R.L.; Khan, S.A.; Cantarutti, R.B.; Silva, A.M. 2016. Comparison of urease inhibitor N-(n-butyl) thiophosphorictriamide andoxidized charcoal for conserving urea-N in soil. Journal of Plant Nutrition and Soil Science 179: 520-528.. The urea fertilizers were applied to the soil surface and the soil moisture content was brought to 80 % WHC (1.6 mL in 10 g soil) by adding deionized water. A 5 mL acid trap containing 4 % boric acid was attached to the polyethylene bottles to capture the NH3 volatilized during the incubation. The samples were incubated in bottles in a constant-temperature room maintained at 25 °C for 0, 1, 3, 7, 14, 28, and 42 days.
The ammonia volatilized was determined by titration of boric acid using HCl (0.01 mol L−1). The urea granules remaining after the incubation period were collected for determination of the urea-N by elemental analysis. Inorganic N was extracted from the soil by shaking 100 mL of 1 mol L−1 KCl + 5 mg L−1 phenylmercuric acetate as a urease inhibitor for 1 h. The suspension was filtered using a slow filter (diameter 12.5 cm) and the ext stored in 100 mL polyethylene bottles at 5 °C.
Ammonium (NH4) and nitrate (NO3) contents in the soil extracts were determined by a colorimetric method, using the formation of a substituted indophenol with sodiumsalicylate in the presence of nitroprusside as a catalyst (Kempers and Zweers, 1986Kempers, A.; Zweers, A. 1986. Ammonium determination in soil extracts by the salicylate method. Communications in Soil Science and Plant Analysis 17: 715-723.; Yang et al., 1998Yang, J.E.; Kim, J.J.; Skogley, E.O.; Schaff, B.E. 1998. A simple spectrophotometric determination of nitrate in water, resin, and soil extracts. Soil Science Society of America Journal 62: 1108-1115.). The surfaces of granules collected after each incubation period were evaluated using scanning electron microscopy (SEM) to observe decomposition of the coatings.
The N content of each fraction was expressed as a percentage relative to the N applied as urea. A logistic model was adjusted using the values of the release of urea-N or volatilized NH3 to examine the kinetic parameters of these two processes. The data fit the logistic model for both processes as well as for all materials. The release of urea-N (ŷN, in Eq. 1) and volatilized NH3 (ŷNH3, in Eq. 2) following the adjusted logistic model:
where ŷN, ŷNH3 are a % of the total N, where “a” represents the time to inflection (or for %max/2); and “b” is the rate of urea release or NH3 volatilized, respectively.
The values of kinetic parameters and mineral N (NH4 and NO3) formed in the soil were calculated in terms of means and differences between the fertilizers and assessed by analysis of variance (ANOVA). Where the F-test showed significance, differences between treatments were compared using Tukey's test (p < 0.05).
Results and Discussion
After formation of the PU/urea granules, the morphology of the coated fertilizer surface was evaluated using X-ray microtomography (micro CT). The images showed that both the soybean and castor oil coatings were uniform and cohesive. However, it was observed that the soybean oil-based coating had defects such as pores and voids between the coating and the granule, which could affect urea release behavior (Figure 1A). The castor oil-based coating was much more uniform and exhibited low porosity (Figure 1B). In addition, we analyzed groups of at least ten different measurements in each sample, obtaining an average value for each coating condition. The results are presented in Table 2.
A) Microtomography image of urea granule with soybean oil polyurethane coating; B) Microtomography image of urea granule with castor oil polyurethane coating.
As seen in Table 2, there is a variation of approximately 10 % (U-S 2 %) to 20 % (U-S 7 %) in thickness, which had been expected due to granule irregularity. However, this interval is similar for different samples, indicating that the variation in coating thickness can be assumed to have an average value for the purpose of these discussions.
Figure 2 shows the total urea-N content of the granules during the soil incubation. The uncoated urea was completely solubilized in the first 24 h, so it was not possible to quantify the urea-N. The coatings at a ratio of 2 % (U-C 2 % and U-S 2 %) provided poorer control of urea release compared to the granules with higher polymer contents during the first seven days of incubation. This behavior was confirmed by parameters of the adjusted model for urea-N recovery from the granules coated, presented in Table 3. The data fit the logistic model for all materials well (Eq. 1 and 2).
Urea-N recovery from the granules coated with polyurethane derived from soybean oil (U-S) or castor oil (U-C), after aerobic incubation in the soil. The curves shown were estimated from the equation (logistic model) of the form ŷ = (100/(1+(t/a)b)). Vertical bars are standard deviations.
Parameters of the adjusted model “a” and “b” for urea-N recovery from the granules coated with polyurethane derived from soybean oil or castor oil; time urea was released (start of release), and time required to release 25 % of urea (Time 25 %) after aerobic incubation in the soil.
The release of urea from the U-C 2 % formulation increased on the first day of incubation, while U-S 2 % showed increased release on the third day. However, both coatings showed similarities in the release of urea after seven days, and over 60 % release of urea after 14 days of incubation (Figure 2). For these treatments, the release rate decreased after 14 days, with the release of urea extending up to 42 days, when the granules showed urea-N contents of 9 % (U-S 2 %) and 5 % (U-C 2 %).
As expected, increasing the thickness of the coating delayed the initial release of urea and provided a rate of release that was slower and more homogeneous throughout the incubation period, compared to uncoated urea and urea coated using a proportion of 2 % PU. This can be seen in Table 3 and SEM images of the coated surfaces of granules with higher PU contents are shown in Figure 3. It is important to note that the coatings produced from soybean oil showed evidence of channel formation in the polymeric structure during the first seven days of incubation, while the coatings produced using castor oil remained intact until the seventh day of incubation.
SEM images of the coatings of the U-S (2 % and 7 %) and U-C (2 % and 7 %) granules during incubation in the soil. All the SEM images are under the same magnification.
As seen in Table 3, the release of urea from the U-S 5 % and U-C 5 % materials started after two and four days, respectively, and was maintained throughout the incubation period, up to 42 days, at which time these treatments showed urea-N content in the granules of 55 and 45 %, respectively. Further increases in the coating proportion resulted in urea release starting after seven days (U-S 7 %) and 25 days (U-C 7 %), also shown in Table 3, with evidence of the formation of pores and/or channels in the polymer barrier (Figure 3). The high coating proportions in these treatments provided low release of urea during the incubation period, with an average of 32 % of the urea-N (N remaining) in the granules. In addition, it can be seen that the coatings exhibited no alterations (Figure 3).
The profiles of urea release from the coated urea granules could be divided into three groups, according to the proportion of coating. The first group (U-S 2 % and U-C 2 % - thin coating) showed 90 % urea release after 42 days in the soil. The second group (U-S 5 % and U-C 5 %) showed > 45 % release of urea after 42 days. The third group (U-S 7 % and U-C 7 %) showed 30 % release of urea during the evaluation period.
Since the coating process involves sequential layer deposition, as explained in the experimental part, it was expected that the second layer would partially cover the residual porosity in the first layer, leading to subsequent covering in the third layer and so forth. This behavior is different from that expected for a thicker layer applied in a single step, were porosity strictly dependent on the interface urea-coating. However, we may consider that the subsequent coatings are better described as coating-coating interfaces, with independent porosity – which would, at least, imply higher tortuosity. This indicates that thicker coatings probably have lower interconnected porosity (the use of which is appropriate for permeation). In fact, a number of studies such as Cruz et al. (2017)Cruz, D.F.; Bortoletto-Santos, R.; Guimarães, G.G.F.; Polito, W.L.; Ribeiro, C. 2017. Role of polymeric coating on the phosphate availability as a fertilizer: insight from phosphate release by castor polyurethane coatings. Journal of Agricultural and Food Chemistry 65: 5890-5895. and Bortoletto-Santos et al., 2016Bortoletto-Santos, R.; Ribeiro, C.; Polito, W.L. 2016. Controlled release of nitrogen-source fertilizers by natural-oil-based poly(urethane) coatings: the kinetic aspects of urea release. Journal of Applied Polymer Science 133: 43790. DOI: doi.org/10.1002/app.43790
doi.org/10.1002/app.43790...
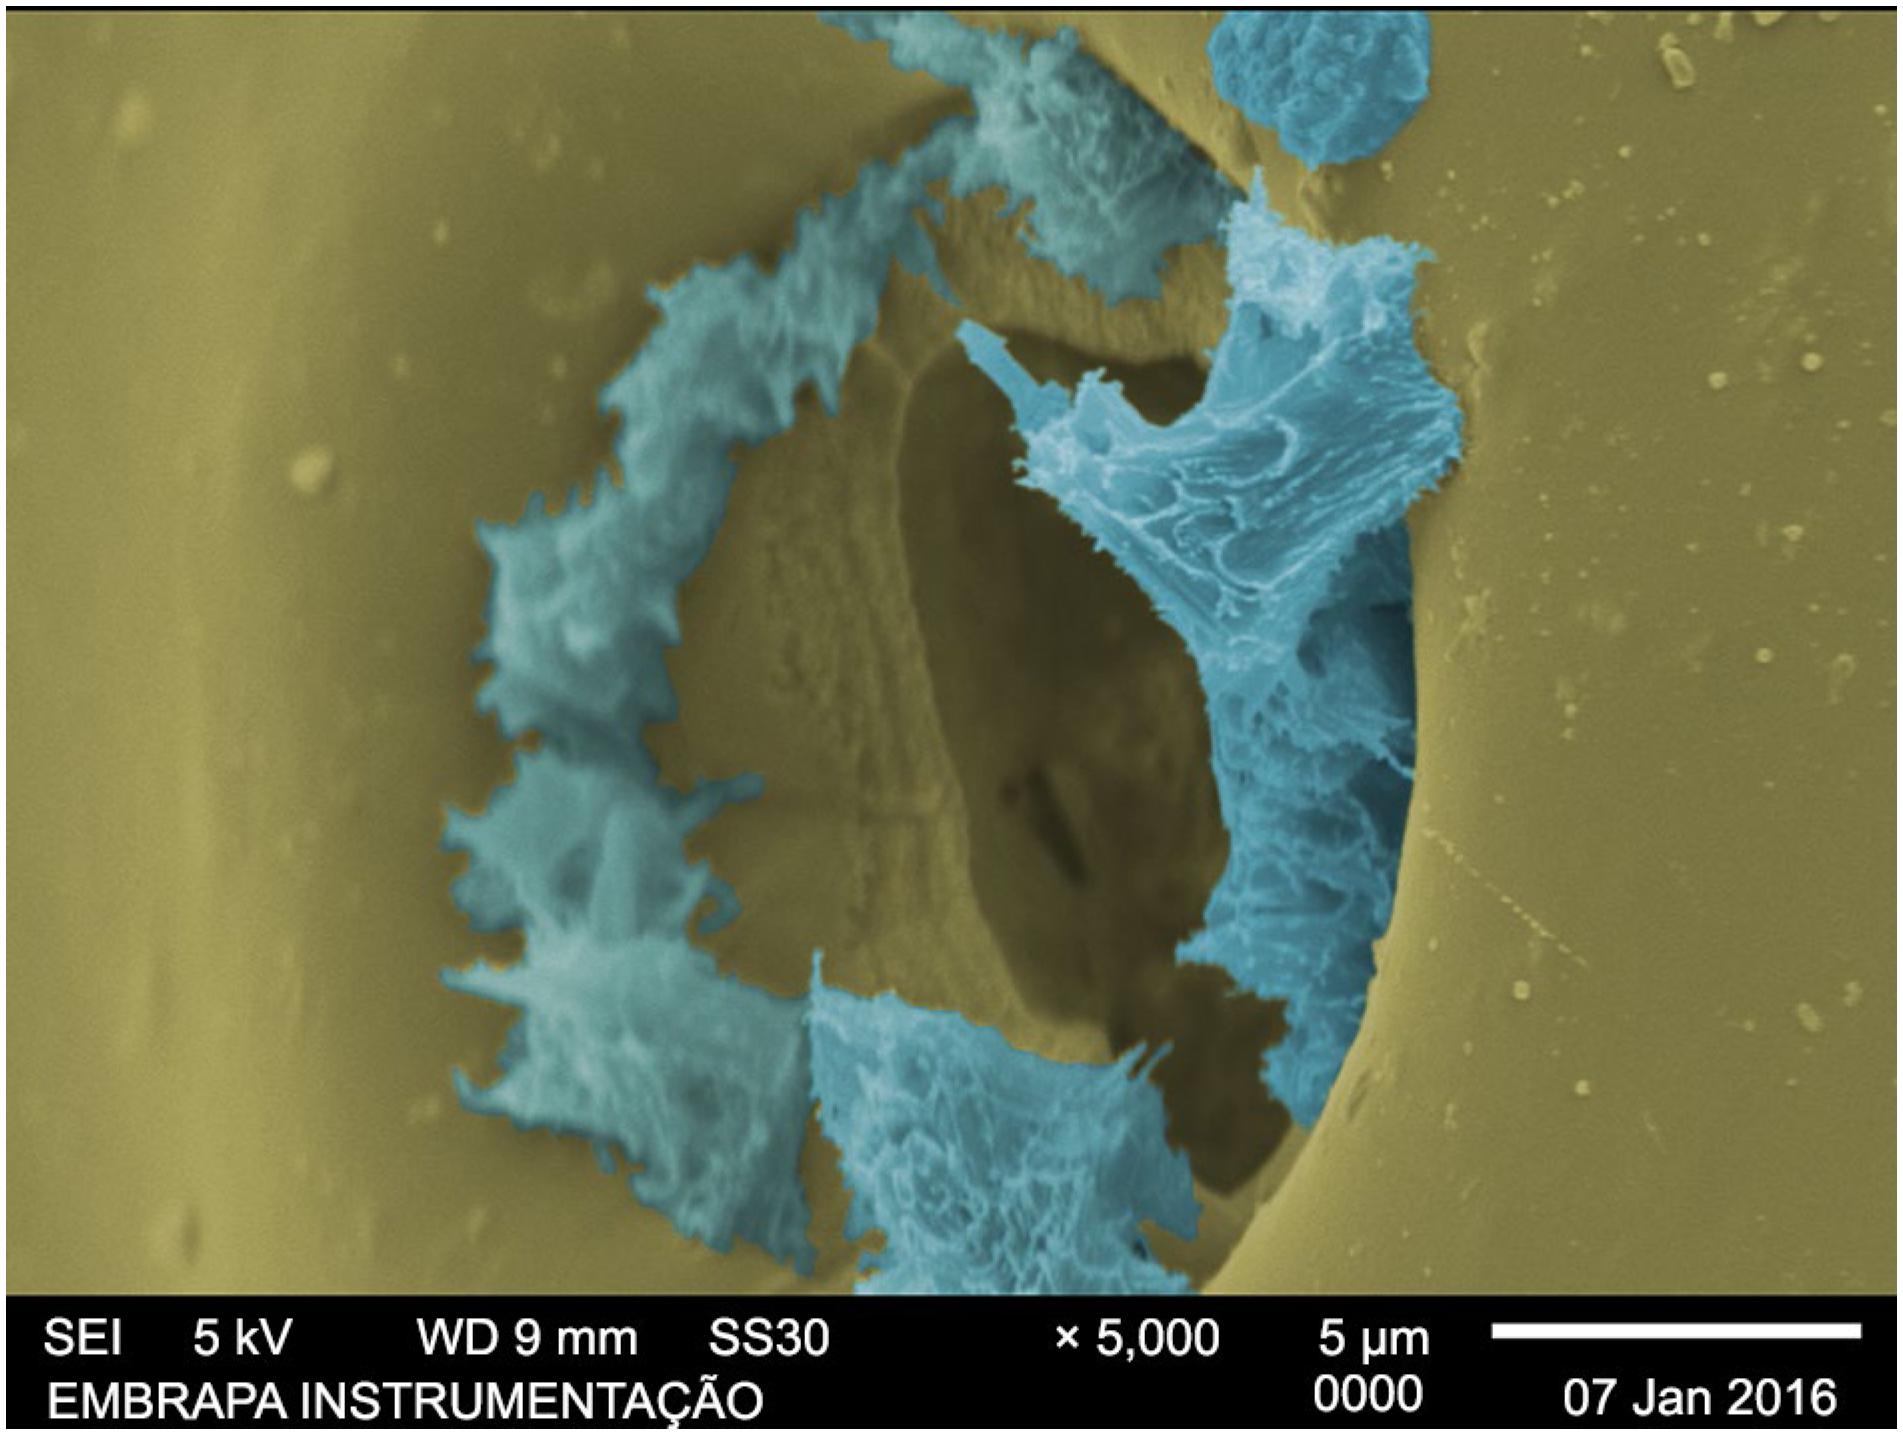
, have indicated that a small amount of coating (and, consequently, thinner layers) probably results in failures in coating granules which leads to poor performance. Therefore, according to this hypothesis, the faster release shown by the first group might be explained by the thinner layer of the polymeric coating, which was less complete, having more pores and voids than the thicker layers. Rapid polymer degradation in the soil could result in the opening of new pores or channels, despite the fact that the polymeric capsules could still be identified in the soil after the incubation period. Another contributing factor could be the coating imperfections observed for the granules with 2 % polyurethane coating, since such imperfections decreased as the coating thickness increased. Degradation of the coating on the urea granules was likely to be initiated by the action of soil microorganisms, producing pores that enabled the urea to diffuse into the soil. Figure 4 shows urea crystals emerging from a pore on the surface of the coating after incubation of U-C 2 % for seven days. The SEM images of granules collected after each incubation period showed that irregularities and porosity in the coating surfaces increased over the period studied.
SEM image of the surface of the U-C 2 % coating after 7 days of incubation (blue – urea; yellow – coating).
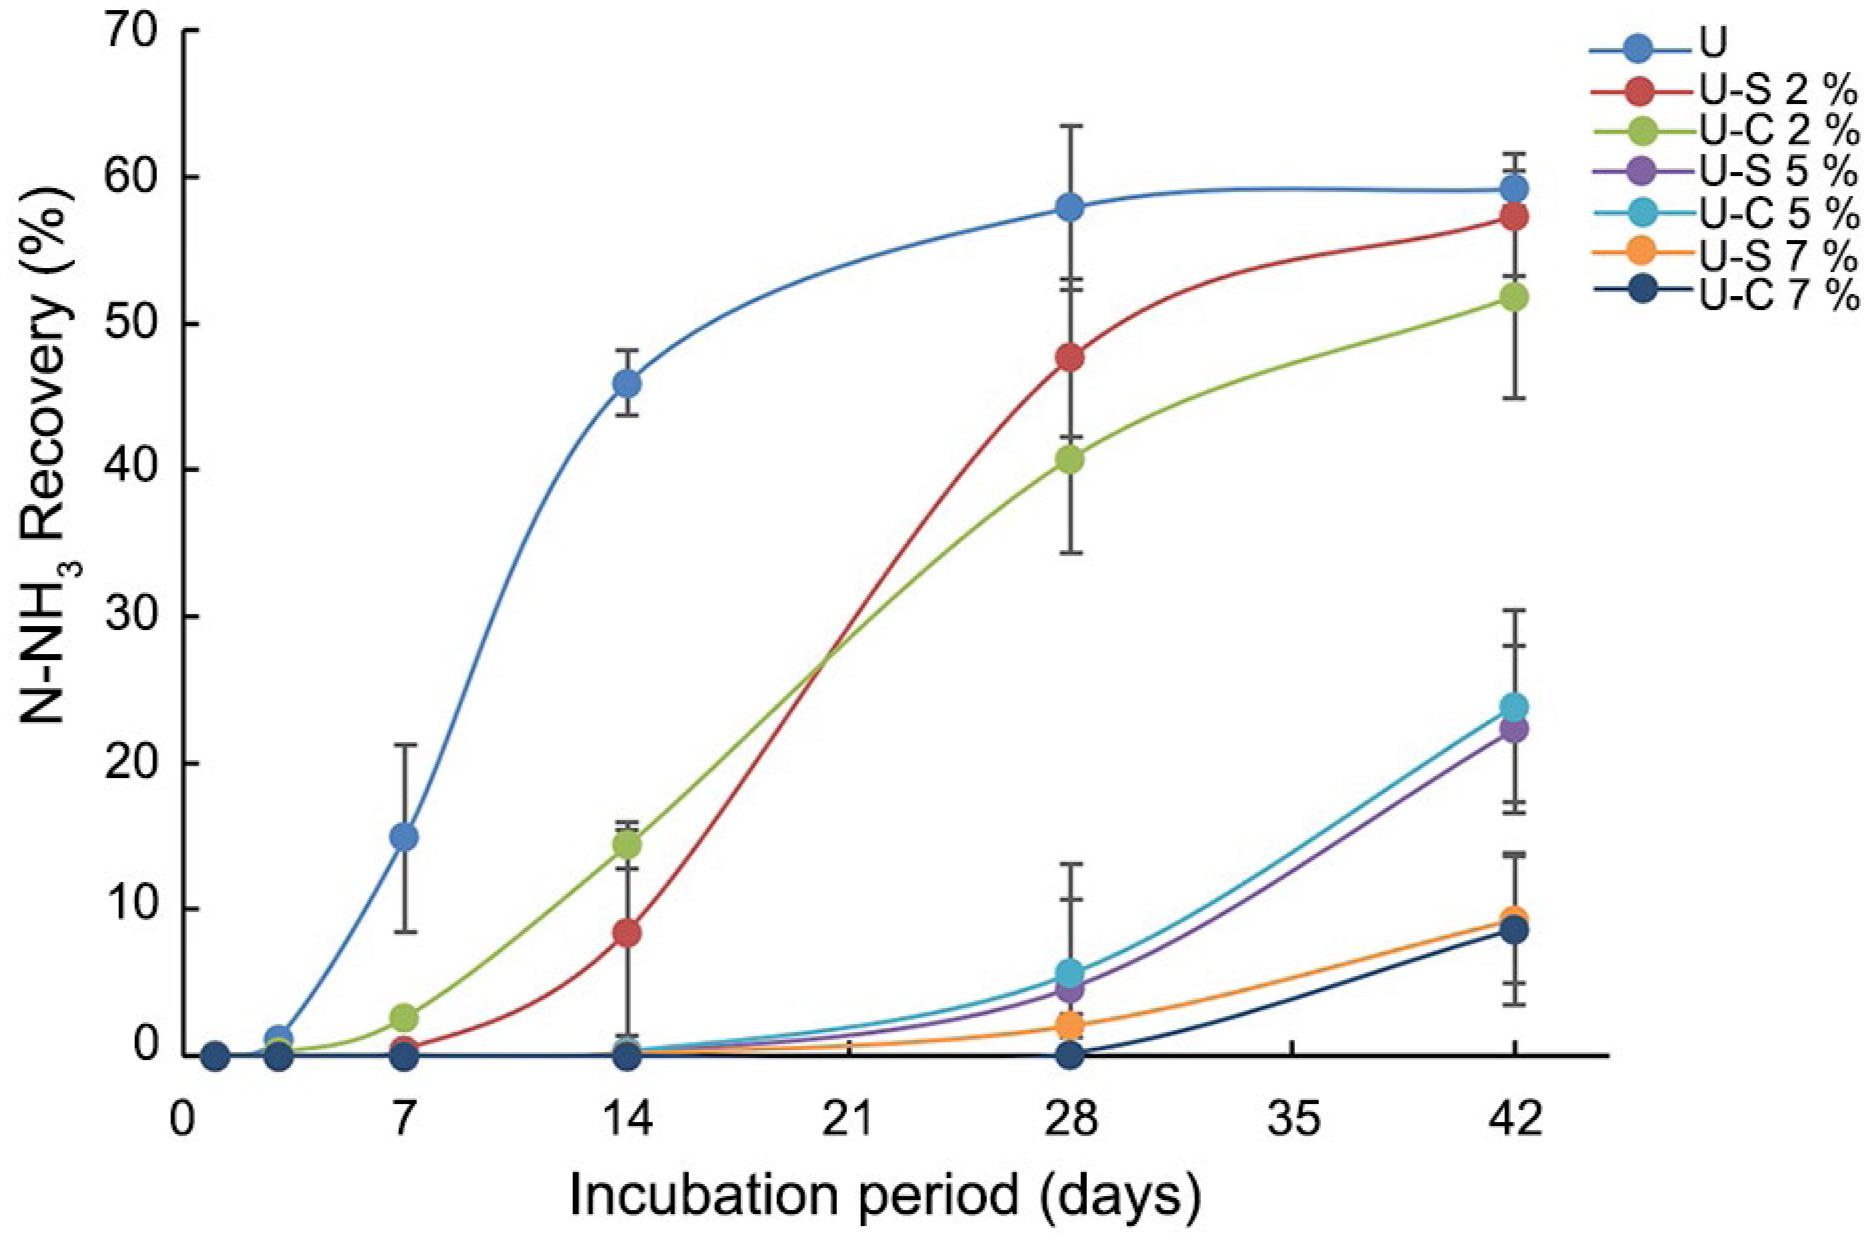
After determining the urea-N content of the urea granules, an investigation was made into the process leading to the loss of N from the fertilizer. The first step was to quantify the volatilized NH3 and construct volatilization curves (Figure 5). The losses of N due to volatilization are shown in Table 3. In addition, the volatilization model of NH3 was also well adjusted to all material, following a logistic model ŷ = (59.6/(1+(t/a)b)), where a is the time to inflection (or for %max/2 of NH3 volatilized), and b the rate of NH3 volatilized. By comparing Figure 4 and Table 4, it can be seen that the coating was able to effectively control the release of urea, thereby decreasing the hydrolysis rate and significantly reducing the loss of N by volatilization. The volatilization of NH3 from uncoated urea (U) increased up to 14 days of incubation, at which time 59 % of the N applied to the soil had been lost in the form of NH3. This rapid loss could be attributed to the rapid solubilization of urea (started in 3 days) and increased hydrolysis from the third day of incubation onwards. A high rate of urea hydrolysis in soils with low CEC and low capacity for buffering of acidity favors the volatilization of NH3 (Guimarães et al., 2016Guimarães, G.G.F.; Mulvaney, R.L.; Khan, S.A.; Cantarutti, R.B.; Silva, A.M. 2016. Comparison of urease inhibitor N-(n-butyl) thiophosphorictriamide andoxidized charcoal for conserving urea-N in soil. Journal of Plant Nutrition and Soil Science 179: 520-528.). Thus, the control of urea release provided by the polymer coating was effective in reducing losses of N by volatilization, also shown in Table 4.
Volatilization of ammonia (NH3) during the aerobic incubation in soil of uncoated urea (U) and urea coated with PU derived from soybean oil (U-S) or castor oil (U-C). The data shown was estimated from the equation (logistic model) of the form ŷ = (59.6/(1+(t/a)b)), followed by standard deviations.
Parameters of the adjusted model “a” and “b” for volatilization of ammonia (NH3), time when volatilization initiated (start of volatilize), and total nitrogen volatilized during aerobic incubation in the soil of granules uncoated urea (U) or coated with polyurethane derived from soybean oil or castor oil.
The coating of the urea granules with polyurethane inhibited NH3 volatilization over four days of incubation, independent of the source of the polyurethane or the thickness of the coating. The uncoated urea showed a more intense N loss after 14 days, at which time 47 % of the N applied to the soil in the form of urea had been lost to volatilization. However, during this same period, the coatings with 5 and 7 % proportions of soybean oil-based polyurethane, or 5 and 7 % proportions of castor oil-based polyurethane, showed no significant losses of N (volatilization beginning at 17, 21, 19 and 33 days, respectively). On the other hand, the use of 2 % proportion of polyurethane resulted in significant losses starting at 14 days of incubation, and this was greatest for the polymer derived from soybean oil. The urea granules coated with 5 % of polyurethane, derived from soybean oil and castor oil, showed low volatilization up to 28 days of incubation. After 42 days of incubation, the uncoated urea showed a volatilization loss of 59 % of the N applied to the soil, while in the case of the polyurethane-coated granules, the loss of N as NH3 decreased in proportion to the thickness of the coating. Greater coating efficiency was observed for the castor oil-based polyurethane, compared to the polyurethane derived from soybean oil. After 42 days of incubation, low release of N from the urea, in the form of volatilized NH3 (average of 10 %), was observed for the U-S 7 % and U-C 7 % samples. The results (Table 4) might be attributable to the control of urea release. The intensity of NH3 volatilization was directly related to the rate of urea release.
Table 5 shows the profiles of formation of NH4 in the soils incubated with uncoated urea or with urea coated with the polyurethane polymers. The exchangeable NH4 content of the soil during the incubation period was related to the rate of release of urea into the soil. The soil treated with uncoated urea showed the highest NH4 content after seven days of incubation, due to rapid solubilization. However, from 14 days onwards, the NH4 content decreased due to increased loss of N by NH3 volatilization. The controlled release of urea provided by the coating delayed the formation of NH4 in the soil and therefore provided greater control of NH3 release. The formation of ammonium in the soil was directly related to the urea released. Thus, a higher polymer ratio used for the urea coating extended the formation of NH4 in the soil during the course of the incubation period.
Recovery of N after the incubation period (days)a in the form of ammonium (% N- NH4) during the aerobic incubation of uncoated urea (U) and urea coated with polyurethane derived from soybean oil (U-S) or castor oil (U-C), following application to the soil.
Table 5 also shows a comparison of the recoveries of NH4 for the soils treated with uncoated urea and urea coated with polymers, after incubation for between seven and 42 days. The soil treated with uncoated urea showed the highest NH4 recovery after seven days, while after 14 days, the soils treated with urea coated with both types of polyurethane at a proportion of of 2 % showed the same ammonium content. This finding indicated that a ratio of 2 % provided control of the release of urea and ammonium formation, and consequently controlled volatilization during the 14 days following application of the urea to the soil. The coating of urea with polyurethane in proportions of 5 % enabled control of ammonium formation up to 42 days of incubation, with NH4 recovery values after 42 days similar to the value obtained with uncoated urea (in the range from 29 to 33 % of applied N). At the end of the period, the soils treated with U-S 5 % and U-C 5 % showed 54 % and 45 % of urea-N in the granules, respectively (Figure 2). Low NH4 contents in the soils treated with U-S 7 % and U-C 7 % might be attributable to the slow release of urea, indicating that the coating of urea with these polymers at proportions higher than 7 % should provide effective control of N availability for longer than 42 days.
During the study period, we observed that urea release and the availability of N-NH4 in the soil (Table 5) exhibited slight differences between the two types of polyurethane. Slight variations were noted, but there were no clear trends for the different proportions of polyurethane during the period evaluated. The differences observed can be attributed to coating imperfections associated with the coating process, as well as the residual porosity – which leads the coating to act as a permeation membrane, where its microstructure is more important than the oil precursor. It is important to mention that this is valid for both materials since they have been shown to be adequate for PU formation as well as the fact expectation that their biodegradation will not take place during these release intervals. Thus, other PU-base materials may present faster releases in similar conditions if showing biodegradation in this period, even with similar microstructures.
There was no significant formation of NO3 in the soils treated using urea with or without coatings, during the incubation period studied (Table 6). The recovery of N in the form of NO3 ranged from 0 to 2 % of the N applied to the soil and did not present a consistent profile of nitrification in this period. This may be explained by the low nitrification capacity of this soil, under the conditions of the experiment with high ammonia concentration in the soil. According to Firestone (1982)Firestone, M.K. 1982. Biological Denitrification in Nitrogen in Agricultural Soils. American Society of Agronomy, Madison, WI, USA., the high concentration of NH3 inhibits the activity of bacteria of the genus Nitrobacter responsible for nitrification from NO2 to NO3(Firestone, 1982)Firestone, M.K. 1982. Biological Denitrification in Nitrogen in Agricultural Soils. American Society of Agronomy, Madison, WI, USA.. The same result was reported by Guimarães et al. (2016)Guimarães, G.G.F.; Mulvaney, R.L.; Khan, S.A.; Cantarutti, R.B.; Silva, A.M. 2016. Comparison of urease inhibitor N-(n-butyl) thiophosphorictriamide andoxidized charcoal for conserving urea-N in soil. Journal of Plant Nutrition and Soil Science 179: 520-528. in an experiment using the same incubation system. In addition, the total balance of N forms was included in Table 7. As observed, we can consider that NH3, NH4 and NO3 represents the majority of available N forms for all the fertilizers since all the materials are higher than 80 %, in fact approximately 100 % for almost all the samples (considering the intrinsic errors). It is important to consider the intrinsic experimental errors, but the balance is very consistent with our hypothesis of N dynamics.
Recovery of N after the incubation period (days)a in the form of nitrate (% N-NO3) during the aerobic incubation of uncoated urea (U) and urea coated with polyurethane derived from soybean oil (U-S) or castor oil (U-C), following application to the soil.
Total balance of N forms during the aerobic incubation of urea coated with polyurethane derived from soybean oil (U-S) or castor oil (U-C) with standard deviations in parentheses.
Conclusions
Controlled release and consistent availability of nutrients in the soil over time are desirable characteristics of fertilizers. In this study, the coating of urea granules with biodegradable (oil-based) polymers was shown to be an important strategy for controlling the release and availability of N in the soil. The kinetics of urea release and the transformations of urea-N in the soil can be controlled by the thickness of the coating on the urea granule. The coating of urea using a 2 % proportion of polyurethane provided control up to an incubation time of 14 days, while proportions of 5 % enabled greater conservation of urea-N in the soil for up to 42 days. Furthermore, proportions of 7 % showed potential for control over periods exceeding 42 days. Both castor oil and soybean oil can be used to synthesize biodegradable polymers suitable for conserving urea-N in the soil.
Acknowledgements
The authors thank the financial support by CAPES (Finance Code 001, grant# 88881.131771/2016-01 and CAPES-Embrapa Program), FAPESP (grant #15/17588-6, #16/09343-6 and #16/10636-6), CNPq (#2014-4/ 458763), SISNANO/MCTI and FINEP. The authors also thank the Agronano Network (Embrapa Research Network) and the National Nanotechnology Laboratory for Agribusiness (LNNA) for providing institutional support and facilities
References
- Abalos, D.; Jeffery, S.; Sanz-Cobena, A.; Guardia, G.; Vallejo, A. 2014. Meta-analysis of the effect of urease and nitrification inhibitors on crop productivity and nitrogen use efficiency. Agriculture, Ecosystems & Environment 189: 136-144.
- Bremner, J.M. 1996. Nitrogen total. p. 1085-1122. In: Sparks, D.L.; Page, A.L.; Helmke, P.A.; Loeppert, R.H.; Soltanpour, P.N.; Tabatabai, M.A.; Johnston, C.T.; Sumner, M.E., eds. Methods of soil analysis. Part 3. Chemical methods. Soil Science Society of America, Madison, WI, USA. (SSSA Book Series, 5).
- Bremner, J.M.; Chai, H. 1986. Evaluation of N-butyl phosphorothioictriamide for retardation of urea hydrolysis in soil. Communications in Soil Science and Plant Analysis 17: 337-351.
- Bremner, J.M.; Douglas, L.A. 1971. Inhibition of urease activity in soils. Soil Biology and Biochemistry 3: 297-307.
- Bortoletto-Santos, R.; Ribeiro, C.; Polito, W.L. 2016. Controlled release of nitrogen-source fertilizers by natural-oil-based poly(urethane) coatings: the kinetic aspects of urea release. Journal of Applied Polymer Science 133: 43790. DOI: doi.org/10.1002/app.43790
» doi.org/10.1002/app.43790 - Chen, L.; Xie, Z.; Zhuang, X.; Chen, X.; Jing, X. 2008. Controlled release of urea encapsulated by starch-g-poly (L-lactide). Carbohydrate Polymers 72: 342-348.
- Cruz, D.F.; Bortoletto-Santos, R.; Guimarães, G.G.F.; Polito, W.L.; Ribeiro, C. 2017. Role of polymeric coating on the phosphate availability as a fertilizer: insight from phosphate release by castor polyurethane coatings. Journal of Agricultural and Food Chemistry 65: 5890-5895.
- Empresa Brasileira de Pesquisa Agropecuária [Embrapa]. 1979. Manual of Soil Analysis Methods = Manual de Métodos de Análise de Solo. Embrapa Solos, Rio de Janeiro, RJ, Brazil (in Portuguese).
- Estiu, G.; Merz, K.M. 2007. Competitive hydrolytic and elimination mechanisms in the urease catalyzed decomposition of urea. The Journal of Physical Chemistry B 111: 10263-10274.
- Firestone, M.K. 1982. Biological Denitrification in Nitrogen in Agricultural Soils. American Society of Agronomy, Madison, WI, USA.
- Food and Agriculture Organization. [FAO]. 2017. Agri-Environmental Indicators - Fertilizers. Available at: http://www.fao.org/faostat/en/#data/EF/ [Accessed Nov 21, 2017]
» http://www.fao.org/faostat/en/#data/EF/ - Guimarães, G.G.F.; Mulvaney, R.L.; Khan, S.A.; Cantarutti, R.B.; Silva, A.M. 2016. Comparison of urease inhibitor N-(n-butyl) thiophosphorictriamide andoxidized charcoal for conserving urea-N in soil. Journal of Plant Nutrition and Soil Science 179: 520-528.
- Halvorson, A.D.; Del Grosso, S.J.; Alluvione, F. 2010. Tillage and nitrogen source effects on nitrous oxide emissions from irrigated cropping systems. Soil Science Society of America Journal 74: 435-445.
- Kempers, A.; Zweers, A. 1986. Ammonium determination in soil extracts by the salicylate method. Communications in Soil Science and Plant Analysis 17: 715-723.
- Kilmer, V.J.; Alexander, L.T. 1949. Methods of making mechanical analysis of soils. Soil Science 68: 15-24.
- Krajewska, B. 2009. Ureases. I. Functional, catalytic and kinetic properties: a review. Journal of Molecular Catalysis B: Enzymatic 59: 9-21.
- Lan, R.; Liu, Y.; Wang, G.; Wang, T.; Kan, C.; Jin, Y. 2011. Experimental modeling of polymer latex spray coating for producing controlled-release urea. Particuology 9: 510-516.
- Liu,Y.; Wang, T.; Qin, L.; Jin, Y. 2008. Urea particle coating for controlled release by using DCPD modified sulfur. Powder Technology 183: 88-93.
- Manzatto, C.V.; Freitas Junior, E.; Peres, J.R.R. 2002. Agricultural use of Brazilian soils = Uso Agrícola dos Solos Brasileiros. Embrapa Solos, Rio de Janeiro, RJ, Brazil (in Portuguese).
- Nelson, D.W.; Sommers, L.E. 1996. Total carbon, organic carbon, and organic matter. p. 961-1010. In: Sparks, D.L.; Page, A.L.; Helmke, P.A.; Loeppert, R.H.; Soltanpour, P.N.; Tabatabai, M.A.; Johnston, C.T.; Sumner, M.E., eds. Methods of soil analysis. Part 3. Chemical methods. SSSA, Madison, WI, USA. (SSSA Book Series, 5).
- Ni, B.; Liu, M.; Lu, S. 2009. Multifunctional slow-release urea fertilizer from ethylcellulose and superabsorbent coated formulations. Chemical Engineering Journal 155: 892-898.
- Ni, K.; Pacholski, A.; Kage, H. 2014. Ammonia volatilization after application of urea to winter wheat over three years affected by novel urease and nitrification inhibitors. Agriculture, Ecosystems & Environment 197: 184-194.
- Shaviv, A.; Raban, S.; Zaidel, E. 2003. Modeling controlled nutrient release from a population of polymer coated fertilizers: statistically based model of diffusion release. Environmental Science and Technology 37: 2257-2261.
- Soares, J.R.; Cantarella, H.; Menegale, M.L.C. 2012. Ammonia volatilization losses from surface-applied urea with urease and nitrification inhibitors. Soil Biology and Biochemistry 52: 82-89.
- Suter, H.; Sultana, H.; Turner, D.; Davies, R.; Walker, C.; Chen, D. 2013. Influence of urea fertiliser formulation, urease inhibitor and season on ammonia loss from ryegrass. Nutrient Cycling in Agroecosystems 95: 175-185.
- Tabatabai, M.A.; Bremner, J.M. 1972. Assay of urease activity in soils. Soil Biology and Biochemistry 4: 479-487.
- Xiaoyu, N.; Yuejin, W.; Zhengyan, W.; Lin, W.; Guannan, Q.; Lixiang, Y. 2013. A novel slow-release urea fertilizer: physical and chemical analysis of its structure and study of its release mechanism. Biosystems Engineering 115: 274-282.
- Yan, X.; Jin, J.J.; He, P.; Liang, M.Z. 2008. Recent advances in technology of increasing fertilizer use efficiency. Agricultural Sciences in China 7: 469-479.
- Yang, J.E.; Kim, J.J.; Skogley, E.O.; Schaff, B.E. 1998. A simple spectrophotometric determination of nitrate in water, resin, and soil extracts. Soil Science Society of America Journal 62: 1108-1115.
- Wang, C.; Xing, X.; Han, X. 2004. Advances in study of factors affecting soil N mineralization in grassland ecosystems. Chinese Journal of Applied Ecology 15: 2184-2188.
Edited by
Publication Dates
-
Publication in this collection
01 July 2019 -
Date of issue
2020
History
-
Received
06 Feb 2018 -
Accepted
16 July 2018