ABSTRACT:
Gladiola is an important cut flower worldwide and scheduling field gladiola production is largely dependent on planting at the correct time since its development is controlled by the air temperature. The aim of this study was to configure a planting window of gladiola in order to harvest spikes to be sold on All Souls' Day and Mother's Day holidays in the state of Rio Grande do Sul, Brazil, taking into account the El Niño Southern Oscillation (ENSO) phases. The PhenoGlad model, a dynamic process-based simulation model that simulates gladiola phenology on a daily time step was used in this study. Daily minimum and maximum temperatures over 55 years (1961-2015) from 18 weather stations across Rio Grande do Sul state, Brazil, were used as input data in the PhenoGlad model. The optimum planting window was simulated for each maturity group, location and ENSO phase. For harvesting on All Souls' Day, the optimum planting window had greater variation among the different ENSO phases. For Mother's Day, only Very Strong El Niño events affected the development of gladiola, indicating the weak signal of the phenomenon at this time of the year. A case study in a commercial farm demonstrated the importance of these results for farmers. The planting window for production on Mother's Day in a Neutral year was successfully configured. Determining the optimum planting window by considering the ENSO effect led to a more precise scheduling of gladiola production in southern Brazil.
Keywords:
PhenoGlad; peaks of consumption; scheduling flowering; temperature; target date
Introduction
The cut flower sector is the most important in floriculture, followed by live plants, bulbs and foliage sectors. Gladiola is an important cut flower worldwide (Thakur et al., 2015Thakur, T.; Dhatt, K.K.; Ahmed, S. 2015. Effect of planting time on growth and flowering of Gladiolus. International Journal of Current Research and Academic Review 3: 145-152.). Major producing countries are the United States, the Netherlands, Italy, France, Bulgaria, India and Israel (Vasanthakumar et al., 2015Vasanthakumar, K.; Bezu, T.; Bekele, A. 2015. Response of varieties and planting dates on growth and flowering of gladiolus (Gladiolus grandiflorus Andrews) under the ecological conditions of Haramaya University, eastern Ethiopia. Journal of Horticulture and Forestry 7: 112-117.) and in Brazil, gladiola is one of the top ten cut flowers (Ibraflor, 2018Instituto Brasileiro de Floricultura [Ibraflor]. 2018. General data of the sector = Dados gerais do setor. Available at: https://www.ibraflor.com.br/numeros-setor [Accessed July 25, 2018] (in Portuguese).
https://www.ibraflor.com.br/numeros-seto...
). Gladiola is propagated from corms and the marketable flower is a spike-type inflorescence, composed of several florets (Schwab et al., 2015Schwab, N.T.; Streck, N.A.; Becker, C.C.; Langner, J.A.; Uhlmann, L.O.; Ribeiro, B.S.M.R. 2015. A phenological scale for the development of Gladiolus. Annals of Applied Biology 166: 496-507.) that open upwards on the spike (Dwivedi et al., 2016Dwivedi, S.K.; Arora, A.; Singh, V.P.; Sairam, R.P.; Bhattacharya, R.C. 2016. Effect of sodium nitroprusside on differential activity of antioxidants and expression of SAGs in relation to vase life of gladiolus cut flowers. Scientia Horticulturae 210: 158-165.).
An important feature of the Brazilian flower market is irregular consumption throughout the year, with peaks and higher prices on festive days such as All Souls' Day and Mother's Day (Junqueira and Peetz, 2017Junqueira, A.H.; Peetz, M.S. 2017. Brazilian consumption of flowers and ornamental plants: habits, practices and trends. Ornamental Horticulture 23: 178-184.). In southern Brazil, which includes Rio Grande do Sul, the El Niño-Southern Oscillation (ENSO) is a major cause of interannual variability in rainfall (Grimm et al., 1998Grimm, A.M.; Ferraz, S.E.T.; Gomes, J. 1998. Precipitation anomalies in southern Brazil associated with El Niño and La Niña events. Journal of Climate 11: 2863-2880.; Aceituno et al., 2009Aceituno, P.; Prieto, M.R.; Solari, M.E.; Martínez, A.; Poveda, G.; Falvey, M. 2009. The 1877-1878 El Niño episode: associated impacts in South America. Climatic Change 92: 389-416.) and temperature (Grimm, 2003Grimm, A.M. 2003. The El Niño impact on the summer monsoon in Brazil: regional processes versus remote influences. Journal of Climate 16: 263-280.; 2004Grimm, A.M. 2004. How do La Niña events disturb the summer monsoon system in Brazil? Climate Dynamics 22: 123-138.; Barros et al., 2002Barros, V.R.; Grimm, A.M.; Doyle, M.E. 2002. Relationship between temperature and circulation in southeastern South America and its influence from El Niño and La Niña events. Journal of the Meteorology Society of Japan 80: 21-32.). Since the development of gladiola is mainly driven by air temperature (Streck et al., 2012Streck, N.A.; Bellé, R.A.; Backes, F.A.A.L.B.; Gabriel, L.F.; Uhlmann, L.O.; Becker, C.C. 2012. Vegetative and reproductive development in gladiolus. Ciência Rural 42: 1968-1974 (in Portuguese, with abstract in English).; Schwab et al., 2015Schwab, N.T.; Streck, N.A.; Becker, C.C.; Langner, J.A.; Uhlmann, L.O.; Ribeiro, B.S.M.R. 2015. A phenological scale for the development of Gladiolus. Annals of Applied Biology 166: 496-507.), this variability in the climate makes it difficult for farmers to plan gladiola production for target dates. There have been reports in Rio Grande do Sul that, during the last 10 years (2009-2018), in certain years, farmers who planted the bulbs on the same day of the year failed to have gladiola flowers ready for All Souls' Day, i.e flowers were either ready too early or after the target day, because of climate variability over the years.
Crop simulation models are important tools for assisting farmers in planning their planting schedule and for improving crop management practices (Anapalli et al., 2005; Soler et al., 2008; Andarzian et al., 2015), for yield forecasting (Silva et al., 2016) and for predicting flowering time (Chen et al., 2010Chen, J.; Funnell, K.A.; Morgan, E.R. 2010. A model for scheduling flowering of a Limonium sinatum × Limonium perezii hybrid. HortScience 45: 1441-1446.; Blanchard et al., 2011Blanchard, M.G.; Runkle, E.S.; Fisher, P.S. 2011. Modeling plant morphology and development of petunia in response to temperature and photosynthetic daily light integral. Scientia Horticulturae 129: 313-320.; Cave et al., 2013Cave, R.L.; Hammer, G.L.; McLean, G.; Birch, C.J.; Erwin, J.E.; Johnston, M.E. 2013. Moddeling temperature, photoperiod and vernalisation responses of Brunonia australis (Goodeniaceae) and Calandrinia sp. (Portulacaceae) to predict flowering time. Annals of Botany 111: 629-639.; Vaid and Runkle, 2013Vaid, T.M.; Runkle, E.S.; 2013. Developing flowering rate models in response to mean temperature for common annual ornamental crops. Scientia Horticulturae 161: 15-23.). Recently, a phenological model, named PhenoGlad, was proposed for gladiola (Uhlmann et al., 2017Uhlmann, L.O.; Streck, N.A.; Becker, C.C.; Schwab, N.T.; Benedetti, R.P.; Charão, A.S.; Ribeiro, B.S.M.R.; Silveira, W.B.; Backes, F.A.A.L.; Alberto, C.M.; Muttoni, M.; Paula, G.M.; Tomiozzo, R.; Bosco, L.C.; Becker, D. 2017. PhenoGlad: a model for simulating development in Gladiolus. European Journal of Agronomy 82: 33-49.). When the crop flower is cultivated in open field, such as gladiola, crop models are powerful tools for scheduling planting dates and for predicting flowering time based on historical daily weather data (Chen et al., 2010Chen, J.; Funnell, K.A.; Morgan, E.R. 2010. A model for scheduling flowering of a Limonium sinatum × Limonium perezii hybrid. HortScience 45: 1441-1446.). The aim of this study was to configure a planting window for gladiola in order to harvest spikes to be sold on All Souls' Day and Mother's Day holidays in Rio Grande do Sul, taking into account the ENSO phases.
Materials and Methods
Site and weather data
This study was conducted in Rio Grande do Sul (Figures 1A and B), southern Brazil, wich presents vegetation composed of Araucarias conifers, the Pampas prairies, coastal vegetation and the Atlantic Forest. The northern half of the state is a plateau with basalt as the origin material of deep soils. In the southern half of the state soils are shallower due to the presence of montmorillonite clays. The state has a tradition in producing and consuming flowers, with a cultivated area of 1,360 ha and a consumption per capita of US$ 9.65 (Ibraflor, 2018Instituto Brasileiro de Floricultura [Ibraflor]. 2018. General data of the sector = Dados gerais do setor. Available at: https://www.ibraflor.com.br/numeros-setor [Accessed July 25, 2018] (in Portuguese).
https://www.ibraflor.com.br/numeros-seto...
). Daily minimum and maximum air temperatures of 55 years (from 1961 to 2015) from 18 weather stations of the Instituto Nacional de Meteorologia (INMET) distributed across the state (Figure 1B) were used (Table 1). Missing data for the period 1980-2013 were filled in with data from Xavier et al. (2016)Xavier, A.C.; King, C.W.; Scanlon, B.R. 2016. Daily gridded meteorological variables in Brazil (1980-2013). International Journal of Climatology 36: 2644-2659., a high-resolution data set of daily minimum and maximum temperature for Brazil. Missing data from the 1961-1979 and 2014-2015 periods were filled with the daily climatological mean of the minimum and maximum temperatures of the entire period for each ENSO phase (Bier and Ferraz, 2017Bier, A.A.; Ferraz, S.E.T. 2017. Comparison of gap filling methodologies for meteorological data in southern Brazil stations. Revista Brasileira de Meteorologia 32: 215-226 (in Portuguese, with abstract in English).).
Maps of South America and Brazil (A) and Rio Grande do Sul with the locations of weather stations of the Brazilian National Weather Service (B) used in this study.
Weather stations, their geographical coordinates, number of years used in the simulations and summary of air temperatures (annual average of lowest minimum and highest maximum temperature) used in this study.
Model description
The PhenoGlad model (Uhlmann et al., 2017Uhlmann, L.O.; Streck, N.A.; Becker, C.C.; Schwab, N.T.; Benedetti, R.P.; Charão, A.S.; Ribeiro, B.S.M.R.; Silveira, W.B.; Backes, F.A.A.L.; Alberto, C.M.; Muttoni, M.; Paula, G.M.; Tomiozzo, R.; Bosco, L.C.; Becker, D. 2017. PhenoGlad: a model for simulating development in Gladiolus. European Journal of Agronomy 82: 33-49.) was used in this study. PhenoGlad is a dynamic process-based model that simulates gladiola phenology on a daily time step without water limitations considering three main phases based on the phenological scale proposed by Schwab et al. (2015)Schwab, N.T.; Streck, N.A.; Becker, C.C.; Langner, J.A.; Uhlmann, L.O.; Ribeiro, B.S.M.R. 2015. A phenological scale for the development of Gladiolus. Annals of Applied Biology 166: 496-507.: the sprouting phase, vegetative phase, and reproductive phase. For each developmental phase, the PhenoGlad model considers different cardinal temperatures. Starting with planting, the developmental stage (DVS) is calculated by accumulating the daily developmental rate using the approach developed by Wang and Engel (1998)Wang, E.; Engel, T. 1998. Simulation of phenological development of wheat crops. Agricultural Systems 58: 1-24.. A nonlinear temperature response function is used to penalize the development of the crop when the daily air temperature is below or above the optimum temperature. The PhenoGlad model simulates the development of selected cultivars for four different maturity groups (MG) of gladiola as follows: Early, Intermediate I, Intermediate II and Late. Each MG has a maximum daily developmental rate that represents a group of cultivars belonging to this MG. Input data for running the PhenoGlad model are daily minimum and maximum air temperatures, planting or emergence date, and cultivar or maturity group. The air temperature is the only factor that controls gladiola development in the PhenoGlad model, since the model was calibrated under a potential condition (without water limitation) and no photoperiod effect was found on the gladiola phenology at the time of calibration (Uhlmann et al., 2017Uhlmann, L.O.; Streck, N.A.; Becker, C.C.; Schwab, N.T.; Benedetti, R.P.; Charão, A.S.; Ribeiro, B.S.M.R.; Silveira, W.B.; Backes, F.A.A.L.; Alberto, C.M.; Muttoni, M.; Paula, G.M.; Tomiozzo, R.; Bosco, L.C.; Becker, D. 2017. PhenoGlad: a model for simulating development in Gladiolus. European Journal of Agronomy 82: 33-49.).
In addition to the previous evaluation by Uhlmann et al. (2017)Uhlmann, L.O.; Streck, N.A.; Becker, C.C.; Schwab, N.T.; Benedetti, R.P.; Charão, A.S.; Ribeiro, B.S.M.R.; Silveira, W.B.; Backes, F.A.A.L.; Alberto, C.M.; Muttoni, M.; Paula, G.M.; Tomiozzo, R.; Bosco, L.C.; Becker, D. 2017. PhenoGlad: a model for simulating development in Gladiolus. European Journal of Agronomy 82: 33-49., the PhenoGlad model was further evaluated in simulating the developmental cycle of gladiola using data from experiments conducted in commercial farms with different cultivars and planting dates in four counties in the state (Table 2). In each of these on-farm experiments, the dates of occurrence of the cumulative leaf number (CLN), heading (R1 stage) and blooming (R2 stage) were observed on 20 plants per cultivar according to gladiolus phenological scale (Schwab et al., 2015Schwab, N.T.; Streck, N.A.; Becker, C.C.; Langner, J.A.; Uhlmann, L.O.; Ribeiro, B.S.M.R. 2015. A phenological scale for the development of Gladiolus. Annals of Applied Biology 166: 496-507.). PhenoGlad was run for these experiments using daily weather data from the nearest automatic weather stations.
Locations, latitude, longitude, planting dates (dd/mm/yyyy) and Gladiola cultivars of the on farm experiments in southern Brazil used for evaluating the PhenoGlad model.
Determining the optimum planting window
The PhenoGlad model was run for four MG of gladiola (Early, Intermediate I, Intermediate II and Late) and for each year of the historical weather data (Table 1). The optimum planting date, for each year, was assumed to be the date of the R2 stage simulated by the model three days before the target dates for selling the flowers, i.e Mother's Day (second Sunday in May) and All Souls' Day (2 Nov). This criterion was chosen because it is a safe threshold for farmers. Mother's Day was assumed to fall on 11 May in all years of the historical series, as this was the most frequent date (mean and moda) observed in the 55 years of meteorological data used in this study.
Each year of historical weather data was classified into its relevant ENSO phase (Very Strong El Niño, El Niño, La Niña or Neutral), according to the Oceanic Niño Index (ONI) anomaly averaged in the Niño 3.4 region (5° N − 5° S, 120° W − 170° W) (NOAA, 2017National Oceanic and Atmospheric Administration [NOAA]. 2017. ENSO: cold and warm episodes by season. NOAA, Washington, DC, USA. Available at: http://www.cpc.ncep.noaa.gov/products/analysis_monitoring/ensostuff/ensoyears.shtml [Accessed Jan 16, 2017]
http://www.cpc.ncep.noaa.gov/products/an...
). ENSO events were defined as a minimum of five consecutive 3-month running mean of Sea Surface Temperature anomalies were equal to or greater than + 0.5 for warm events (El Niño), equal to or greater than + 2.0 for Very Strong El Niño events and equal to or lower than −0.5 for cold events (La Niña) from July until the following June. The resulting years classified according to the ENSO phase are in Table 3. Once the planting date had been simulated for each MG, location and year, the planting dates were averaged for the period of record for each ENSO phase. Variation in the optimum planting window was calculated as a departure of the El Niño and La Niña years from the average of Neutral years. Maps with the optimum planting window of gladiola in Rio Grande do Sul were developed by the Quantum GIS (QGIS) software program using the Inverse Distance Weighting (IDW) method. The optimum planting window was defined as a five day period.
El Niño Southern Oscillation (ENSO) phases (Very Strong El Niño, El Niño, La Niña and Neutral years) used in this study.
A case study
In Santa Maria (latitude: 29°42′ S, longitude: 53°42′ W and altitude: 95 m), we evaluated gladiola production for sale on All Souls' Day (02 Nov 2016) and on Mother's Day (14 May 2017) in a commercial gladiola farm, to demonstrate the practical application of this study. Farmers were used to growing gladiola for more than 20 years for All Soul's Day, but had never grown gladiola for Mother's Day. The crop was not irrigated (rainfed) in either planting. For All Souls' Day, seven cultivars of different MG and colors were used. The planting of the cultivars Gold Field (Late MG), Red Beauty (Intermediate II MG) and Peter Pears (Intermediate I MG) was on 21 July 2016. The cultivars Black Velvet and Green Star (Intermediate II MG), Amsterdam (Intermediate I MG) and White Friendship (Early MG) were planted on 04 Aug 2016. The farmer defined the management practices and planting date of the corms without our advice (based on his own previous experience). For each cultivar, 12 plants were tagged and used to determine the date of the R2 stage. Daily observations were made and the date of the R2 stage was considered when 50 % of the tagged plants had the first three florets showing the color of the petals. Before planting, the forecast for the coming growing season was for a Neutral year, thus we took this forecast into account for testing the approach.
In the crop grown for selling gladiola on Mother's Day, the farmers did not have any previous experience in planting gladiola for this date, because they usually only produced for All Souls' Day. Next, we recommended the farmer consider a Neutral year for the planting window, based on the ENSO forecast for the current growing season provided by international centers (NOAA, 2017National Oceanic and Atmospheric Administration [NOAA]. 2017. ENSO: cold and warm episodes by season. NOAA, Washington, DC, USA. Available at: http://www.cpc.ncep.noaa.gov/products/analysis_monitoring/ensostuff/ensoyears.shtml [Accessed Jan 16, 2017]
http://www.cpc.ncep.noaa.gov/products/an...
). Seven cultivars of different MG and colors were used. The planting of the cultivar Jester (Intermediate II MG) was on 17 Feb 2017. The cultivars Black Velvet and Red Beauty (Intermediate II MG) were planted on 20 Feb 2017 and cultivars Peter Pears (Intermediate I MG), Amsterdam (Intermediate I MG) and Rose Friendship (Early MG) on 24 Feb 2017. For each cultivar, 20 plants were tagged and used to determine the date of 50 % of the R2 stage. The observed date of the harvest point was compared with the target date at the R2 stage. We assumed that the harvesting point should occur within three days before the market date.
Since the PhenoGlad model does not consider soil water deficit, the water balance model of Thornthwaite and Mather (1955)Thornthwaite, C.W.; Mather, J.R. 1955. The Water Balance. Drexel Institute of Technology, Centerton, AR, USA (Publications in Climatology, v.8, n.1). was used to calculate daily soil water in both growing seasons. Input data in this model were daily precipitation (mm), available water capacity (mm), reference evapotranspiration by the Penman-Monteith method (ETo) and crop coefficient (Kc). The maximum crop evapotranspiration (ETc) was calculated as follows: ETc = ETo × Kc. The Kc was 0.7 for sprouting phase and 1.0 for reproductive phase (Allen et al., 1998Allen, R.G.; Pereira, L.S.; Raes, D.; Smith, M. 1998. Crop Evapotranspiration: Guidelines for Computing Crop Water Requirements. FAO, Rome, Italy. (FAO Irrigation and Drainage Paper, 56).). Throughout the gladiola vegetative phase, Kc values were calculated by linear interpolation. If ETc = ETR, then the daily soil water balance status is without stress, and if ETR > ETc then there is water deficit (DEF).
Results
The cumulative leaf number (CLN) simulated by the PhenoGlad model was close to the observed data, with a root mean square error (RMSE) of 0.65 leaves (n = 201). Simulated versus observed days after planting (DAP) for the heading (R1 stage) and blooming (R2 stage) had an RMSE of 4.2 days (n = 33). From a practical viewpoint, an error of four days in model performance is acceptable as not all plants in the population flower on the same day and farmers may store the earliest stems in a cold room.
ENSO Effect on Optimum Planting Window
The effect of ENSO on the optimum planting window of gladiola in Rio Grande do Sul varied for different locations and MG. For harvesting on All Souls' Day, the variation of optimum planting date for Early MG was from +15 days for Very Strong El Niño (a later planting date compared to Neutral years) to −10 days for La Niña years (earlier planting date compared to Neutral years) (Figure 2A). For Intermediate I MG (Figure 2B), the variation in the optimum planting date was from +16 days to −10 days. For Intermediate II MG (Figure 2C), was from +16 days to −12 days and for Late MG (Figure 2D), the variation was from +16 days to −8 days for Very Strong El Niño and for La Niña years, respectively. These results indicate a wide range of optimum planting window dates dependent on the ENSO phase and locations.
Variation of optimum planting date for harvesting gladiola on All Souls' Day as a function of locations across Rio Grande do Sul, Brazil, in Very Strong El Niño, El Niño and La Niña years, compared to Neutral years, for different gladiola maturity groups: Early (A), Intermediate I (B), Intermediate II (C) and Late (D). Error bars represent one standard deviation from the mean.
The location with the greatest difference in optimum planting date among the ENSO phases is Bom Jesus whereas Irai had the lowest effect of ENSO phases (Figure 2A-D). The differences in optimum planting date between Very Strong El Niño and La Niña years in Bom Jesus, was 20 days for Early and Intermediate I MG, 22 days for Intermediate II MG and 19 days for Late MG. These differences are sizeable and considering a single planting date for both ENSO phases leads to a failure in achieving the R2 stage at the target marketing day in several years. In Iraí, the difference between Very Strong El Niño and La Niña years, was only one day for Early MG, three days for Intermediate I, one day for Intermediate II and four days for Late MG, indicating a weak signal of the ENSO in this location.
For harvesting on Mother's Day, the effect of the ENSO phases was different. The variations in optimum planting date had a small difference among the ENSO phases and the optimum planting date in Very Strong El Niño years was earlier compared to Neutral years (Figure 3A-D). The major variation in relation to Neutral years for Very Strong El Niño was seven days for Intermediate II MG (Figure 3B), −3 days in La Niña years for Intermediate I (Figure 3B) and Late (Figure 3D), + two days in El Niño years for Late MG (Figure 3D). For practical purposes, the differences between El Niño, La Niña and Neutral years are minor and can be neglected. However, a difference of seven days observed in the planting date for Very Strong El Niño is important because it is enough to affect the harvest date. Therefore, the optimum planting window was recommended separately for Very Strong El Niño years.
Variation of optimum planting date for harvesting gladiola on Mother's Day as a function of locations across Rio Grande do Sul, Brazil, in Very Strong El Niño, El Niño and La Niña years, compared to Neutral years, for different gladiola maturity groups: Early (A), Intermediate I (B), Intermediate II (C) and Late (D). Error bars represent one standard deviation of the mean.
The optimum planting window of gladiola in Rio Grande do Sul was presented in maps for better viewing the results. For harvesting gladiola on All Souls' Day in Rio Grande do Sul, the optimum planting window was earlier in La Niña years and later in Very Strong El Niño (Figures 4 to 7 (A-D)). Considering the whole state, for Late MG, for example, the optimum planting window varied from 22 June to 26 July in Very Strong El Niño years, from 08 June to 27 July in El Niño years, from 03 June to 22 July in La Niña years and from 06 June to 20 July in Neutral years (Figure 7A-D). In the colder regions of the state, planting should be done earlier because the plants need more days to reach flowering.
Optimum planting date for early maturity group of gladiola in order to harvest spikes to be sold on All Souls' Day holiday in El Niño (A), Very Strong El Niño (B), La Niña (C) and Neutral (D) years and, in order for harvest spikes to be sold on Mother's Day holiday in El Niño, La Niña and Neutral years (E) and in Very Strong El Niño years (F) in Rio Grande do Sul, Brazil.
As previously indicated, the effect of ENSO phases for harvesting on Mother's Day had smaller variation. Only Very Strong El Niño years presented greater variation compared to Neutral years. Therefore, the optimum planting window was indicated separately for this phase of the ENSO (Figures 4F, 5F, 6F and 7F). In El Niño, La Niña and the Neutral years, the recommendation of planting window was the same and therefore they were pooled (Figures 4E, 5E, 6E and 7E). The planting date must be earlier in Very Strong El Niño years compared to the other ENSO phases. For Early MG, for example, the optimum planting window varied from 13 Feb to 04 Mar in Very Strong El Niño years (Figure 4F) and from 17 Feb to 03 Mar in El Niño, La Niña and the Neutral years (Figure 4E). For detailed information on the gladiola optimum planting window, the user can look at the map that corresponds to the gladiolus MG and the ENSO phase for the year of cultivation.
Optimum planting date for Intermediate I maturity group of gladiola in order to harvest spikes to be sold on All Souls' Day holiday in El Niño (A), Very Strong El Niño (B), La Niña (C) and Neutral (D) years and, in order for harvest spikes to be sold on Mother's Day holiday in El Niño, La Niña and Neutral years (E) and in Very Strong El Niño years (F) in Rio Grande do Sul, Brazil.
Optimum planting date for Intermediate II maturity group of gladiola in order to harvest spikes to be sold on All Souls' Day holiday in El Niño (A), Very Strong El Niño (B), La Niña (C) and Neutral (D) years and, in order for harvest spikes to be sold on Mother's Day holiday in El Niño, La Niña and Neutral years (E) and in Very Strong El Niño years (F) in Rio Grande do Sul, Brazil.
Optimum planting date for Late maturity group of gladiola in order to harvest spikes to be sold on All Souls' Day holiday in El Niño (A), Very Strong El Niño (B), La Niña (C) and Neutral (D) years and, in order for harvest spikes to be sold on Mother's Day holiday in El Niño, La Niña and Neutral years (E) and in Very Strong El Niño years (F) in Rio Grande do Sul, Brazil.
A case study
For selling gladiola on All Souls' Day 2016, the farmer planted cultivars with different MG in the same planting date (Table 4). However, all cultivars reached the R2 stage before the target date. The cultivar Peter Pears was planted six days before the recommended period and the R2 stage was reached 11 days before the target date. The cultivar Red Beauty was planted within the recommended period and the R2 stage was reached five days before the target date. Despite the planting being implemented 11 days late, the cultivar Gold reached R2 two days before the target date. For selling gladiola on Mother's Day, the farmer implemented the planting within the recommended period (Table 5) and all cultivars were ready to be marketed during the Mother's Day holiday.
Planting window used by the farmer and the recommended planting date from this study (dd/mm/yy) for target R2 stage three days before the All Souls' Day holiday for different cultivars, in Santa Maria, RS, Brazil.
Planting window used by the farmer and the recommended planting date from this study (dd/mm/yy) for target R2 stage three days before the Mother's Day holiday for different cultivars, in Santa Maria, RS, Brazil.
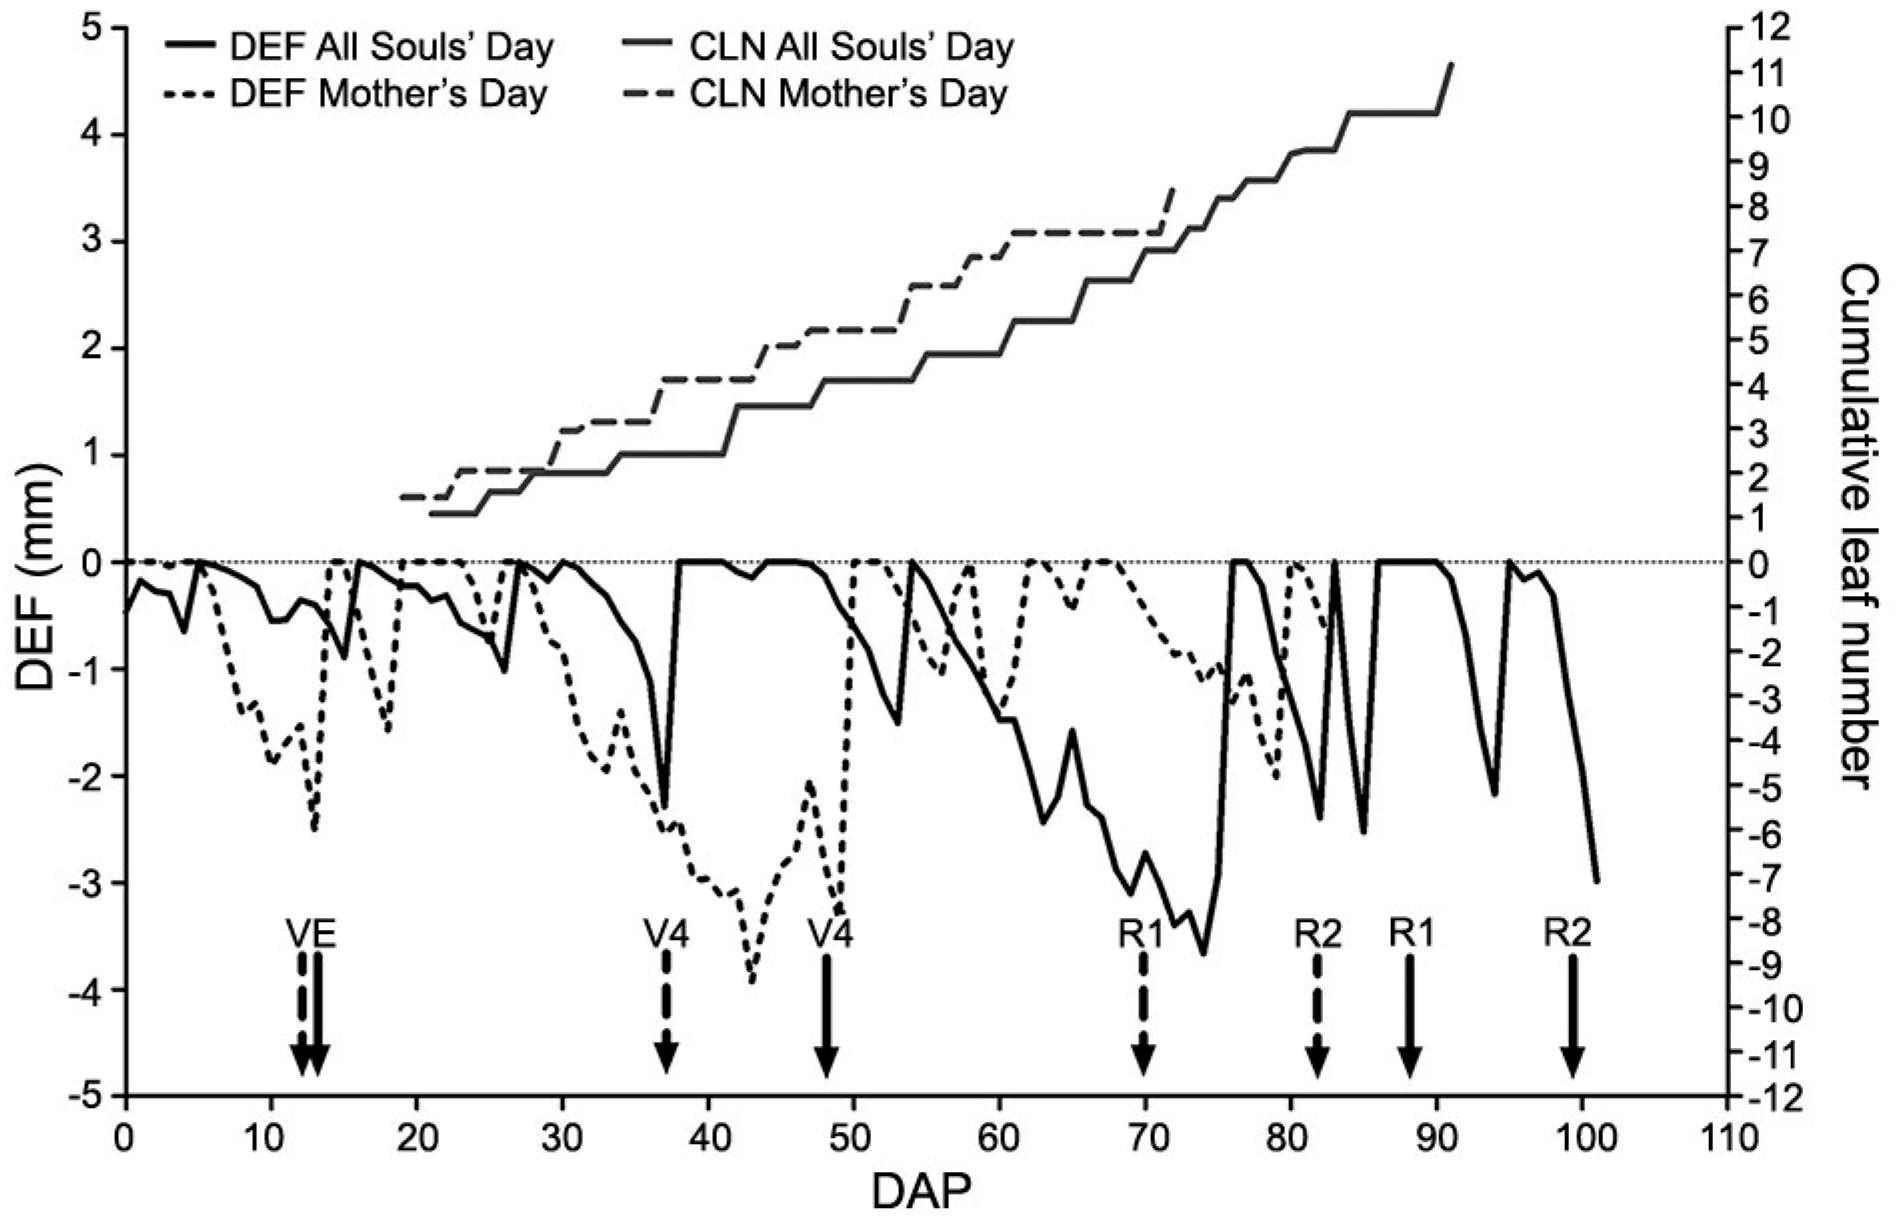
The water soil balance (Figure 8) indicates a mild soil water deficit in both growing seasons. In the growing season for Mother's Day, there was a period of soil water deficit between the V2 and V5 stages (two – five leaves), whereas in the growing season for All Souls' Day the soil water deficit period was between V4 and V8 stage (four – eight leaves).
Daily soil water deficit calculated by the Thortwaite and Mather model (DEF) and cumulative leaf number (CLN) of gladiola throughout the growing seasons for All Souls' Day 2016 (solid line) and for Mother's Day 2017 (dashed line) in the on-farm experiment at Santa Maria, Rio Grande do Sul, Brazil. Arrows indicate the VE (emergence), V4 (four leaves), R1 (heading) and R2 (harvest point) developmental stages for All Souls' Day (solid arrows) and Mother's Day (dashed arrows). DAP refers to days after planting on 21/07/2016 and planting on 17/02/2017.
Discussion
ENSO Effect on Optimum Planting Window
The variations in optimum planting date for gladiola in the individual ENSO phases for the different counties in the state suggest that the ENSO signal is strong enough to impact gladiola phenology. These results indicate that taking the ENSO forecast for planning into account will render the optimum planting date a valuable benefit to farmers. For example, a single planting date recommendation, independent of the ENSO phase, may result in harvesting flowers too early or too late, mainly in the case of All Souls' Day. This is because the ENSO signal on air temperature is stronger in Sept and Oct than in Mar and Apr (Grimm, 1998Grimm, A.M.; Ferraz, S.E.T.; Gomes, J. 1998. Precipitation anomalies in southern Brazil associated with El Niño and La Niña events. Journal of Climate 11: 2863-2880.; 2004Grimm, A.M. 2004. How do La Niña events disturb the summer monsoon system in Brazil? Climate Dynamics 22: 123-138.).
For harvesting on All Souls' Day, the largest variations in optimum planting date was in Bom Jesus county (Figure 2A-D) because of its higher mean temperature during Very Strong El Niño years and lower average temperature in La Niña years in this county (Figure 9A-D). On the other hand, in Iraí the variation in optimum planting date in different ENSO phases was lower (Figure 2A-D), because the signal of ENSO in this location is weak (Figure 9E-H). The ENSO signal differs from region to region in different parts of the world due to site-specific microclimates driven by elevation and latitude (Firpo et al., 2012Firpo, M.A.F.; Sansigolo, C.A.; Assis, S.V. 2012. Climatology and seasonal variability of the number of warm and cold waves in Rio Grande do Sul associated to ENOS. Revista Brasileira de Meteorologia 27: 95-106 (in Portuguese, with abstract in English).; Paz et al., 2012Paz, J.O.; Woli, P.; Garcia y Garcia, A.; Hoogenboom, G. 2012. Cotton yields as influenced by ENSO at different planting dates and spatial aggregation levels. Agricultural Systems 111: 45-52.; Woli et al., 2013Woli, P.; Paz, J.O.; Hoogenboom, G.; Garcia y Garcia, A.; Fraisse, C.W. 2013. The ENSO effect on peanut yield as influenced by planting date and soil type. Agricultural Systems 121: 1-8.).
Daily mean temperature during the growing season for harvesting gladiola on All Souls' Day holiday in Very Strong El Niño years, El Niño years, La Niña years and Neutral years in the counties of Bom Jesus (A, B, C, D) and Iraí (E, F, G, H).
The ENSO signal in southern Brazil is detected mainly during the spring (Grimm, 1998Grimm, A.M.; Ferraz, S.E.T.; Gomes, J. 1998. Precipitation anomalies in southern Brazil associated with El Niño and La Niña events. Journal of Climate 11: 2863-2880.; 2004Grimm, A.M. 2004. How do La Niña events disturb the summer monsoon system in Brazil? Climate Dynamics 22: 123-138.), which includes the months of gladiola growing season for marketing flowers on the All Souls' Day holiday. The delay in the planting window for harvesting on All Souls' Day in Very Strong El Niño events is due to an increase in air temperature that accelerates the crop development (Streck et al., 2012Streck, N.A.; Bellé, R.A.; Backes, F.A.A.L.B.; Gabriel, L.F.; Uhlmann, L.O.; Becker, C.C. 2012. Vegetative and reproductive development in gladiolus. Ciência Rural 42: 1968-1974 (in Portuguese, with abstract in English).; Schwab et al., 2015Schwab, N.T.; Streck, N.A.; Becker, C.C.; Langner, J.A.; Uhlmann, L.O.; Ribeiro, B.S.M.R. 2015. A phenological scale for the development of Gladiolus. Annals of Applied Biology 166: 496-507.). The increase in minimum and mean daily temperature in southern Brazil during the spring of the El Niño events is a consequence of increased cloudy days arising from the enhancement of warm advection at low levels in the atmosphere (Barros et al., 2002Barros, V.R.; Grimm, A.M.; Doyle, M.E. 2002. Relationship between temperature and circulation in southeastern South America and its influence from El Niño and La Niña events. Journal of the Meteorology Society of Japan 80: 21-32.). Furthermore, Firpo et al. (2012)Firpo, M.A.F.; Sansigolo, C.A.; Assis, S.V. 2012. Climatology and seasonal variability of the number of warm and cold waves in Rio Grande do Sul associated to ENOS. Revista Brasileira de Meteorologia 27: 95-106 (in Portuguese, with abstract in English). reported a greater number of heat waves during El Niño years and cold waves during La Niña years in Rio Grande do Sul. La Niña events lead to lower temperatures during the spring in southern Brazil due to the northward displacement of cold fronts (Grimm, 2004Grimm, A.M. 2004. How do La Niña events disturb the summer monsoon system in Brazil? Climate Dynamics 22: 123-138.). Therefore, for harvesting gladiola on All Souls' Day during La Niña years, gladiola planting should be earlier.
The ENSO influence on the optimum planting date for harvesting gladiola on Mother's Day was much lower (Figure 3A-D) because of the lower effect of ENSO on air temperature during the fall, which includes the months of gladiola cultivation for marketing on Mother's Day holiday (Grimm, 1998Grimm, A.M.; Ferraz, S.E.T.; Gomes, J. 1998. Precipitation anomalies in southern Brazil associated with El Niño and La Niña events. Journal of Climate 11: 2863-2880.; 2004Grimm, A.M. 2004. How do La Niña events disturb the summer monsoon system in Brazil? Climate Dynamics 22: 123-138.). Only in Very Strong El Niño events should the planting be earlier when the temperature is lower, which lengthens the gladiola cycle (Schwab et al., 2015Schwab, N.T.; Streck, N.A.; Becker, C.C.; Langner, J.A.; Uhlmann, L.O.; Ribeiro, B.S.M.R. 2015. A phenological scale for the development of Gladiolus. Annals of Applied Biology 166: 496-507.).
The influence of ENSO was also reported in the southeastern USA, northeastern China, Georgia – EUA and Paraguay affecting the yield of peanut (Woli et al., 2013Woli, P.; Paz, J.O.; Hoogenboom, G.; Garcia y Garcia, A.; Fraisse, C.W. 2013. The ENSO effect on peanut yield as influenced by planting date and soil type. Agricultural Systems 121: 1-8.), maize (Zhang et al., 2015Zhang, Z.; Feng, B.; Shuai, J.; Shi, P. 2015. ENSO-climate fluctuation-crop yield early warning system: a case study in Jilin and Liaoning Province in northeast China. Physics and Chemistry of the Earth 87-88: 10-18.), cotton (Paz et al., 2012Paz, J.O.; Woli, P.; Garcia y Garcia, A.; Hoogenboom, G. 2012. Cotton yields as influenced by ENSO at different planting dates and spatial aggregation levels. Agricultural Systems 111: 45-52.) and soybean (Fraisse et al., 2008Fraisse, C.W.; Cabrera, V.E.; Breuer, N.E.; Baez, J.; Quispe, J.; Matos, E. 2008. El Niño: southern oscillation influences on soybean yields in eastern Paraguay. International Journal of Climatology 28: 1399-1407.), mainly because critical stages in these crops coincided with periods of water deficiency. These results indicate that shifting the optimum planting date is a strategy aimed at mitigating the negative effects of ENSO in scheduling crop production (Fraisse et al., 2008Fraisse, C.W.; Cabrera, V.E.; Breuer, N.E.; Baez, J.; Quispe, J.; Matos, E. 2008. El Niño: southern oscillation influences on soybean yields in eastern Paraguay. International Journal of Climatology 28: 1399-1407.; Paz et al., 2012Paz, J.O.; Woli, P.; Garcia y Garcia, A.; Hoogenboom, G. 2012. Cotton yields as influenced by ENSO at different planting dates and spatial aggregation levels. Agricultural Systems 111: 45-52.; Woli et al., 2013Woli, P.; Paz, J.O.; Hoogenboom, G.; Garcia y Garcia, A.; Fraisse, C.W. 2013. The ENSO effect on peanut yield as influenced by planting date and soil type. Agricultural Systems 121: 1-8.).
Modeling studies with flower crops have been conducted for Antirrhinum manus L. (Munir et al., 2015Munir, M.; Hadley, P.; Carew, J.; Adams, S.; Pearson, S.; Sudhakar, B. 2015. Effect of constant temperatures and natural daylength on flowering time and leaf number of Antirrhinum using the photo-thermal model. Pakistan Journal of Botany 47: 1717-1720.), Brunonia australis and Calandrinia sp. (Cave et al., 2013Cave, R.L.; Hammer, G.L.; McLean, G.; Birch, C.J.; Erwin, J.E.; Johnston, M.E. 2013. Moddeling temperature, photoperiod and vernalisation responses of Brunonia australis (Goodeniaceae) and Calandrinia sp. (Portulacaceae) to predict flowering time. Annals of Botany 111: 629-639.), Salvia splendens and Tagetes patula (Moccaldi and Runkle, 2007Moccaldi, L.A.; Runkle, E.S. 2007. Modeling the effects of temperature and photosynthetic daily integral on growth and flowering of Salvia splendens and Tagetes patula. Journal of the American Society for Horticultural Science 132: 283-288.) aiming to optimize the environmental production factors and to schedule flowering for specific periods of the year. The ENSO effects on the development of ornamental crops has not been evaluated probably because most of these crops, unlike gladiola, are grown in greenhouses, where the temperature is modified (Moccaldi and Runkle, 2007Moccaldi, L.A.; Runkle, E.S. 2007. Modeling the effects of temperature and photosynthetic daily integral on growth and flowering of Salvia splendens and Tagetes patula. Journal of the American Society for Horticultural Science 132: 283-288.). Gladiola is an important open field flower crop for farmers in southern Brazil, and therefore this study is of high importance to their sustainability.
A case study
Some number of cultivars that were planted almost two weeks later than recommended by this study (cultivars Gold Field, Black Velvet and Green Star) still reached the R2 stage before the target date in the growing season for All Souls' Day. Some soil deficit may have affected plant development accelerating crop development (Paiva et al., 2012Paiva, P.D.O.; Fernandes, K.D.; Ceratti, M. 2012. Gladiola = Gladíolo. p. 448-470. In: Paiva, P.D.O.; Almeida, E.F.A. Production of cut flowers = Produção de flores de corte. UFLA, Lavras, MG, Brazil (in Portuguese).). The soil water balance during this growing season (Figure 8) indicated a 21 day period of mild soil water deficit between the V4 and V8 stages (from 55 to 75 days after the 21 July planting date). If this mild water stress had not occurred during the growing season, these cultivars may not have reached the harvest point in time to be marketed on All Souls' Day, thereby reducing the market value (Fisher and Lieth, 2000Fisher, P.R.; Lieth, J.H. 2000. Variability in flower development of Easter lily (Lilium longiflorum Thunb.): model and decision-support system. Computers and Electronics in Agriculture 26: 53-64.). Water stress can decrease the quality of the floral stems of gladiolus (Porto et al., 2014Porto, R.A.; Koetz, M.; Bonfim-Silva, E.M.; Polizel, A.C.; Silva, T.J.A. 2014. Effects of water replacement levels and nitrogen fertilization on growth and production of gladiolus in a greenhouse. Agricultural Water Management 131: 50-56.). Thus, it is important that farmers carry out disciplined irrigation in the plants.
Among the cultivars, Peter Pears reached the R2 stage 11 days before the target date. The farmer stored the floral stems of this cultivar in a cold chamber in order to reduce the opening rate of the florets (Schwab et al., 2014Schwab, N.T.; Streck, N.A.; Langner, J.A.; Ribeiro, B.S.M.R.; Uhlmann, L.O.; Becker, C.C. 2014. Applicability of the term anthochron for representing the speed rate of flower opening on the inflorescence. Pesquisa Agropecuária Brasileira 49: 657-664 (in Portuguese, with abstract in English).). For farmers who do not have a cold chamber, knowing the optimal planting date is crucial. However, even for farmers that do have a cold chamber, planting at the right time reduces the costs with cold storage. The worst scenario for farmers is when the harvest point is after the selling target day.
During the growing season for Mother's Day, there was a period of soil water deficit when the plants were between the V2 and V5 stages (from 26 to 50 days after the planting date of 17 Feb). During this period, the mild deficit did not affect plant development because of reserves of the old corm up to the V4 stage (Schwab et al., 2015Schwab, N.T.; Streck, N.A.; Becker, C.C.; Langner, J.A.; Uhlmann, L.O.; Ribeiro, B.S.M.R. 2015. A phenological scale for the development of Gladiolus. Annals of Applied Biology 166: 496-507.). The farmer had never produced gladiola for Mother's Day and if he had used the length of the developmental cycle cultivated in the spring (for All Souls' Day) as a reference, as he was used to, planting would have been much earlier and plants would have flowered before Mother's Day.
Conclusion
The optimum planting date of gladiola in Rio Grande do Sul, Brazil, varies according to the ENSO phase, mainly for All Souls' Day, whose growing season occurs during the spring. At this time of year, the signal of the ENSO phenomenon is more pronounced. A case study demonstrates the practical application of this study and emphasizes the importance of knowing the optimum planting window for each maturation group of gladiola and for each year conditions so as to ensure that floral stems are ready on time to be marketed at peak consumption. The farmer, even without experience of planting for selling gladiola on Mother's Day, was able to schedule his production based on the findings of this study.
Acknowledgements
Authors thank to Bruna San Martin Rolim Ribeiro, Eduardo Evaldt da Silveira, Eduarda Coelho Becker, Jaine Schroter and Simone Puntel for their valuable help in collecting data. This study was supported by Conselho Nacional de Desenvolvimento Científico e Tecnológico (CNPq) (Proc. No. 302858/2015-6) and Coordenação de Aperfeiçoamento de Pessoal de Nível Superior (CAPES).
References
- Aceituno, P.; Prieto, M.R.; Solari, M.E.; Martínez, A.; Poveda, G.; Falvey, M. 2009. The 1877-1878 El Niño episode: associated impacts in South America. Climatic Change 92: 389-416.
- Allen, R.G.; Pereira, L.S.; Raes, D.; Smith, M. 1998. Crop Evapotranspiration: Guidelines for Computing Crop Water Requirements. FAO, Rome, Italy. (FAO Irrigation and Drainage Paper, 56).
- Barros, V.R.; Grimm, A.M.; Doyle, M.E. 2002. Relationship between temperature and circulation in southeastern South America and its influence from El Niño and La Niña events. Journal of the Meteorology Society of Japan 80: 21-32.
- Bier, A.A.; Ferraz, S.E.T. 2017. Comparison of gap filling methodologies for meteorological data in southern Brazil stations. Revista Brasileira de Meteorologia 32: 215-226 (in Portuguese, with abstract in English).
- Blanchard, M.G.; Runkle, E.S.; Fisher, P.S. 2011. Modeling plant morphology and development of petunia in response to temperature and photosynthetic daily light integral. Scientia Horticulturae 129: 313-320.
- Cave, R.L.; Hammer, G.L.; McLean, G.; Birch, C.J.; Erwin, J.E.; Johnston, M.E. 2013. Moddeling temperature, photoperiod and vernalisation responses of Brunonia australis (Goodeniaceae) and Calandrinia sp. (Portulacaceae) to predict flowering time. Annals of Botany 111: 629-639.
- Chen, J.; Funnell, K.A.; Morgan, E.R. 2010. A model for scheduling flowering of a Limonium sinatum × Limonium perezii hybrid. HortScience 45: 1441-1446.
- Dwivedi, S.K.; Arora, A.; Singh, V.P.; Sairam, R.P.; Bhattacharya, R.C. 2016. Effect of sodium nitroprusside on differential activity of antioxidants and expression of SAGs in relation to vase life of gladiolus cut flowers. Scientia Horticulturae 210: 158-165.
- Firpo, M.A.F.; Sansigolo, C.A.; Assis, S.V. 2012. Climatology and seasonal variability of the number of warm and cold waves in Rio Grande do Sul associated to ENOS. Revista Brasileira de Meteorologia 27: 95-106 (in Portuguese, with abstract in English).
- Fisher, P.R.; Lieth, J.H. 2000. Variability in flower development of Easter lily (Lilium longiflorum Thunb.): model and decision-support system. Computers and Electronics in Agriculture 26: 53-64.
- Fraisse, C.W.; Cabrera, V.E.; Breuer, N.E.; Baez, J.; Quispe, J.; Matos, E. 2008. El Niño: southern oscillation influences on soybean yields in eastern Paraguay. International Journal of Climatology 28: 1399-1407.
- Grimm, A.M. 2003. The El Niño impact on the summer monsoon in Brazil: regional processes versus remote influences. Journal of Climate 16: 263-280.
- Grimm, A.M. 2004. How do La Niña events disturb the summer monsoon system in Brazil? Climate Dynamics 22: 123-138.
- Grimm, A.M.; Ferraz, S.E.T.; Gomes, J. 1998. Precipitation anomalies in southern Brazil associated with El Niño and La Niña events. Journal of Climate 11: 2863-2880.
- Instituto Brasileiro de Floricultura [Ibraflor]. 2018. General data of the sector = Dados gerais do setor. Available at: https://www.ibraflor.com.br/numeros-setor [Accessed July 25, 2018] (in Portuguese).
» https://www.ibraflor.com.br/numeros-setor - Junqueira, A.H.; Peetz, M.S. 2017. Brazilian consumption of flowers and ornamental plants: habits, practices and trends. Ornamental Horticulture 23: 178-184.
- Moccaldi, L.A.; Runkle, E.S. 2007. Modeling the effects of temperature and photosynthetic daily integral on growth and flowering of Salvia splendens and Tagetes patula Journal of the American Society for Horticultural Science 132: 283-288.
- Munir, M.; Hadley, P.; Carew, J.; Adams, S.; Pearson, S.; Sudhakar, B. 2015. Effect of constant temperatures and natural daylength on flowering time and leaf number of Antirrhinum using the photo-thermal model. Pakistan Journal of Botany 47: 1717-1720.
- National Oceanic and Atmospheric Administration [NOAA]. 2017. ENSO: cold and warm episodes by season. NOAA, Washington, DC, USA. Available at: http://www.cpc.ncep.noaa.gov/products/analysis_monitoring/ensostuff/ensoyears.shtml [Accessed Jan 16, 2017]
» http://www.cpc.ncep.noaa.gov/products/analysis_monitoring/ensostuff/ensoyears.shtml - Paz, J.O.; Woli, P.; Garcia y Garcia, A.; Hoogenboom, G. 2012. Cotton yields as influenced by ENSO at different planting dates and spatial aggregation levels. Agricultural Systems 111: 45-52.
- Paiva, P.D.O.; Fernandes, K.D.; Ceratti, M. 2012. Gladiola = Gladíolo. p. 448-470. In: Paiva, P.D.O.; Almeida, E.F.A. Production of cut flowers = Produção de flores de corte. UFLA, Lavras, MG, Brazil (in Portuguese).
- Porto, R.A.; Koetz, M.; Bonfim-Silva, E.M.; Polizel, A.C.; Silva, T.J.A. 2014. Effects of water replacement levels and nitrogen fertilization on growth and production of gladiolus in a greenhouse. Agricultural Water Management 131: 50-56.
- Schwab, N.T.; Streck, N.A.; Becker, C.C.; Langner, J.A.; Uhlmann, L.O.; Ribeiro, B.S.M.R. 2015. A phenological scale for the development of Gladiolus. Annals of Applied Biology 166: 496-507.
- Schwab, N.T.; Streck, N.A.; Langner, J.A.; Ribeiro, B.S.M.R.; Uhlmann, L.O.; Becker, C.C. 2014. Applicability of the term anthochron for representing the speed rate of flower opening on the inflorescence. Pesquisa Agropecuária Brasileira 49: 657-664 (in Portuguese, with abstract in English).
- Streck, N.A.; Bellé, R.A.; Backes, F.A.A.L.B.; Gabriel, L.F.; Uhlmann, L.O.; Becker, C.C. 2012. Vegetative and reproductive development in gladiolus. Ciência Rural 42: 1968-1974 (in Portuguese, with abstract in English).
- Thakur, T.; Dhatt, K.K.; Ahmed, S. 2015. Effect of planting time on growth and flowering of Gladiolus. International Journal of Current Research and Academic Review 3: 145-152.
- Thornthwaite, C.W.; Mather, J.R. 1955. The Water Balance. Drexel Institute of Technology, Centerton, AR, USA (Publications in Climatology, v.8, n.1).
- Uhlmann, L.O.; Streck, N.A.; Becker, C.C.; Schwab, N.T.; Benedetti, R.P.; Charão, A.S.; Ribeiro, B.S.M.R.; Silveira, W.B.; Backes, F.A.A.L.; Alberto, C.M.; Muttoni, M.; Paula, G.M.; Tomiozzo, R.; Bosco, L.C.; Becker, D. 2017. PhenoGlad: a model for simulating development in Gladiolus. European Journal of Agronomy 82: 33-49.
- Vaid, T.M.; Runkle, E.S.; 2013. Developing flowering rate models in response to mean temperature for common annual ornamental crops. Scientia Horticulturae 161: 15-23.
- Vasanthakumar, K.; Bezu, T.; Bekele, A. 2015. Response of varieties and planting dates on growth and flowering of gladiolus (Gladiolus grandiflorus Andrews) under the ecological conditions of Haramaya University, eastern Ethiopia. Journal of Horticulture and Forestry 7: 112-117.
- Xavier, A.C.; King, C.W.; Scanlon, B.R. 2016. Daily gridded meteorological variables in Brazil (1980-2013). International Journal of Climatology 36: 2644-2659.
- Wang, E.; Engel, T. 1998. Simulation of phenological development of wheat crops. Agricultural Systems 58: 1-24.
- Woli, P.; Paz, J.O.; Hoogenboom, G.; Garcia y Garcia, A.; Fraisse, C.W. 2013. The ENSO effect on peanut yield as influenced by planting date and soil type. Agricultural Systems 121: 1-8.
- Zhang, Z.; Feng, B.; Shuai, J.; Shi, P. 2015. ENSO-climate fluctuation-crop yield early warning system: a case study in Jilin and Liaoning Province in northeast China. Physics and Chemistry of the Earth 87-88: 10-18.
Edited by
Publication Dates
-
Publication in this collection
20 Dec 2019 -
Date of issue
2020
History
-
Received
03 Oct 2018 -
Accepted
24 Apr 2019