ABSTRACT:
The quality of sparkling wine reflects the climate and management of vineyard, since these factors affect grape development, berry composition, and base wine composition. ‘Chardonnay’ vines were subjected to five in-row spacing distances (0.5; 0.75; 1.0; 1.50; and 2.0 m) combined with and without shoot thinning. For each in-row spacing, vines were thinned to 5, 8, 10, 15, and 20 shoots per plant. Vegetative growth, yield, berry composition and base wine composition were analyzed for two years. Vines with decreased in-row spacing, presented fewer clusters and malic acid content in berries, mostly related to the shading effect. Shoot thinning increased bud fruitfulness and decreased leaf area per meter, leaf area per plant, and leaf layer number. In-row spacing from 1.5 m to 0.5 m showed promising results for the Southeast Brazil with higher yield per hectare and sufficient acidity to provide freshness in sparkling wines.
Keywords:
Vitis vinifera; vine spacing; canopy management; grape quality; sparkling wine
Introduction
The sparkling wine market is the fastest growing segment of the wine market in Brazil, with a growth of 17 % in volume of traded wine in the last seven years (UVIBRA, 2018União Brasileira de Vitivinicultura [UVIBRA]. 2018. Commercialization of wines and by-products elaborated in the RS from 2012 to 2017 = Comercialização de vinhos e derivados elaborados no RS de 2012 à 2017. Available at: http://www.uvibra.com.br/pdf/comercializacao2012a2017_dez.pdf [Accessed June 5, 2019] (in Portuguese).
http://www.uvibra.com.br/pdf/comercializ...
). The Brazilian wine industry is internationally recognized by the quality of its sparkling wine. High quality is related to climate and the southeastern region of Brazil presents an ideal climate for regions above 1000 m. This climate enables the production of ‘Chardonnay’ vines for sparkling wines production, as reported by Regina et al. (2010)Regina, M.A.; Carmo, E.L.; Fonseca, A.R.; Purgatto, E.; Shiga, T.M.; Lajolo, F.M.; Ribeiro, A.P.; Mota, R.V. 2010. Altitude influence on the quality of ‘Chardonnay’ and ‘Pinot noir’ grapes in the state of Minas Gerais. Revista Brasileira de Fruticultura 32: 143-150 (in Portuguese, with abstract in English)..
High acidity (from 10 to 16 g L–1 of tartaric acid), low pH (from 2.9 to 3.2) and sugar concentration (from 16.2° to 21.5 °Brix) in berries are ideal characteristics for producing sparkling wines (Jones et al., 2014Jones, J.E.; Kerslake, F.L.; Close, D.C.; Dambergs, R.G. 2014. Viticulture for sparkling wine production: a review. American Journal of Enology and Viticulture 65: 407-416.). Besides climate conditions, vineyard management, such as pruning system and canopy management, affect vine performance and berry composition. In-row spacing not only affects the planting density, but also the level of environment exploration by the vine. Narrower spacing induces competition for water and nutrients between the vine root systems and between the canopies for light, since it affects both root and shoot densities (Hunter, 1998Hunter, J.J. 1998. Plant spacing implications for grafted grapevine. 1. Soil characteristics, root growth, dry matter partitioning, dry matter composition and soil utilisation. South African Journal of Enology and Viticulture 19: 25-34.; Smart, 1988Smart, R.E. 1988: Shoot spacing and canopy light microclimate. American Journal of Enology and Viticulture 39: 325-333.; Reynolds et al., 2004Reynolds, A.G.; Wardle, D.A.; Cliff, M.A.; King, M. 2004. Impact of training system and vine spacing on vine performance, berry composition and wine sensory attributes of Riesling. American Journal of Enology and Viticulture 55: 96-103.). The choice of planting density for a commercial vineyard is extremely important since it influences the initial investment and yield per hectare for the winegrower. However, little or no impact of vine spacing regarding berry composition and wine quality have been reported (Bernizzoni et al., 2009Bernizzoni, F.; Gatti, M.; Civardi, S.; Poni, S. 2009. Long-term performance of Barbera grown under different training systems and within-row vine spacings. American Journal of Enology and Viticulture 60: 339-348.; Heuvel et al., 2013Heuvel, J.E.V.; Lerch, S.D.; Lenerz, C.C.; Meyers, J.M.; Mansfield, A.K. 2013. Training system and vine spacing impact vine growth, yield, and fruit composition in a vigorous young ‘Noiret’ vineyard. Hortechnology 23: 505-510.). Shoot thinning is a recommended practice primarily for vertical shoot positioned vineyards. It affects crop load and source-sink balance within the vine, reduces the canopy density, and improves canopy microclimate, which has an overall effect on berry quality (Smart, 1988Smart, R.E. 1988: Shoot spacing and canopy light microclimate. American Journal of Enology and Viticulture 39: 325-333.; Reynolds et al., 1994aReynolds, A.G.; Edwards, C.G.; Wardle, D.A.; Webster, D.R.; Dever, M. 1994a. Shoot density affects ‘Riesling’ grapevines. I. Vine performance. Journal of American Society for Horticultural Science 119: 874-880., bReynolds, A.G.; Edwards, C.G.; Wardle, D.A.; Webster, D.R.; Dever, M. 1994b. Shoot density affects ‘Riesling’ grapevines. II. Wine composition and sensory response. Journal of American Society for Horticultural Science 119: 881-892.; Junquera et al., 2011Junquera, L.P.; Jiménez, P.; Sánchez-de-Miguel, J.R.P.; Lissarrague, J.R. 2011. Effect of shoot number on vine balance and berry composition of Tempranillo grapevines. Progrès Agricole et Viticole 128: 32-38.). The ideal shoot density depends directly on cultivar used and the vineyard site (Reynolds et al., 2005Reynolds, A.G.; Molek, T.; De Savigny, C. 2005. Timing of shoot thinning in Vitis vinífera: Impacts on yield and fruit composition variables. American Journal of Enology and Viticulture 56: 343-356.). No studies have investigated ‘Chardonnay’ vineyard management, or vine density, and pruning methods in southeastern regions in Brazil (Mendonça et al., 2016Mendonça, T.R.; Mota, R.V.; Souza, C.R.; Dias, F.A.N.; Pimentel, R.M.A.; Regina, M. A. 2016. Pruning management of Chardonnay at high altitude. Bragantia 75: 57-62.). Therefore, this work aimed to compare the effects of five in-row spacing measurements and two shoot thinning treatments on vegetative growth, berry composition, and wine quality in order to recommend the ideal in-row spacing and canopy management to produce higher quality sparkling wines in southeastern Brazil.
Materials and Methods
Vine site and experimental design
The vineyard was established in 2009, in the city of Caldas, southern Minas Gerais State, Brazil, (21°55’ S, 46°23’ W) at an altitude of 1,100 m with ‘Chardonnay’ clone 76 -ENTAV-INRA grafted onto ‘1103 Paulsen’. The sum of precipitation and average maximum and minimum air temperatures, from Sept to Jan in both cycles presented in this study were recorded and are shown in Figure 1.
Sum of rainfall, in millimeters, and average maximum and minimum air temperature for 2017 and 2018 cycles, Caldas, MG, Brazil. Total sum of rainfall was 266 mm for 2017 and 230.8 mm for 2018.
Treatments consisted of five planting densities and two shoot thinning treatments. All planting density treatments had the same row spacing of 2.5 m (between planted rows) and the plant in-row spacing varied from 0.5 m to 2.0 m (between vines). The experiment was designed in a 5 × 2 subdivided plot, with five in-row spacing measurements as the main plot and a subplot for the shoot thinning treatment, with eight replications, completely randomized per treatment. Each main plot had four rows of vines and two rows of borderline. All the sampling was taken from two internal rows.
The in-row spacing varied as follows: 0.5 m, 0.75 m, 1.0 m, 1.5 m, and 2.0 m, resulting in 8000, 5333, 4000, 2667 and 2000 vines per hectare, respectively. Regarding the shoot thinning treatments, part of the vineyard was thinned to the same number of shoots per hectare, at 40,000 shoots per hectare, and the other portion was not thinned. In order to reach the 40,000 shoots per hectare, all vines of each planting density were thinned to different numbers of shoots per vine; vines in 2,000 plants per hectare (plant ha–1) density treatment were thinned to 20 shoots per vine, in 2,667 plant ha–1 to 15 shoots per vine, in 4,000 plant ha–1 to ten hoots per vine, in 5,333 plant ha–1 to eight shoots per vine, and in 8,000 plant ha–1 to five shoots per vine, as shown in Table 1. Each plot was one replication, with one plant per replication.
Planting density, in-row spacing, area per plant, vineyard bud load, and number of shoots for non-thinned (NT) and thinned treatments (T), for Chardonnay variety in 2017, Caldas, MG, Brazil.
The vines were trained in a vertical shoot positioning trellis system, with bilateral cordons and double spur pruned. The shoot thinning treatment was performed by removing shoots after budburst and before the shoots achieved the first wire (before single flowers were separated). Fertilization, disease and pest control managements were applied equally to all treatments, in accordance with standard commercial practices for Chardonnay cultivar (Goldammer, 2018Goldammer, T. 2018. Grape Growers Handbook: A Guide to Viticulture for Wine Production. Apex, Centreville, VA, USA.).
In Oct 2015, hail impaired the development of vines for the subsequent cycle of 2016. Therefore, this study addresses the 2017 and 2018 seasons only.
Vine vigor analysis
Leaf area per plant (LA) and per row meter (LAm) were measured before shoot trimming. For measuring the leaf area per plant, four vines per treatment were used, and for measuring the leaf area per row meter, six random linear meters were used in each treatment. The single leaf area was estimated by the equation y= –14.68 + 1.73x + 0.30x2, in which “y” is the estimated single leaf area, and “x” is the sum of the lengths of the two main lateral veins (Regina et al., 2000Regina, M.A.; Pereira, G.E.; Cançado, G.M.A.; Rodrigues, D.J. 2000. Calculation of vine leaf área by non-destructive method = Cálculo da área foliar em videira por método não destrutivo. Revista Brasileira de Fruticultura 22: 31-313 (in Portuguese).). The average leaf area of shoots was calculated by multiplying the total number of leaves per shoot by the average single leaf area. The average single leaf area was obtained from 8-10 leaves per shoot, the average shoot leaf area from four shoots per vine, and the leaf area per row meter from linear meter. The total leaf area per vine and per row meter was calculated by multiplying the average shoot leaf area by the total number of shoots per vine or total number of shoots per linear meter.
The leaf layer number (LLN) was measured after veraison, as described by Smart and Robinson (1991)Smart, R.E.; Robinson, M. 1991. Sunlight into Wine: A Handbook for Wine Grape Canopy Management. Winetitles Media, Adelaide, Australia.. Each insertion was applied to 16 plants, with four insertions (two in each cordon) per plant, totaling 64 insertions per treatment. To quantify the vegetative and reproductive balance, the leaf area to fruit weight ratio (m2 kg–1) was calculated.
Yield components
Bud fruitfulness was obtained during full bloom and calculated by dividing the number of inflorescences per number of shoots per plant considering eight plants for each treatment.
At harvest, yield and the total cluster number were recorded for eight vines for each treatment. The yield per hectare was estimated by multiplying the average yield of eight plants for the total number of vines per hectare for each treatment.
Grape and must composition
A hundred berries were crushed by hand and the resulting must was used for measuring pH, titratable acidity (TA), and soluble solids (°Brix). To measure the pH, TA, and soluble solids a digital potentiometer, titration with 0.1N NaOH with phenolphthalein as an indicator, and a portable digital refractometer were used, respectively.
A must sample was collected to quantify the tartaric and malic acids, both determined in the acid fraction obtained after passing the sample through an anion exchange resin, according to McCord et al. (1984)McCord, J.D.; Trousdale, E.; Ryu, D.D.Y. 1984. An improved sample preparation procedure for the analysis of major organic compounds in grape must and wine by high performance liquid chromatography. American Journal of Enology and Viticulture 35: 28-29.. As an internal standard, 10 µL of Isobutyric acid (2.5 µg µL–1) was used for each 1 mL aliquot of the sample, which was added before the sample was passed through the resin. A 5 µL aliquot of the filtered acid fraction (0.45 µm filter) was injected into an Agilent 1260 Infinity liquid chromatograph equipped with a SupelcoGel C-610H column (Supelco, 30 cm × 7.8 mm) adjusted to 30 °C and a diode array detector (DAD) at 210 nm. The isocratic run was performed with aqueous phosphoric acid solution at 0.5 %, as the mobile phase. The identification and quantification of the chromatograms were based for calibration curves with a standard solution of tartaric and malic acids.
Winemaking and base wine analysis
After harvest, berries were stored in a cool chamber for 24 h at 10 °C. For each treatment, 25.2 kg of berries were destemmed by hand and crushed. The resulting must, with an average density of 1.0693 for all treatments, was separated from the solids and placed in 13.25 L glass carboy, where 2 g per hectoliter of pectolitic enzyme and 100 mg SO2 kg–1 were added. The cold settling occurred at 10 °C for 48 h, followed by the racking for 13.25 L glass carboy. The clear must was inoculated with rehydrated wine yeast 20 g hL–1 (Saccharomyses cerevisiae bayanus) and corrected with glucose to achieve 11 % alcohol with 20 g hL–1 of fermentation activator added.
The density was measured daily during alcoholic fermentation at 17 °C. When density consistently reached 990 and the residual sugars were below 3 g L–1, the wine was racked to remove lees and added with 50 mg L–1 potassium metabisulfite and 80 g hL–1 of bentonite. The wines spent 12 d in cold stabilization and were then racked to remove the clarification lees. An additional 30 g hL–1 of bentonite was added, followed by 12 d more of clarification to achieve limpidity.
The base wine analyses were performed after the final racking. We also performed the analyses of total acidity (g L–1 tartaric acid), volatile acidity (g L–1 acetic acid), pH, alcohol (%), crude extract (g L–1), residual sugars (g L–1), and ashes (g L–1) (Amerine and Ough, 1980Amerine, M.A.; Ough, C.S. 1980. Methods for Analysis of Musts and Wines. John Wiley, New York, NY, USA.) in order to determine if the wine complied with the standards of the Brazilian law.
Statistical analysis
The analysis of variance (ANOVA) was used to test the two factors (in-row spacing and shoot thinning) and their interaction (in-row spacing × shoot thinning). The residual variance was not homogeneous between years; therefore, data was analyzed individually for each year (year was not considered as a factor). A linear regression was performed for the planting density treatment and the mean values for the shoot thinning treatment were compared by a Scott-Knott test, both at 5 % significance level. The statistical analyses were performed using the SISVAR software (analysis of variance for balanced data, version 5.6) given by the Departamento de Ciências Exatas, Universidade Federal de Lavras.
Results and Discussion
Vine vigor
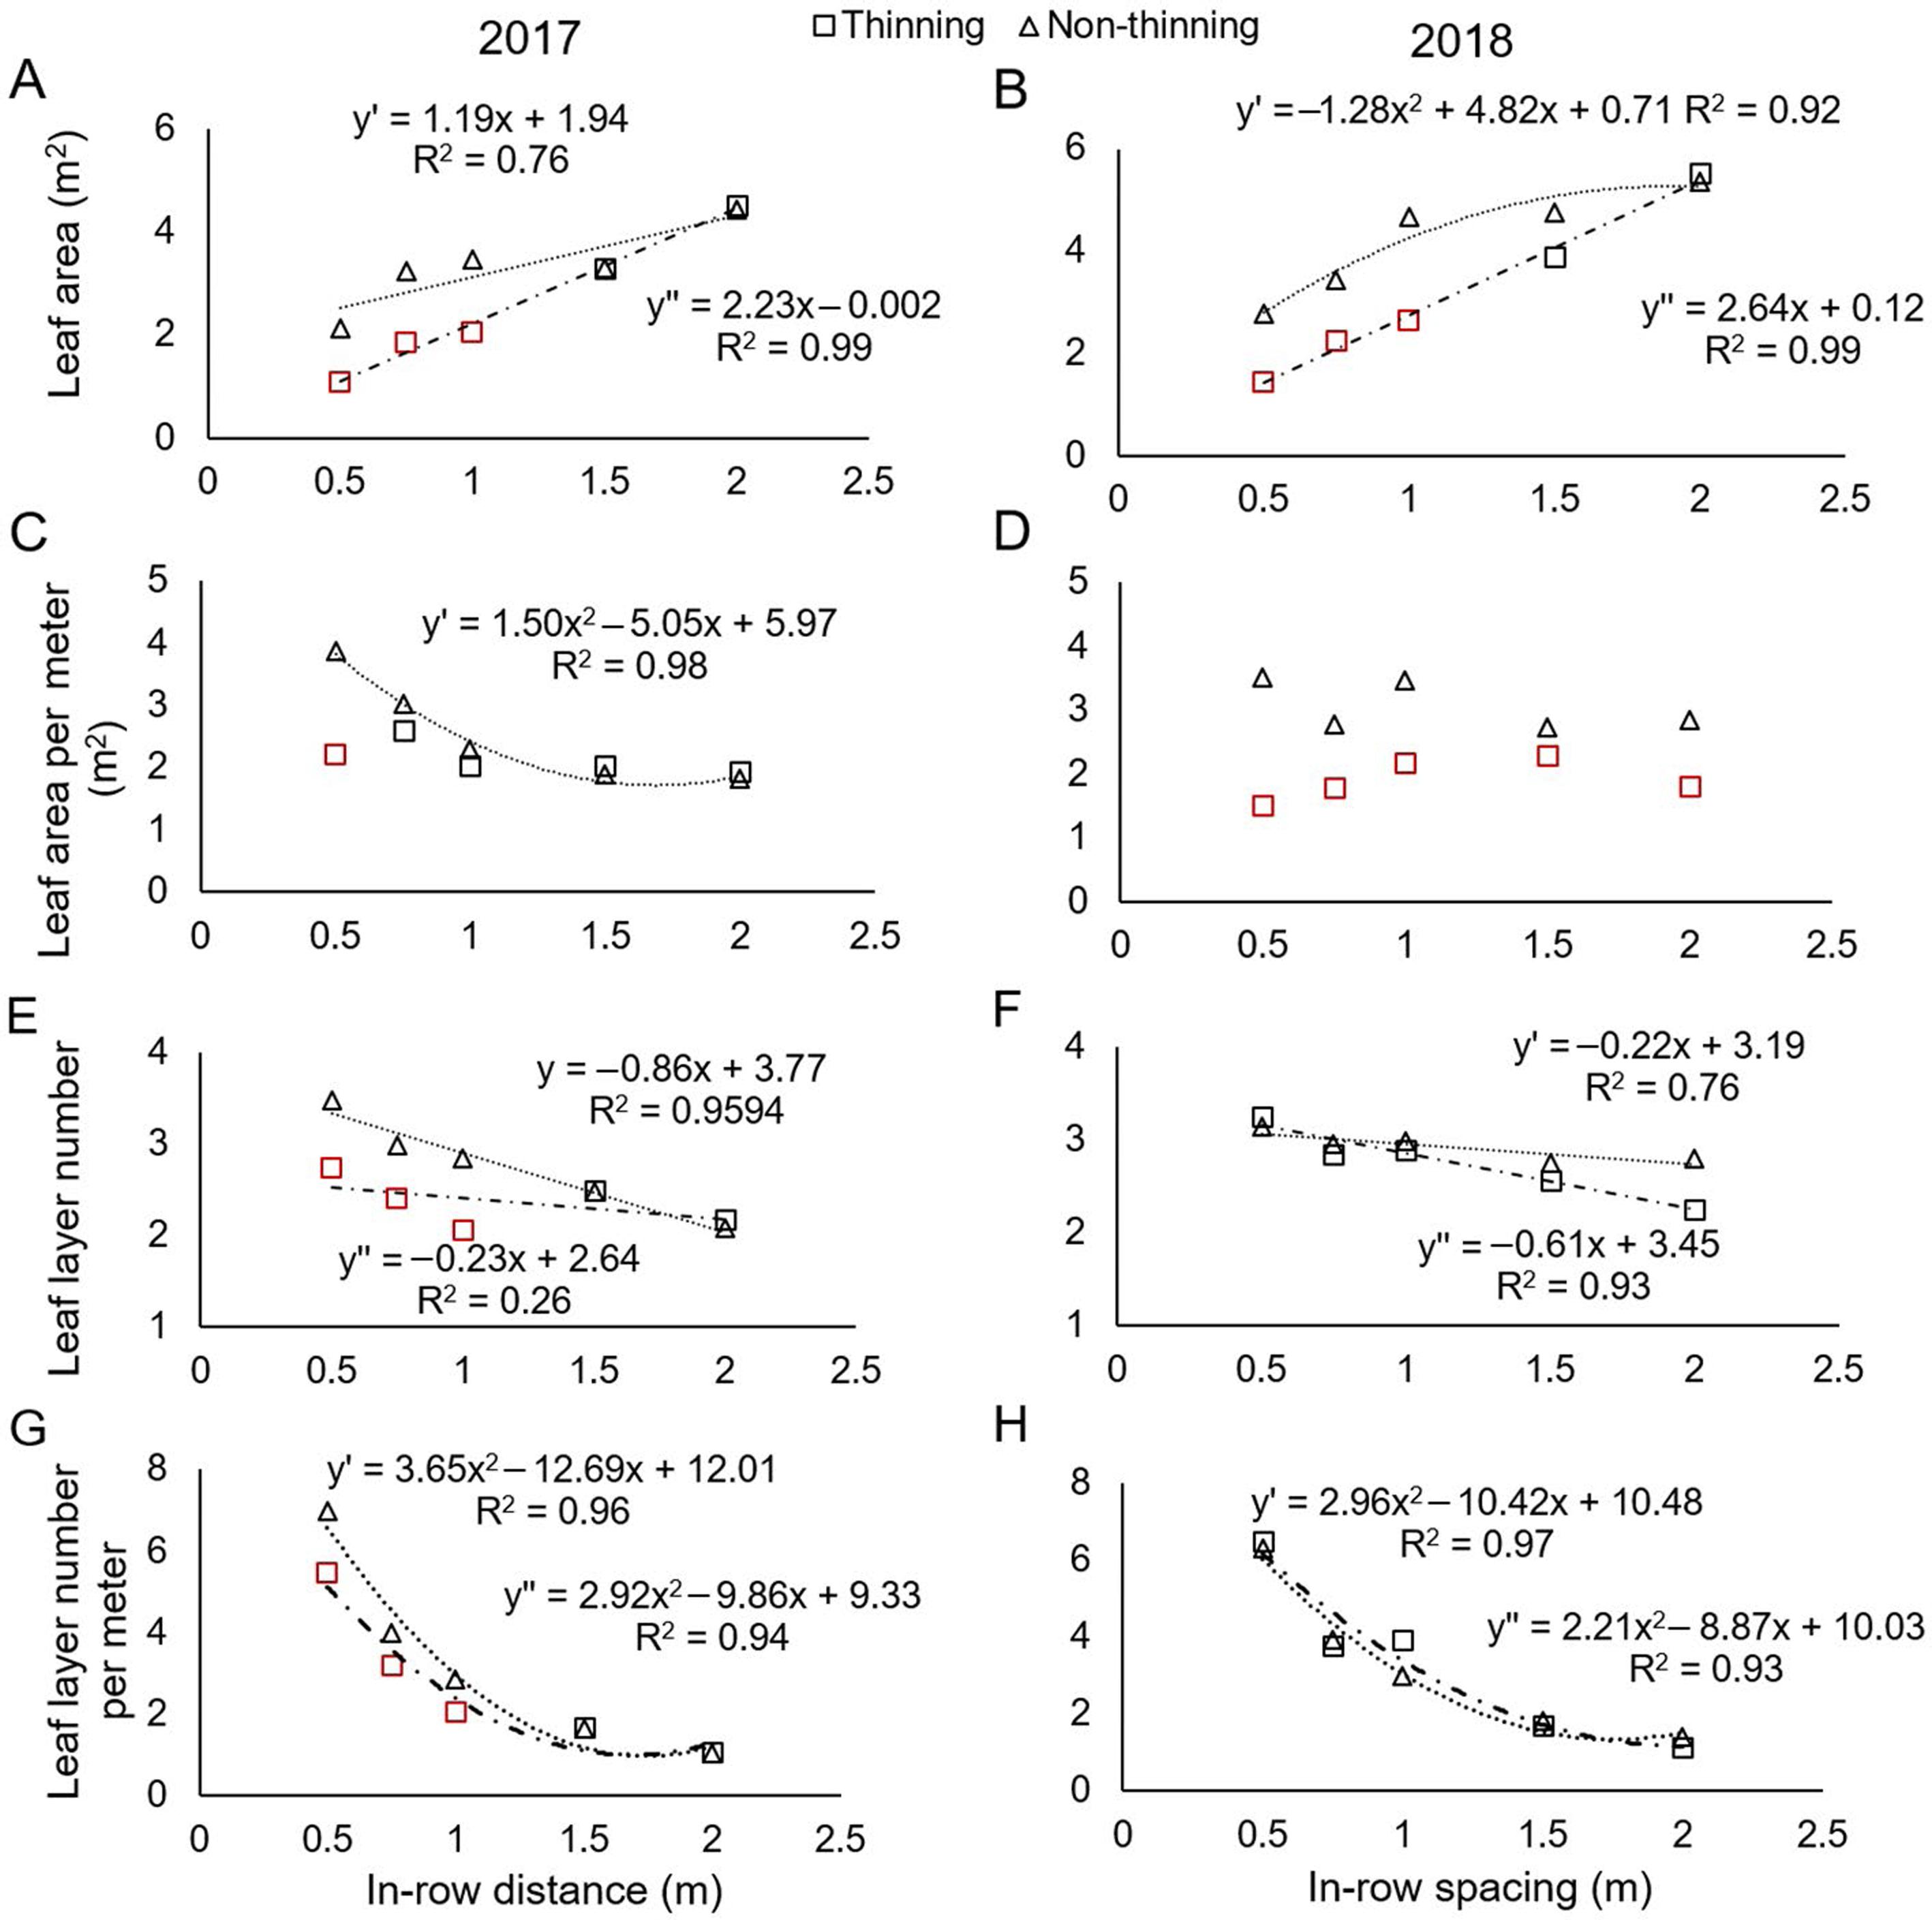
In thinning and non-thinning treatments, LA increased as in-row spacing increased from 0.5 m to 2.0 m (Figures 2A and 2B). The arm of vines increased when submitted to larger in-row spacing, which may explain this fact. With larger spacing, vines have more growing space and more shoots, hence, more leaves per plant. The opposite explains the lower leaf area per plant for 0.5 m in-row spacing. Kliewer et al. (2000)Kliewer, W.M.; Wolpert, J.A.; Benz, M. 2000. Trellis and vine spacing effects on growth, canopy microclimate, yield and fruit composition of Cabernet Sauvignon. Acta Horticulturae 523: 21-32. found a similar effect by reducing the in-row spacing of ‘Cabernet Sauvignon’ cultivar vines from 3 m and 2 m to 1 m, which resulted in fewer shoots per vine.
Linear regression of leaf area per plant (A and B), leaf area per meter of row (C and D) leaf layer number (E and F) and leaf layer number per meter (G and H) in two shoot thinning treatments regarding different planting densities of field-grown ‘Chardonnay’, in the 2017 and 2018 cycles, Caldas, MG, Brazil. (y’) for non-thinning and (y’’) for thinning treatments. Red color shows significant difference between thinning treatments by Scott-Knott test. Both treatments were tested at 5 % significance level.
Leaf area per row meter (LAm), LLN and LLN per meter, in general, decreased as the in-row spacing increased (Figures 2C, 2D, 2E, 2F, 2G, and 2H), since there was a decrease from 30 shoots per meter, at 0.5 m in-row spacing, to 18 shoots per meter for 2.00 m in-row spacing treatment. The higher values found for LAm, LLN and LLN per meter in minor in-row spacing induced foliage overlapping. A similar effect was observed by Bernizzoni et al. (2009)Bernizzoni, F.; Gatti, M.; Civardi, S.; Poni, S. 2009. Long-term performance of Barbera grown under different training systems and within-row vine spacings. American Journal of Enology and Viticulture 60: 339-348. when spacing between vines was increased from 0.9 m to 1.5 m, also corroborated by Smart (1988)Smart, R.E. 1988: Shoot spacing and canopy light microclimate. American Journal of Enology and Viticulture 39: 325-333.; Reynolds et al. (1994aReynolds, A.G.; Edwards, C.G.; Wardle, D.A.; Webster, D.R.; Dever, M. 1994a. Shoot density affects ‘Riesling’ grapevines. I. Vine performance. Journal of American Society for Horticultural Science 119: 874-880.; Reynolds et al., 2005Reynolds, A.G.; Molek, T.; De Savigny, C. 2005. Timing of shoot thinning in Vitis vinífera: Impacts on yield and fruit composition variables. American Journal of Enology and Viticulture 56: 343-356.) and Silvestroni et al. (2019)Silvestroni, O.; Lanari, V.; Lattanzi, T.; Palliotti, A.; Vanderweide, J.; Sabbatini, P. 2019. Canopy management strategies to control yield and grape composition of Moltepuciano grapevines. Australian Journal of Grape and Wine Research 25: 30-42.. The larger number of shoots per meter and foliage overlapping lead to a shaded canopy, primarily observed in vines with in-row spacing of 0.5 m (30 shoots per m).
Shoot thinning treatment had a significant effect on vine vigor only at in-row spacing of 0.5 m, 0.75 m and 1.0 m, mainly in the 2017 season (Figures 2A, 2C, 2E, and 2G). Observed differences between seasons can be attributed to the frequency of rainfall in both cycles (Figure 1). The higher amount of rainfall until Oct in the 2017 cycle may have induced a faster development in these vines, increasing the differences between treatments and between cycles.
Reducing the shoot number from 18 or 20 shoots per meter to 10 shoots per meter through thinning increased the shoot vigor for vines in larger in-row spacing, leading to similar values of LA and LLN per plant to the non-thinning treatments. These similar values can be a result of the increase of LA in main and lateral axis leaves. This enhanced shoot vigor induced by thinning and its compensatory effect were also observed in ‘Sangiovese’, ‘Barbera’, and ‘Moltepuciano’ grapevines (Myers et al., 2008Myers, J.K.; Wolpert, J.A.; Howell, G.S. 2008. Effect of shoot number on the leaf area and crop weight relationship of young Sangiovese grapevines. American Journal of Enology and Viticulture 59: 422 - 424.; Bernizzoni et al., 2011Bernizzoni, F.; Civardi, S.; Van Zeller, M.; Gatti, M.; Poni, S. 2011. Shoot thinning effects on seasonal whole-canopy photosynthesis and vine performance in Vitis vinifera L. cv. Barbera. Australian Journal of Grape and Wine Research 17: 351-357.; Silvestroni et al., 2019Silvestroni, O.; Lanari, V.; Lattanzi, T.; Palliotti, A.; Vanderweide, J.; Sabbatini, P. 2019. Canopy management strategies to control yield and grape composition of Moltepuciano grapevines. Australian Journal of Grape and Wine Research 25: 30-42.). Such increased shoot vigor was not observed from 0.5 m to 1.0 m of in-row spacing in 2017. Conversely, a decrease in LA, LLN and LLN per meter was observed in vines thinned in 2017 (Figures 2A, 2E, and 2G). This may be attributed to a higher root density, increasing competition for nutrients, and impairing translocation of carbon and nitrogen reserves from perennial organs to shoots. Higher vine densities have been correlated to increased root densities, in planting densities of 5,000 and 10,000 vines ha–1 of ‘Pinot noir’ vines grafted onto rootstock 99 Richter (Hunter, 1998Hunter, J.J. 1998. Plant spacing implications for grafted grapevine. 1. Soil characteristics, root growth, dry matter partitioning, dry matter composition and soil utilisation. South African Journal of Enology and Viticulture 19: 25-34.).
In 2017, the treatment with 0.5 m of in-row spacing presented 2.14 m2 less LAm that, along with the lower LLN, showed that the reduction from 30 to 10 shoots per meter was essential to reduce shading.
Overall, these results showed that shoot thinning decreased the shading effect in high-density vine plantings. These results are in agreement with Smart (1988)Smart, R.E. 1988: Shoot spacing and canopy light microclimate. American Journal of Enology and Viticulture 39: 325-333., Reynolds et al. (1994a)Reynolds, A.G.; Edwards, C.G.; Wardle, D.A.; Webster, D.R.; Dever, M. 1994a. Shoot density affects ‘Riesling’ grapevines. I. Vine performance. Journal of American Society for Horticultural Science 119: 874-880., Bernizzoni et al. (2011)Bernizzoni, F.; Civardi, S.; Van Zeller, M.; Gatti, M.; Poni, S. 2011. Shoot thinning effects on seasonal whole-canopy photosynthesis and vine performance in Vitis vinifera L. cv. Barbera. Australian Journal of Grape and Wine Research 17: 351-357. and Silvestroni et al. (2019)Silvestroni, O.; Lanari, V.; Lattanzi, T.; Palliotti, A.; Vanderweide, J.; Sabbatini, P. 2019. Canopy management strategies to control yield and grape composition of Moltepuciano grapevines. Australian Journal of Grape and Wine Research 25: 30-42., who argued that by increasing number of shoots, higher density canopies were observed, and still, after decreasing the number of shoots, more gaps in the canopy were detected.
Most research has shown that the ideal shoot density ranges from 15 to 25 shoots per meter (Smart, 1988Smart, R.E. 1988: Shoot spacing and canopy light microclimate. American Journal of Enology and Viticulture 39: 325-333.; Reynolds et al., 1994aReynolds, A.G.; Edwards, C.G.; Wardle, D.A.; Webster, D.R.; Dever, M. 1994a. Shoot density affects ‘Riesling’ grapevines. I. Vine performance. Journal of American Society for Horticultural Science 119: 874-880., bReynolds, A.G.; Edwards, C.G.; Wardle, D.A.; Webster, D.R.; Dever, M. 1994b. Shoot density affects ‘Riesling’ grapevines. II. Wine composition and sensory response. Journal of American Society for Horticultural Science 119: 881-892.; Reynolds et al., 2005Reynolds, A.G.; Molek, T.; De Savigny, C. 2005. Timing of shoot thinning in Vitis vinífera: Impacts on yield and fruit composition variables. American Journal of Enology and Viticulture 56: 343-356.). This indicates that wider in-row spacing treatments, such as 2.0 m, which presented lower LLN and LLN per meter values when thinned, had an incomplete sunlight interception, since the number of shoots per meter achieved was lower than the optimal range reported. However, for the treatment with 0.5 m in-row spacing, which presented higher LLN and LLN per meter, the shoot thinning treatment was essential to reduce shading.
Yield components
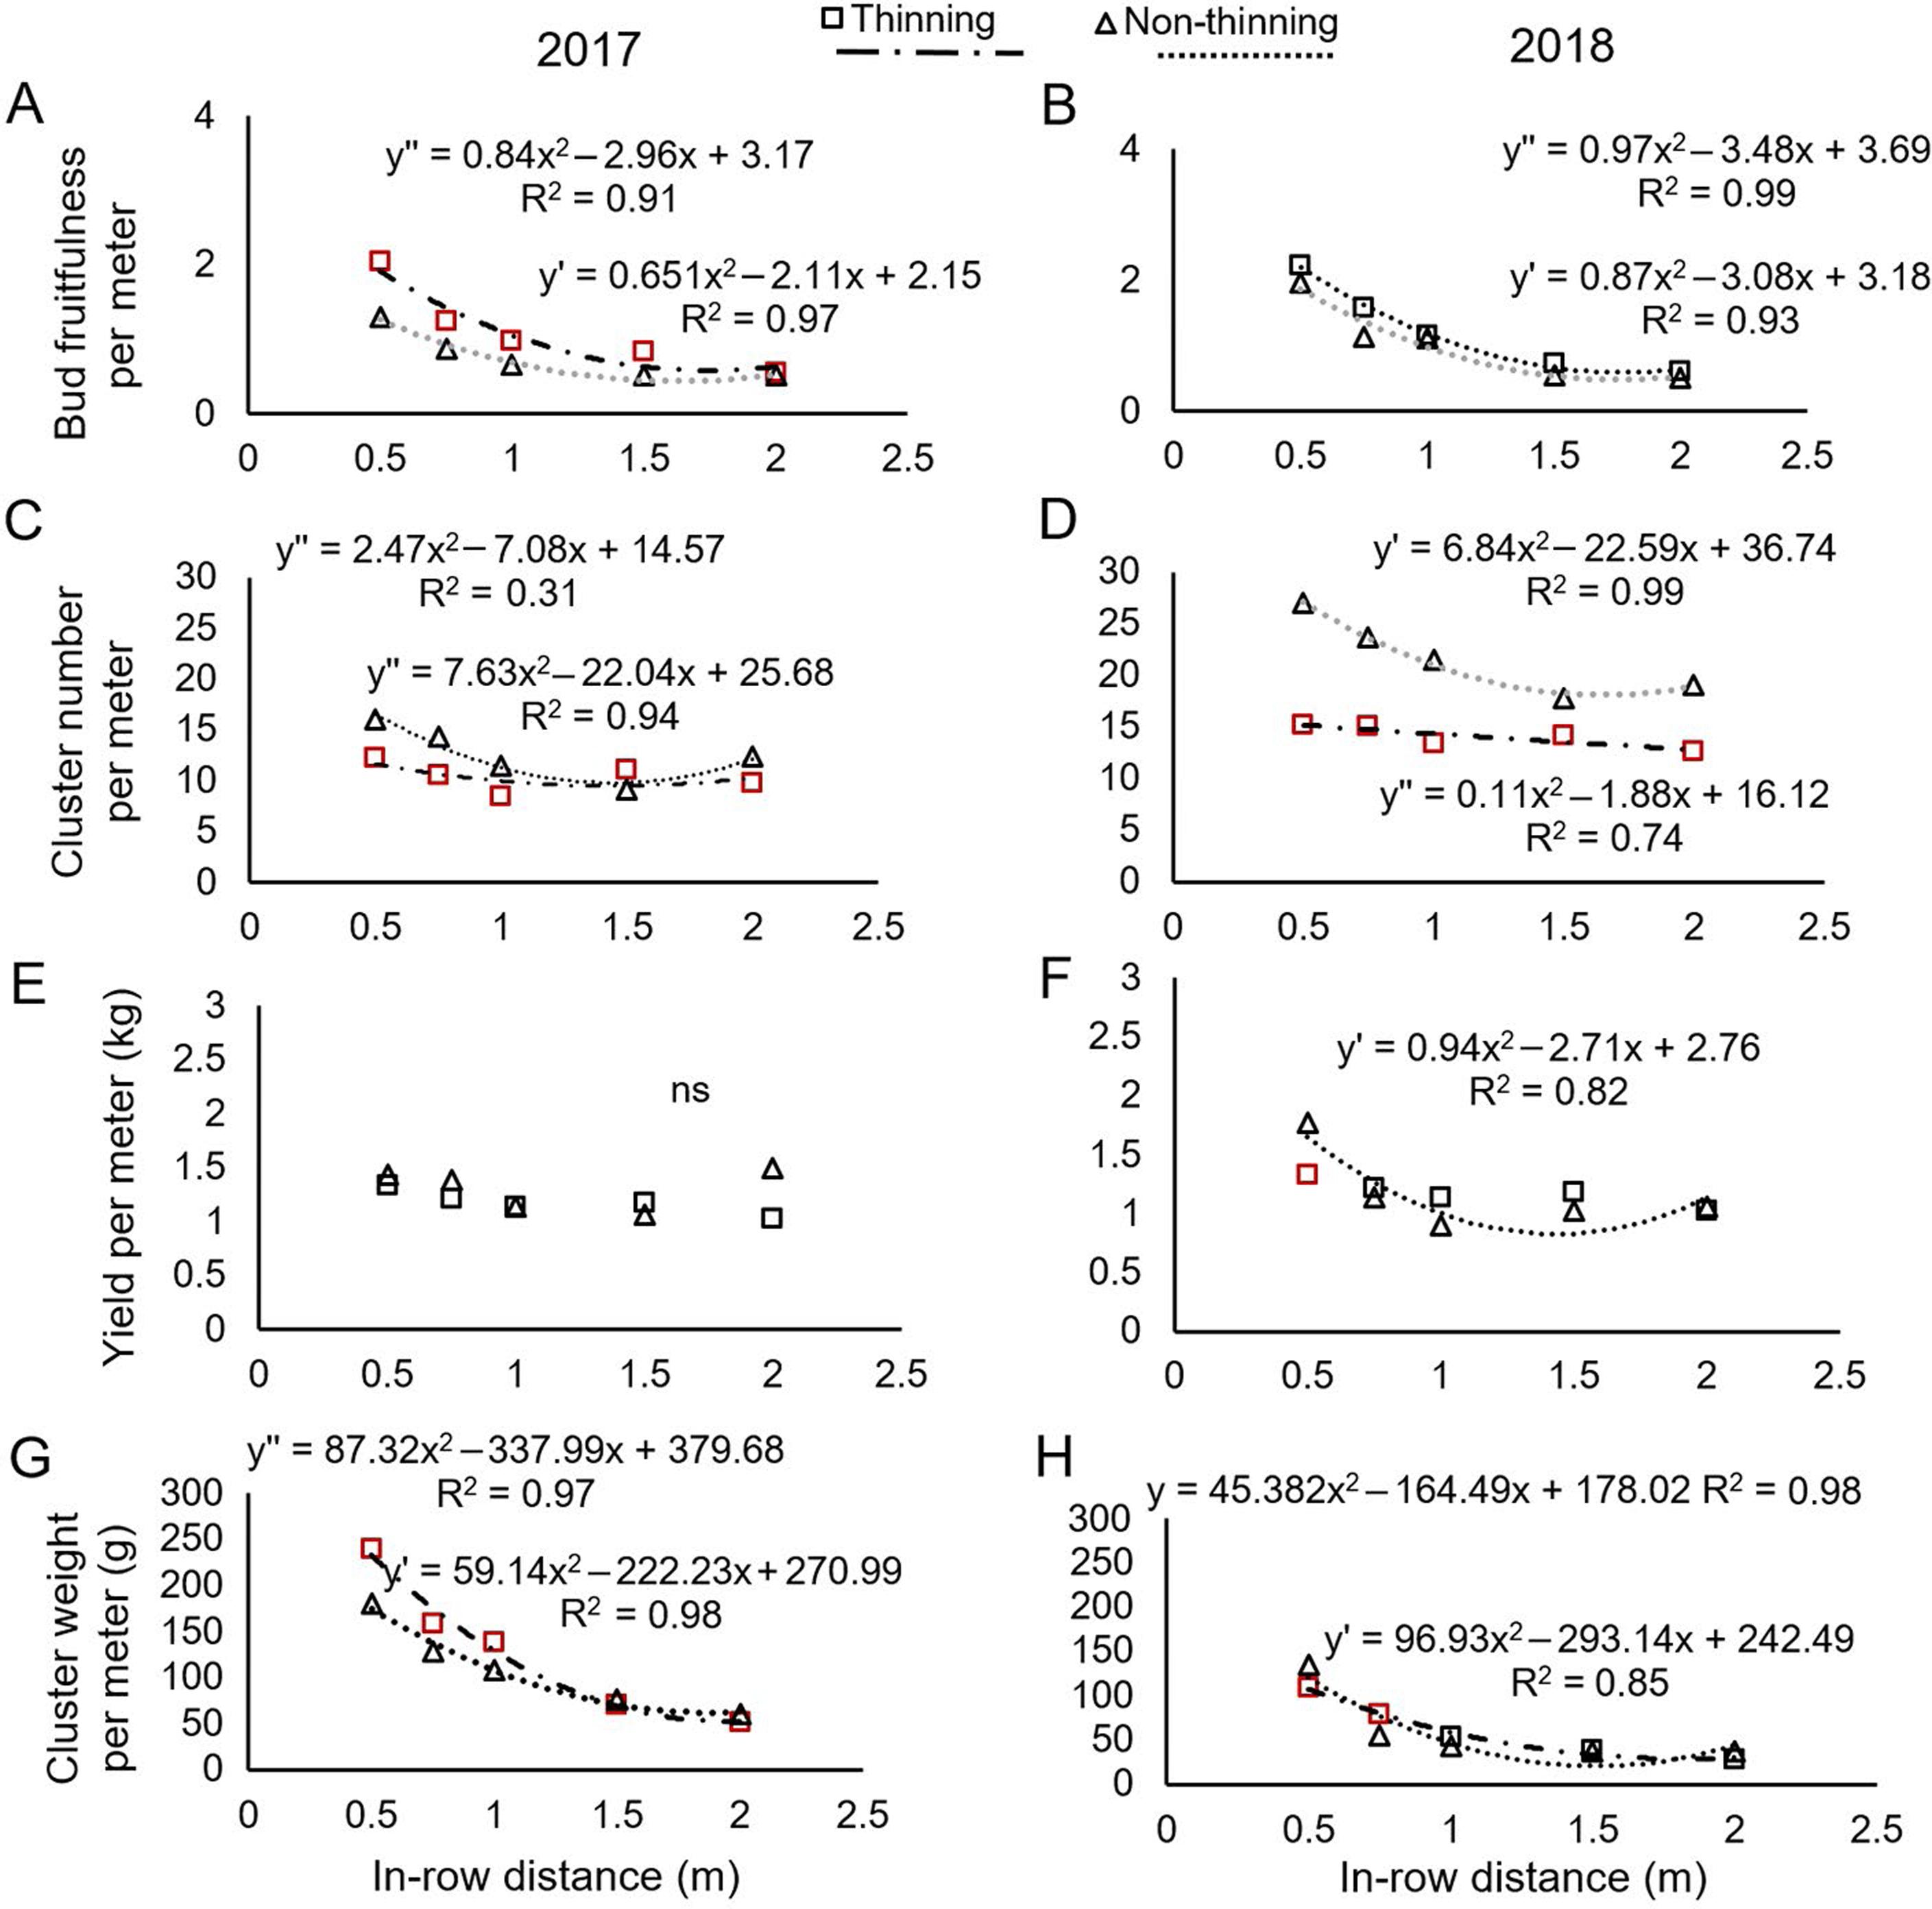
There was no interaction between planting density and thinning treatments on bud fruitfulness for both growing seasons. However, in 2017, in-row spacing affected bud fruitfulness, increasing fertility as in-row spacing increased (Figure 3A). Whereas in 2018, no effect was observed regarding in-row spacing (Figure 3B). In both years, the cluster number, in general, increased as the in-row spacing increased (Figures 3C and 3D).
Linear regression for bud fruitfulness (A and B), cluster number (C and D), yield per plant (E and F), and cluster weight (G and H), in two shoot thinning treatments regarding different in-row spacing of field-grown ‘Chardonnay’, in the 2017 and 2018 cycles, Caldas, MG, Brazil. (y’) for non-thinning and (y’’) for thinning treatments. Red color shows significant difference among thinning treatments by Scott-Knott test. Both treatments were tested at 5 % significance level.
Bud fruitfulness is related to the cluster number and is directly influenced by environmental and agronomic conditions of the previous cycle, such as light, temperature, water, nutritional status, and vine vigor (Vasconcelos et al., 2009Vasconcelos, M.C.; Greven, M.; Winefield, C.S.; Trought, M.C.T.; Raw, V. 2009. The flowering process of Vitis vinifera: a review. American Journal of Enology and Viticulture 60: 411-434.). Treat ments with narrow in-row spacing presented shaded canopies due to foliage overlapping, while treatments with large in-row spacing presented higher light input due to gaps in the canopy. The shading and gaps in the canopy affected the latent bud light exposure and consequently inflorescence induction and differentiation, reducing bud fruitfulness in narrower in-row spacing and increasing it in larger in-row spacing densities (Figure 3A), as corroborated by Sánchez and Dokoozlian (2005)Sánchez, L.A.; Dokoozlian, N.K. 2005. Bud microclimate and fruitfulness in Vitis vinifera L. American Journal of Enology and Viticulture 56: 319-329. and Li-Mallet et al. (2016)Li-Mallet, A.; Rabot, A.; Geny, L. 2016. Factors controlling inflorescence primordia formation of grapevine: their role in latent bud fruitfulness? A review. Botany 94: 147-163.. Regarding the 2018 crop, the effect of shading in bud fruitfulness was not observed, which can be attributed to reduced rainfall and consequently lower leaf area, as mentioned above. This observation agrees with the finding of Bernizzoni et al. (2009)Bernizzoni, F.; Gatti, M.; Civardi, S.; Poni, S. 2009. Long-term performance of Barbera grown under different training systems and within-row vine spacings. American Journal of Enology and Viticulture 60: 339-348., who did not observe an effect on bud fruitfulness when reducing in-row distance in ‘Barbera’ grape.
The shoot thinning treatment reduced LLN in 2017 and LAm in 2018 (Figures 2D and 2E), favoring light incidence, which was also observed by Smart (1988)Smart, R.E. 1988: Shoot spacing and canopy light microclimate. American Journal of Enology and Viticulture 39: 325-333.. Shoot thinning also favored bud fruitfulness, increasing 0.30 and 0.20, on average, for the 2017 and 2018 cycles, respectively (Figures 3A and 3B). However, the influence of a narrow in-row distance between vines was not compensated by shoot thinning, as observed in the lower values of the cluster number and yield in both years (Figures 3C, 3D, 3E, and 3F). This was most likely due to the removal of shoots with inflorescences, when the shoot thinning treatment was applied.
Regarding other yield components, in 2017, the cluster weight was only affected by shoot thinning treatment (Figure 3G), while the berry weight showed no differences between treatments, with a general average of 1.86 g per berry for all treatments (data not shown). For in-row spacing between 0.5 m and 0.75 m, the thinning treatment decreased the cluster weight, which is related with lower leaf area observed in these treatments. According to Vasconcelos et al. (2009)Vasconcelos, M.C.; Greven, M.; Winefield, C.S.; Trought, M.C.T.; Raw, V. 2009. The flowering process of Vitis vinifera: a review. American Journal of Enology and Viticulture 60: 411-434., low leaf area and shading during flowering can impair berry setting due to low availability of photoassimilates to distribute among the sink organs, which decreases the berry number, leading to low cluster weight even with no differences in berry weight. The variation in the cluster weight for thinned vines in 1.5 m and 2.0 m in-row spacing also explains the increase and decrease, respectively, in yield results. In 2018, the cluster weight was affected by in-row spacing and shoot thinning mainly in narrower spacing from 0.5 to 1.0 m (Figure 3H). The berry weight showed small differences between treatments, presenting a general average of 1.81 g per berry for all treatments (data not shown).
Despite differences observed for the cluster weight, in both cycles, the cluster number had greater effect on yield compared to other components, also observed by Clingeleffer et al. (2001)Clingeleffer, P.R.; Martin, S.; Krstic, M.; Dunn, G.M. 2001. Crop Development, Crop Estimation and Crop Control to Secure Quality and Production of Major Wine Grape Varieties: A National Approach; Final Report to Grape and Wine Research and Development Corporation. GWRCD, Wayville, Australia. and Dias et al. (2017)Dias, F.A.N.; Mota, R.V.; Souza C.R.; Pimentel, R.M.A.; Souza, L.C.; Souza, A.L.; Regina, M.A. 2017. Rootstock on vine performance and wine quality of Syrah under doble-pruning management. Scientia Agricola 74: 134-141.. However, even with higher cluster counts in 2018, yields were not higher compared to the 2017 cycle due to lower cluster and berry weights.
Results on a meter basis clearly show the influence of the number of shoots per meter. The increase of in-row spacing led to fewer shoots therefore decreasing, in general, all yield parameters (Figures 4A, 4B, 4C, and 4D). An exception is the yield per meter (Figures 4E and 4F) that showed small or no differences between treatments in both cycles, which can be explained by the small differences also found in the cluster number per meter.
Linear regression for bud fruitfulness per meter (A and B), cluster number per meter (C and D), yield per meter (E and F), and cluster weight per meter (G and H), in two shoot thinning treatments in function of different in-row spacing of field-grown ‘Chardonnay’, in the 2017 and 2018 cycles, Caldas, MG, Brazil. (y’) for non-thinning and (y’’) for thinning treatments. Red color shows significant difference among thinning treatments by Scott-Knott test. Both treatments were tested at 5 % significance level.
Grape and base wine composition
Malic acid contents decreased mainly due to light exposure and higher temperatures via cellular respiration (Jackson, 2008Jackson, R.S. 2008. Wine Science: Principles and Applications. Academic Press, London, UK.; Sweetman et al., 2014Sweetman, C.; Sandras, V.O.; Hancock, R.D.; Soole, K.L.; Ford, C.M. 2014. Metabolic effects of elevated temperature on organic acid degradation in ripening Vitis vinifera fruit. Journal of Experimental Botany 65: 5975-5988.). In general, malic and tartaric acid content decreased as in-row spacing increased, for both cycles (Figure 5), following the reduction in LLN (Figure 2). In the 2017 and 2018 cycles, the highest content of malic acid was found in narrower in-row spacing treatments, possibly due to the shaded canopy. Meanwhile, the lowest malic acid content was shown in wider in-row spacing treatments (due to the opposite effect). In 2017, the shoot thinning treatment attenuated the differences in the malic acid content and reduced it in the treatment with in-row spacing of 0.75 m (Figure 5G), probably by allowing greater light incidence in the canopy. However, in the 2018 cycle, the shoot thinning treatment had no effect on malic or tartaric acid results. Results on a meter basis also reflected the shading effect (Figures 5E, 5F, 5G, and 5H).
Linear regression for tartaric (A and B) and, malic (C and D) acids contents in berries, tartaric (E and F) and malic (G and H) acids contents in berries per meter in two shoot thinning treatments in function of different in-row spacing of field-grown ‘Chardonnay’ in the 2017 and 2018 cycles, Caldas, MG, Brazil. (y’) for non-thinning and (y’’) for thinning treatments. Red color shows significant difference among thinning treatments by Scott-Knott test. Both treatments were tested at 5 % significance level. ‘ns’ for no significance found for any treatment.
The highest content of tartaric acid in all thinned vines in the 2017 cycle relates to results found by Poni et al. (2006)Poni, S.; Casalini, L.; Bernizzoni, F.; Civardi, S.; Intrieri, C. 2006. Effects of early defoliation on shoot photosynthesis, yield components, and grape composition. American Journal of Enology and Viticulture 57: 397-407. and Tardaguila et al. (2010)Tardaguila, J.; Toda, F.M.; Poni, S.; Diago, M.P. 2010. Impact of early leaf removal on yield and fruit and wine composition of Vitis vinifera L. Graciano and Carignan. American Journal of Enology and Viticulture 61: 37-381., in which the increased content of tartaric acid was found in defoliated treatments. Kliewer and Schultz (1964)Kliewer, W.M.; Schultz, H.B. 1964. Influence of environment on metabolism of organic acids and carbohydrates in Vitis vinifera. II. Light. American Journal of Enology and Viticulture 15: 119-129. observed that in berries exposed to the sun, higher amounts of 14CO2 were incorporated into the tartaric acid than in shaded berries. However, differences in genotype and variations in canopy porosity exist, affecting light exposure (Tardaguila et al., 2010Tardaguila, J.; Toda, F.M.; Poni, S.; Diago, M.P. 2010. Impact of early leaf removal on yield and fruit and wine composition of Vitis vinifera L. Graciano and Carignan. American Journal of Enology and Viticulture 61: 37-381.; Bulola et al., 2012Bulola, M.; Persuric, D.; Ganic, K.K.; Karoglan, M.; Kozina, B. 2012. Effects of fruit zone leaf removal on the concentrations of phenolic and organic acids in Istrian Malvasia grape juice and wine. Food Technology and Biotechnology 50: 159-166.).
Grape and wine acidity presented a positive linear correlation with LLN (Figure 6), indicating that shading increased acidity linearly. Similar results were found, relating denser canopies to higher total acidity for ‘Riesling’ and ‘Chardonnay Musqué’ cultivars (Reynolds et al., 1994bReynolds, A.G.; Edwards, C.G.; Wardle, D.A.; Webster, D.R.; Dever, M. 1994b. Shoot density affects ‘Riesling’ grapevines. II. Wine composition and sensory response. Journal of American Society for Horticultural Science 119: 881-892.; Reynolds et al., 2007Reynolds, A.G.; Schlosser, J.; Power, R.; Roberts, R.; Willwerth, J.; Savigny, C. 2007. Magnitude and interaction of viticultural and enological effects. I. Impact of canopy management and yeast strain on sensory and chemical composition of Chardonnay Musqué. American Journal of Enology and Viticulture 58: 12-24.). This indicates that some degree of shading is positive for sparkling wine production, as suggested by Jones et al. (2014)Jones, J.E.; Kerslake, F.L.; Close, D.C.; Dambergs, R.G. 2014. Viticulture for sparkling wine production: a review. American Journal of Enology and Viticulture 65: 407-416..
Regression equation between leaf layer number and ‘Chardonnay’ grape and wine acidity in 2017 and 2018 cycles. Correlation was calculated using mean values of all 10 treatments. Linear regression was tested at 5 % significance level.
The average of grape pH and soluble solids in both years had no significant differences between treatments. In 2017 and 2018, non-thinned treatments presented an average of 3.19 pH and 3.10 pH, and 16.45 and 17.30 °Brix, respectively, while thinned treatments presented an average of 3.19 pH and 3.18 pH, and 16.40 and 17.23 °Brix, respectively, for the 2017 and 2018 cycles. Despite small differences, all treatments were within the ranges for sparkling wines production (Jones et al., 2014Jones, J.E.; Kerslake, F.L.; Close, D.C.; Dambergs, R.G. 2014. Viticulture for sparkling wine production: a review. American Journal of Enology and Viticulture 65: 407-416.).
The base wine in all treatments presented an average of 0.14 g L–1 and 0.49 g L–1 of acetic acid for volatile acidity, 0.99 for density at 20 °C, 20.66 g L–1 and 23.94 g L–1 for crude extract, 12 % and 10 % (v/v) for alcohol content, pH 3.18 and 3.32, 2.22 g L–1 and 0.95 g L–1 for residual sugars, and 1.43 g L–1 and 2.31 g L–1 for ashes, respectively, for the 2017 and 2018 cycles. All parameters show that base wines are suitable for sparkling wine production. Moreover, all averages were similar to ‘Chardonnay’ base wines produced in Serra Gaúcha and Encruzilhada do Sul (Poerner et al., 2010Poerner, N.; Rodrigues, E.; Celso, P.G.; Manfroi, V.; Hertz, P.F. 2010. Analytical differentiation of the base wines for sparkling from two viticultural regions of Rio Grande do Sul. Ciência Rural 40: 1186-1192 (in Portuguese, with abstract in English).) and to sparkling wines from Santa Catarina (Caliari et al., 2014Caliari, V.; Burin, V.M.; Rosier, J.P.; Bordignonluiz, M.T. 2014. Aromatic profile of Brazilian sparkling wines produced with classical and innovative grape varieties. Food Research International 62: 965-973.).
The grape and wine composition results are also in agreement with Bernizzoni et al. (2009)Bernizzoni, F.; Gatti, M.; Civardi, S.; Poni, S. 2009. Long-term performance of Barbera grown under different training systems and within-row vine spacings. American Journal of Enology and Viticulture 60: 339-348., Heuvel et al. (2013)Heuvel, J.E.V.; Lerch, S.D.; Lenerz, C.C.; Meyers, J.M.; Mansfield, A.K. 2013. Training system and vine spacing impact vine growth, yield, and fruit composition in a vigorous young ‘Noiret’ vineyard. Hortechnology 23: 505-510., and Reynolds et al. (2004)Reynolds, A.G.; Wardle, D.A.; Cliff, M.A.; King, M. 2004. Impact of training system and vine spacing on vine performance, berry composition and wine sensory attributes of Riesling. American Journal of Enology and Viticulture 55: 96-103., who concluded that in-row spacing has minimal or no effect on grape and must composition.
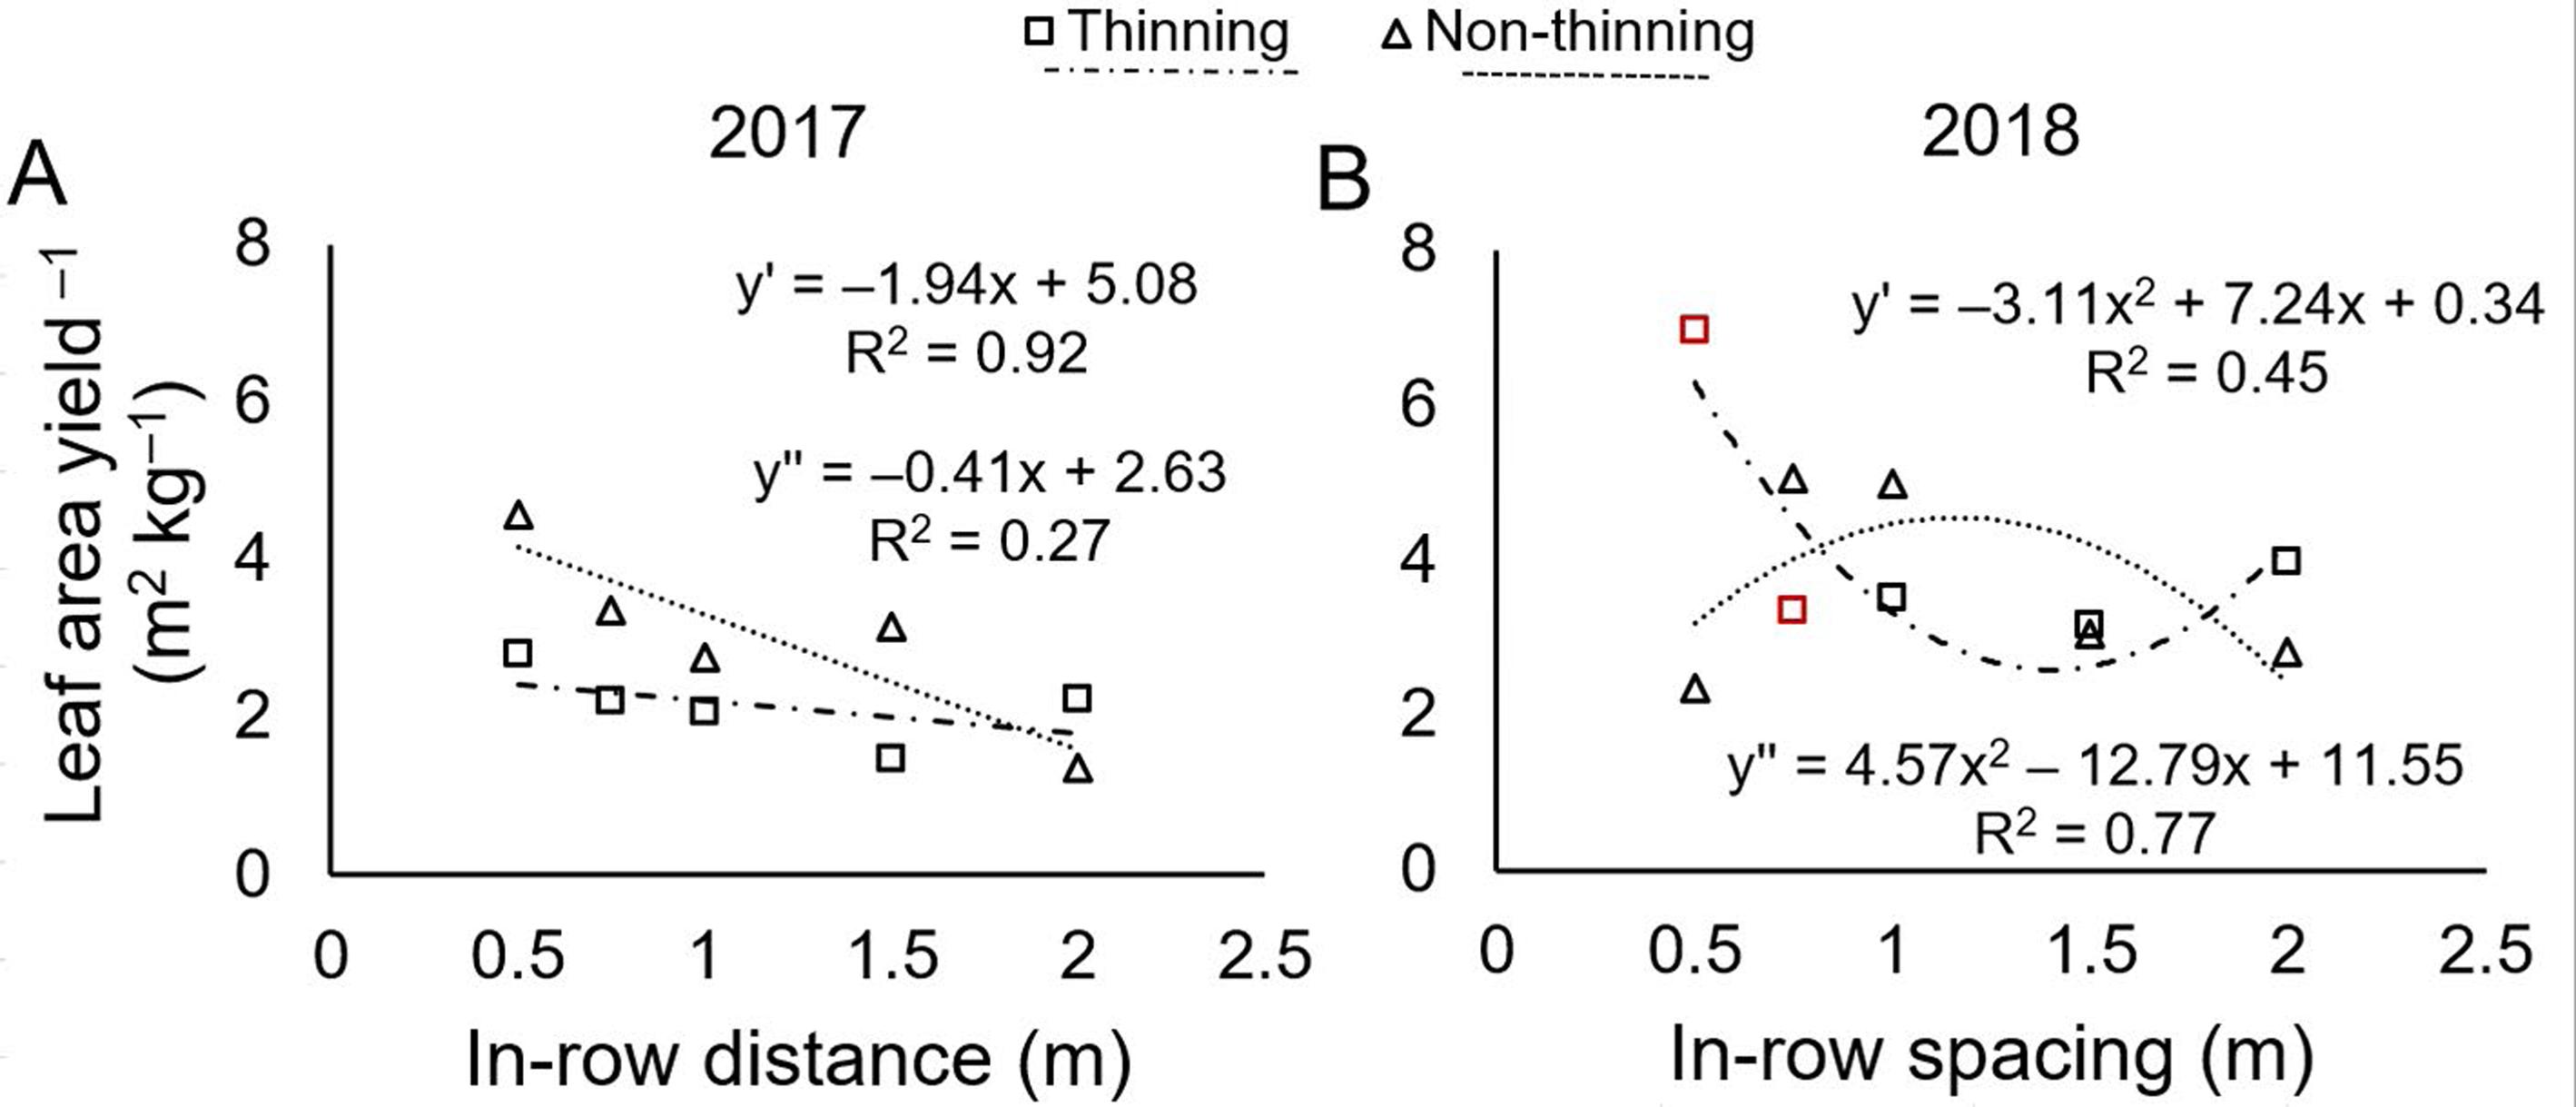
In the 2017 cycle, the leaf area to yield (m2 kg–1) ratio (Figure 7A) was only affected by in-row spacing, decreasing as in-row spacing increased. Moreover, in the 2018 cycle, the ratio was affected by the interaction of both treatments. The shoot thinning treatment in the 2018 cycle increased the ratio for vines in the largest and narrowest in-row spacing (2.0 m and 0.5 m) and reduced it for vines with medium in-row spacing (0.75 m to 1.0 m) in comparison to the non-thinning treatment (Figure 7B).
Linear regression for leaf area yield – 1 ratio (A and B) in two shoot thinning treatments in function of different in-row spacing of field-grown ‘Chardonnay’, in the 2017 and 2018 cycles, Caldas, MG, Brazil. (y’) for non-thinning and (y’’) for thinning treatments. Red color shows significant difference among thinning treatments by Scott-Knott test. Both treatments were tested at 5 % significance level.
For both cycles, the leaf area to yield ratio was above the ideal range of 0.8 to 1.2 m2 kg–1 of fruit, as suggested by Kliewer and Dokoozlian (2005)Kliewer, W.M.; Dokoozlian, N.K. 2005. Leaf area/crop weight ratios of grapevines: influence on fruit composition and wine quality. American Journal of Enology and Viticulture 56: 170-181.. Higher values indicate excessive shading (Jackson, 2008Jackson, R.S. 2008. Wine Science: Principles and Applications. Academic Press, London, UK.), which was already observed for non-thinning 0.5 m in-row treatment. In 2018, the higher ratio value for thinned 0.5 m in-row treatment was more accurately attributed to excessively low yield rather than excessive leaf area development.
The differences in LA yield–1 ratio contrast with the uniformity in qualitative results as soluble solids. There are two possible explanations. First, Vines from narrow in-row spacing treatments presented compensation in photosynthesis rate per unit LA thus having more assimilates partitioned for clusters and reaching the same SS levels of wider in-row spacing vines (Petrie et al., 2003Petrie, P.R.; Trought, M.C.T.; Howell, G.S.; Buchan, G.D. 2003. The effect of leaf removal and canopy height on whole-vine gas exchange and fruit development of Vitis vinifera L. Sauvignon Blanc. Functional Plant Biology 30: 711-717.). Second, vines from wider spacing treatments presented low average daily maximum photosynthesis and low carbon partitioning to fruit per shoot, as observed by Keller et al. (2014)Keller, M.; Deyermond, L.S.; Bondada, B.R. 2014. Plant hydraulic conductance adapts to shoot number but limits shoot vigour in grapevines. Functional Plant Biology 42: 366–375., in higher shoot number per vine, which impair the increase in SS values, leading to similar values of the narrower in-row treatments.
This ratio has been described with controversial results by many authors (Keller et al., 2005Keller, M.; Mills, L.J.; Wample, R.L.; Spayd, S.E. 2005. Cluster thinning effects on three deficit-irrigated Vitis vinifera cultivars. American Journal of Enology and Viticulture 56: 91-103.; Dias et al., 2017Dias, F.A.N.; Mota, R.V.; Souza C.R.; Pimentel, R.M.A.; Souza, L.C.; Souza, A.L.; Regina, M.A. 2017. Rootstock on vine performance and wine quality of Syrah under doble-pruning management. Scientia Agricola 74: 134-141.), showing that it varies considerably with cultivars (Jackson, 2008Jackson, R.S. 2008. Wine Science: Principles and Applications. Academic Press, London, UK.), soil conditions, and mainly, climate. Moreover, this similarity in qualitative results, despite contrasting LA yield–1 ratios, suggest that the ideal range for fruit composition and wine quality, suggested by Kliewer and Dokoozlian (2005)Kliewer, W.M.; Dokoozlian, N.K. 2005. Leaf area/crop weight ratios of grapevines: influence on fruit composition and wine quality. American Journal of Enology and Viticulture 56: 170-181., may not apply for ‘Chardonnay’ grown in the highlands of the Brazilian Southeast for sparkling wine production.
In vineyards under different climatic conditions, such as more intensive summers with less rainfall, higher temperatures, and more sun exposure, as described in Cordislândia by Regina et al. (2010)Regina, M.A.; Carmo, E.L.; Fonseca, A.R.; Purgatto, E.; Shiga, T.M.; Lajolo, F.M.; Ribeiro, A.P.; Mota, R.V. 2010. Altitude influence on the quality of ‘Chardonnay’ and ‘Pinot noir’ grapes in the state of Minas Gerais. Revista Brasileira de Fruticultura 32: 143-150 (in Portuguese, with abstract in English)., the small differences between in-row spacing treatments observed in this work may be enhanced under these conditions, therefore, planting densities that conserve acidity in grapes must be considered.
It is also important to emphasize the need for further research on canopy, disease, and soil management as well as costs of establishment, because it is a new wine growing region and these parameters are essential to achieve high qualitative and sustainable production.
Conclusion
Denser vine canopies presented shaded clusters, lower bud fruitfulness, lower cluster number and decreased yields. Shoot thinning increased bud fruitfulness due to a reduction in the shading effect, regardless of in-row spacing. In-row spacing and shoot thinning had little effect on grape and base wine composition, with the exception of the acidity levels. Narrower in-row spacing distances preserved acidity levels in berries, mainly due to malic acid contents and LLN, ensuring freshness in base wines for sparkling wines production.
In-row spacing from 0.5 to 1.5 m, without shoot thinning, presented the best performance for the production of sparkling wine base wine considering the conditions of Brazilian southeastern highlands.
Acknowledgments
This project was supported by FAPEMIG (Fundação de Amparo à Pesquisa do Estado de Minas Gerais) and by CNPq (Conselho Nacional de Desenvolvimento Científico e Tecnológico) which granted scholarships to the Master’s program of Agronomy at UFLA (Universidade Federal de Lavras).
References
- Amerine, M.A.; Ough, C.S. 1980. Methods for Analysis of Musts and Wines. John Wiley, New York, NY, USA.
- Bernizzoni, F.; Civardi, S.; Van Zeller, M.; Gatti, M.; Poni, S. 2011. Shoot thinning effects on seasonal whole-canopy photosynthesis and vine performance in Vitis vinifera L. cv. Barbera. Australian Journal of Grape and Wine Research 17: 351-357.
- Bernizzoni, F.; Gatti, M.; Civardi, S.; Poni, S. 2009. Long-term performance of Barbera grown under different training systems and within-row vine spacings. American Journal of Enology and Viticulture 60: 339-348.
- Bulola, M.; Persuric, D.; Ganic, K.K.; Karoglan, M.; Kozina, B. 2012. Effects of fruit zone leaf removal on the concentrations of phenolic and organic acids in Istrian Malvasia grape juice and wine. Food Technology and Biotechnology 50: 159-166.
- Caliari, V.; Burin, V.M.; Rosier, J.P.; Bordignonluiz, M.T. 2014. Aromatic profile of Brazilian sparkling wines produced with classical and innovative grape varieties. Food Research International 62: 965-973.
- Clingeleffer, P.R.; Martin, S.; Krstic, M.; Dunn, G.M. 2001. Crop Development, Crop Estimation and Crop Control to Secure Quality and Production of Major Wine Grape Varieties: A National Approach; Final Report to Grape and Wine Research and Development Corporation. GWRCD, Wayville, Australia.
- Dias, F.A.N.; Mota, R.V.; Souza C.R.; Pimentel, R.M.A.; Souza, L.C.; Souza, A.L.; Regina, M.A. 2017. Rootstock on vine performance and wine quality of Syrah under doble-pruning management. Scientia Agricola 74: 134-141.
- Goldammer, T. 2018. Grape Growers Handbook: A Guide to Viticulture for Wine Production. Apex, Centreville, VA, USA.
- Heuvel, J.E.V.; Lerch, S.D.; Lenerz, C.C.; Meyers, J.M.; Mansfield, A.K. 2013. Training system and vine spacing impact vine growth, yield, and fruit composition in a vigorous young ‘Noiret’ vineyard. Hortechnology 23: 505-510.
- Hunter, J.J. 1998. Plant spacing implications for grafted grapevine. 1. Soil characteristics, root growth, dry matter partitioning, dry matter composition and soil utilisation. South African Journal of Enology and Viticulture 19: 25-34.
- Jackson, R.S. 2008. Wine Science: Principles and Applications. Academic Press, London, UK.
- Jones, J.E.; Kerslake, F.L.; Close, D.C.; Dambergs, R.G. 2014. Viticulture for sparkling wine production: a review. American Journal of Enology and Viticulture 65: 407-416.
- Junquera, L.P.; Jiménez, P.; Sánchez-de-Miguel, J.R.P.; Lissarrague, J.R. 2011. Effect of shoot number on vine balance and berry composition of Tempranillo grapevines. Progrès Agricole et Viticole 128: 32-38.
- Keller, M.; Deyermond, L.S.; Bondada, B.R. 2014. Plant hydraulic conductance adapts to shoot number but limits shoot vigour in grapevines. Functional Plant Biology 42: 366–375.
- Keller, M.; Mills, L.J.; Wample, R.L.; Spayd, S.E. 2005. Cluster thinning effects on three deficit-irrigated Vitis vinifera cultivars. American Journal of Enology and Viticulture 56: 91-103.
- Kliewer, W.M.; Dokoozlian, N.K. 2005. Leaf area/crop weight ratios of grapevines: influence on fruit composition and wine quality. American Journal of Enology and Viticulture 56: 170-181.
- Kliewer, W.M.; Schultz, H.B. 1964. Influence of environment on metabolism of organic acids and carbohydrates in Vitis vinifera II. Light. American Journal of Enology and Viticulture 15: 119-129.
- Kliewer, W.M.; Wolpert, J.A.; Benz, M. 2000. Trellis and vine spacing effects on growth, canopy microclimate, yield and fruit composition of Cabernet Sauvignon. Acta Horticulturae 523: 21-32.
- Li-Mallet, A.; Rabot, A.; Geny, L. 2016. Factors controlling inflorescence primordia formation of grapevine: their role in latent bud fruitfulness? A review. Botany 94: 147-163.
- McCord, J.D.; Trousdale, E.; Ryu, D.D.Y. 1984. An improved sample preparation procedure for the analysis of major organic compounds in grape must and wine by high performance liquid chromatography. American Journal of Enology and Viticulture 35: 28-29.
- Mendonça, T.R.; Mota, R.V.; Souza, C.R.; Dias, F.A.N.; Pimentel, R.M.A.; Regina, M. A. 2016. Pruning management of Chardonnay at high altitude. Bragantia 75: 57-62.
- Myers, J.K.; Wolpert, J.A.; Howell, G.S. 2008. Effect of shoot number on the leaf area and crop weight relationship of young Sangiovese grapevines. American Journal of Enology and Viticulture 59: 422 - 424.
- Petrie, P.R.; Trought, M.C.T.; Howell, G.S.; Buchan, G.D. 2003. The effect of leaf removal and canopy height on whole-vine gas exchange and fruit development of Vitis vinifera L. Sauvignon Blanc. Functional Plant Biology 30: 711-717.
- Poerner, N.; Rodrigues, E.; Celso, P.G.; Manfroi, V.; Hertz, P.F. 2010. Analytical differentiation of the base wines for sparkling from two viticultural regions of Rio Grande do Sul. Ciência Rural 40: 1186-1192 (in Portuguese, with abstract in English).
- Poni, S.; Casalini, L.; Bernizzoni, F.; Civardi, S.; Intrieri, C. 2006. Effects of early defoliation on shoot photosynthesis, yield components, and grape composition. American Journal of Enology and Viticulture 57: 397-407.
- Regina, M.A.; Carmo, E.L.; Fonseca, A.R.; Purgatto, E.; Shiga, T.M.; Lajolo, F.M.; Ribeiro, A.P.; Mota, R.V. 2010. Altitude influence on the quality of ‘Chardonnay’ and ‘Pinot noir’ grapes in the state of Minas Gerais. Revista Brasileira de Fruticultura 32: 143-150 (in Portuguese, with abstract in English).
- Regina, M.A.; Pereira, G.E.; Cançado, G.M.A.; Rodrigues, D.J. 2000. Calculation of vine leaf área by non-destructive method = Cálculo da área foliar em videira por método não destrutivo. Revista Brasileira de Fruticultura 22: 31-313 (in Portuguese).
- Reynolds, A.G.; Edwards, C.G.; Wardle, D.A.; Webster, D.R.; Dever, M. 1994a. Shoot density affects ‘Riesling’ grapevines. I. Vine performance. Journal of American Society for Horticultural Science 119: 874-880.
- Reynolds, A.G.; Edwards, C.G.; Wardle, D.A.; Webster, D.R.; Dever, M. 1994b. Shoot density affects ‘Riesling’ grapevines. II. Wine composition and sensory response. Journal of American Society for Horticultural Science 119: 881-892.
- Reynolds, A.G.; Molek, T.; De Savigny, C. 2005. Timing of shoot thinning in Vitis vinífera: Impacts on yield and fruit composition variables. American Journal of Enology and Viticulture 56: 343-356.
- Reynolds, A.G.; Schlosser, J.; Power, R.; Roberts, R.; Willwerth, J.; Savigny, C. 2007. Magnitude and interaction of viticultural and enological effects. I. Impact of canopy management and yeast strain on sensory and chemical composition of Chardonnay Musqué. American Journal of Enology and Viticulture 58: 12-24.
- Reynolds, A.G.; Wardle, D.A.; Cliff, M.A.; King, M. 2004. Impact of training system and vine spacing on vine performance, berry composition and wine sensory attributes of Riesling. American Journal of Enology and Viticulture 55: 96-103.
- Sánchez, L.A.; Dokoozlian, N.K. 2005. Bud microclimate and fruitfulness in Vitis vinifera L. American Journal of Enology and Viticulture 56: 319-329.
- Silvestroni, O.; Lanari, V.; Lattanzi, T.; Palliotti, A.; Vanderweide, J.; Sabbatini, P. 2019. Canopy management strategies to control yield and grape composition of Moltepuciano grapevines. Australian Journal of Grape and Wine Research 25: 30-42.
- Smart, R.E. 1988: Shoot spacing and canopy light microclimate. American Journal of Enology and Viticulture 39: 325-333.
- Smart, R.E.; Robinson, M. 1991. Sunlight into Wine: A Handbook for Wine Grape Canopy Management. Winetitles Media, Adelaide, Australia.
- Sweetman, C.; Sandras, V.O.; Hancock, R.D.; Soole, K.L.; Ford, C.M. 2014. Metabolic effects of elevated temperature on organic acid degradation in ripening Vitis vinifera fruit. Journal of Experimental Botany 65: 5975-5988.
- Tardaguila, J.; Toda, F.M.; Poni, S.; Diago, M.P. 2010. Impact of early leaf removal on yield and fruit and wine composition of Vitis vinifera L. Graciano and Carignan. American Journal of Enology and Viticulture 61: 37-381.
- União Brasileira de Vitivinicultura [UVIBRA]. 2018. Commercialization of wines and by-products elaborated in the RS from 2012 to 2017 = Comercialização de vinhos e derivados elaborados no RS de 2012 à 2017. Available at: http://www.uvibra.com.br/pdf/comercializacao2012a2017_dez.pdf [Accessed June 5, 2019] (in Portuguese).
» http://www.uvibra.com.br/pdf/comercializacao2012a2017_dez.pdf - Vasconcelos, M.C.; Greven, M.; Winefield, C.S.; Trought, M.C.T.; Raw, V. 2009. The flowering process of Vitis vinifera: a review. American Journal of Enology and Viticulture 60: 411-434.
Edited by
Publication Dates
-
Publication in this collection
24 Jan 2020 -
Date of issue
2020
History
-
Received
26 Oct 2018 -
Accepted
26 June 2019