ABSTRACT:
This study evaluated the leaf area index (LAI) recovery mechanisms and forage accumulation rates on the regrowth of different grass species subjected to different defoliation intensities. For that purpose, plots of Pennisetum clandestinum (kikuyugrass), Lolium multiflorum (annual ryegrass), and Avena strigosa (black oats) were defoliated from 20 to 80 % of their initial heights (25, 20, and 25 cm, respectively). At different increments in height, forage samples were collected to ground level and used to estimate tiller population density (TPD), leaf area per tiller (LA), and forage mass. From these data, we calculated the leaf area index (LAI), average leaf area index (aLAI), and average and instantaneous forage accumulation rate (FAR and IFAR, respectively). Data were plotted over time (days) to describe LAI recovery and forage accumulation rates. As the defoliation intensity increased, greater canopy heights were needed for pastures to achieve their maximum forage accumulation rates, which required longer regrowth intervals. The need for high tiller recruitment after defoliation, which delayed canopy LAI recovery, seemed to be one of the main cause. Thus, grazing management strategies that involve costly tiller recruitment could decrease both overall forage production and sward persistence over time. However, the plant ability to recover LAI after successive intense defoliations seems to be species-dependent and related to their phenotypic plasticity.
Keywords:
grazing heights; grazing management; intermittent stocking; sward targets
Introduction
The critical leaf area index ([LAI]; Brougham, 1958Brougham, R.W. 1958. Interception of light by the foliage of pure and mixed stands of pasture plants. Australian Journal of Agricultural Research 9: 39-52.) has been suggested as the upper limit to interrupt regrowth of pastures under intermittent stocking method (Korte et al., 1982Korte, C.J.; Watkin, B.R.; Harris, W. 1982. Use of residual leaf area index and light interception as criteria for spring-grazing management of a ryegrass-dominant pasture. New Zealand Journal of Agricultural Research 25: 309-319.; Carnevalli et al., 2006Carnevalli, R.A.; Silva, S.C.; Bueno, A.A.O.; Uebele, M.C.; Bueno, F.O.; Hodgson, J.; Silva, G.N.; Morais, J.P.G. 2006. Herbage production and grazing losses in Panicum maximum cv. Mombaça under four grazing managements. Tropical Grasslands 40: 165-176.; Sbrissia et al., 2018Sbrissia, A.F.; Duchini, P.G.; Zanini, G.D.; Santos, G.T.; Padilha, D.A.; Schmitt, D. 2018. Defoliation strategies in pastures submitted to intermittent stocking method: underlying mechanisms buffering forage accumulation over a range of grazing heights. Crop Science 56: 1-10.). However, the effects of residual LAI on pasture productive capacity and its relationship with defoliation management heights are still unclear. Theoretical models developed by Parsons et al. (1988)Parsons, A.J.; Johnson, I.R.; Harvey, A. 1988. Use of a model to optimize the interaction between frequency and severity of intermittent defoliation and to provide a fundamental comparison of the continuous and intermittent defoliation of grass. Grass and Forage Science 43: 49-59. indicate that heavily defoliated pastures reach maximum growth rates later than leniently defoliated pastures do. According to Chapman (2016)Chapman, D.F. 2016. Using ecophysiology to improve farm efficiency: application in temperate dairy grazing systems. Agriculture 6: 17-36., intense defoliations would result in longer regrowth intervals, which could reduce total forage production.
The LAI recovery after defoliation occurs through leaf growth from remaining tillers and/or the emergence of new tillers (Lemaire and Chapman, 1996Lemaire, G.; Chapman, D. 1996. Tissue flows in grazed plant communities. p. 3-36. In: Hodgson, J.; Illius, A.W., eds. The ecology and management of grazing systems. CAB International, Wallingford, UK.). High defoliation intensities can stimulate initial LAI increments through the recruitment of new tillers due to the improved light quality reaching the plant base (Gautier et al., 1999Gautier, H.; Varlet-Grancher, C.; Hazard, L. 1999. Tillering responses to the light environment and to defoliation in populations of perennial ryegrass (Lolium perenne L.) selected for contrasting leaf length. Annals of Botany 83: 423-429.) and apex meristem decapitation (McSteen, 2009McSteen, P. 2009. Hormonal regulation of branching in grasses. Plant Physiology 149: 46-55.). However, frequent recruitment of new tillers can affect forage accumulation; thus, an appropriate management strategy should minimize tillering dependence (Nelson and Zarrough, 1981Nelson, C.J.; Zarrough, K.M. 1981. Tiller density and tiller weight as yield determination of vegetative swards. Plant Physiology and Herbage Production 13: 25-29.). Moreover, forage plants are incapable to maintain a high growth potential after defoliation, despite the possibility of mobilizing carbohydrate reserves and of changes in a specific leaf area (Irving, 2015Irving, J. 2015. Carbon assimilation, biomass partitioning and productivity in grasses. Agriculture 5: 1116-1134.; Chapman, 2016Chapman, D.F. 2016. Using ecophysiology to improve farm efficiency: application in temperate dairy grazing systems. Agriculture 6: 17-36.).
Research data regarding the effects of defoliation intensity on forage production do not always present convergent findings. This is because defoliation intensities are frequently generated from different pre-defoliation targets, which tend to favor targets created with better criteria (e.g., critical LAI; Barbosa et al., 2007Barbosa, R.A.; Nascimento Jr, D.; Euclides, V.P.B.; Silva, S.C.; Zimmer, A.H.; Torres, R.A.A.J. 2007. Tanzania grass subjected to combinations of intensity and frequency of grazing. Pesquisa Agropecuária Brasileira 42: 329-340 (in Portuguese, with abstract in English).; Silva et al., 2009Da Silva, S.C.; Bueno, A.A.O.; Carnevalli, R.A.; Uebele, M.C.; Bueno, F.O.; Hodgson, J.; Matthew, C.; Arnold, G.C.; Moraes, J.P.G. 2009. Sward structural characteristics and herbage accumulation of Panicum maximum cv. Mombaça subjected to rotational stocking managements. Scientia Agricola 66: 8-19.; Zanini et al., 2012Zanini, G.D.; Santos, G.T.; Sbrissia, A.F. 2012. Frequencies and intensities of defoliation in Aruana guineagrass swards: morphogenetic and structural characteristics. Revista Brasileira de Zootecnia 41: 1848-1857.). In addition, most studies did not assess possible interspecific variations in LAI recovery and in forage mass during pasture regrowth. Therefore, this study assessed LAI recovery mechanisms and forage accumulation rates throughout the regrowth of different grass species subjected to different defoliation intensities. The central hypothesis tested was that increasing the defoliation intensity reduces the productive potential of pastures and that it is a species-dependent response.
Materials and Methods
Three experiments (I, II, and III) were conducted using different grass species in Lages, Santa Catarina State, Brazil (27°47’ S, 50°18’ W, altitude of 913 m), between Jan 2014 and Sept 2015. According to the Köppen classification system, the region has a Cfb climate (humid subtropical under oceanic influences), with cold winters, mild summers, and well-distributed rainfall throughout the year (Alvares et al., 2013Alvares, C.A.; Stape, J.L.; Sentelhas P.C.; Gonçalves, J.L.M.; Sparovek, G. 2013. Köppen's climate classification map for Brazil. Meteorologische Zeitschrift 22: 711-728.). Weather data from the experimental period are presented in Table 1. The soil in the experimental area is classified as Clayey Inceptisol (Soil Survey Staff, 1999Soil Survey Staff. 1999. Soil Taxonomy: A Basic System of Soil Classification for Making and Interpreting Soil Surveys. 2ed. USDA-NRCS, Washington, DC, USA. (Agricultural Handbook, 436).). Before the beginning of each experiment, soil samples were collected from 0-20 cm depth and submitted to the chemical analysis. Liming and fertilization were performed in order to reach a baseline pH of about 6.0 and to supply adequate levels of N, P, and K (Table 2), according to the soil analysis and the Fertilizing and Liming Manual for the states of Rio Grande do Sul and Santa Catarina (CQFS, 2004Comissão de Química e Fertilidade do Solo [CQFS]. 2004. Fertilizing and Liming Manual for the States of Rio Grande do Sul and Santa Catarina = Manual de adubação e calagem para os Estados do Rio Grande do Sul e Santa Catarina. CQFS RS/SC, Porto Alegre, RS, Brazil (in Portuguese).).
Average monthly climatic conditions recorded during the experimental months of 2014 and 2015 in Lages, SC, Brazil.
Application dates, fertilizer types, and amounts of phosphorus, potassium, calcium, and nitrogen applied during the three experiments.
Experiment I (kikuyugrass)
This experiment was conducted in a well-established (∼ 20-year-old) 1.8-ha kikuyugrass (Pennisetum clandestinum Hochst ex. Chiov) pasture. The experimental treatments consisted of four defoliation intensities (lowering 40, 50, 60, or 70 % of the initial height) applied from a recommended pre-cutting height of 25 cm (Sbrissia et al., 2018Sbrissia, A.F.; Duchini, P.G.; Zanini, G.D.; Santos, G.T.; Padilha, D.A.; Schmitt, D. 2018. Defoliation strategies in pastures submitted to intermittent stocking method: underlying mechanisms buffering forage accumulation over a range of grazing heights. Crop Science 56: 1-10.) and replicated three times in a randomized block design (12 plots of 1500 m2). The experimental treatments were established as follows: i) in early Dec 2013, the entire area was mowed to a residual height of 10 cm (to standardize the pre-experimental conditions), fertilized (Table 2), and plots were delimitated; ii) when canopies reached 25 cm in height (from 14 Jan 2014 onward), grazing was performed by cattle to the intended residual heights (Table 3), defining the beginning of the data collection period. The canopy heights were measured with a sward stick (Barthram, 1985Barthram, G.T. 1985. Experimental techniques: the HFRO sward stick. p. 29-30. In: Alcock, M.M., ed. Biennial report of the Hill Farming Research Organization. Hill Farming Research Organization, Midlothian, UK.) at 50 points per plot after grazing and twice a week during the regrowth period.
Cutting heights* * Pre-cutting canopy height targets for each species are in bold. (cm) from the residue in different defoliation intensity for kikuyugrass, annual ryegrass, and black oat pastures.
Data were collected throughout two regrowth cycles (from 14 Jan 2014 to 20 Apr 2014). After each grazing event, three areas of 1 m2 per plot were marked with wooden stakes. From these areas, forage samples were collected at five points throughout the regrowth period as follows: i) after grazing; ii) during regrowth (increments of 25, 50, and 75 % of height); and iii) at pre-grazing (25 cm). The heights of each sampling are presented in Table 3. On all occasions, clipping was performed to ground level, using quadrats of 0.0625 m2 and scissors, and samples were taken to the laboratory for immediate processing.
Experiment II (annual ryegrass)
Annual ryegrass ‘BRS Ponteio’ (Lolium multiflorum Lam.) was broadcast-sown (90 kg seeds ha−1) on 24 June 2014 into 16 plots of 1 m2. The experimental treatments comprised four defoliation intensities (lowering 20, 40, 60, or 80 % of the initial height) applied from a recommended pre-cutting height of 20 cm (Santos et al., 2016Santos, G.T.; Zanini, G.D.; Padilha, D.A.; Sbrissia, A.F. 2016. A grazing height target to minimize tiller stem elongation rate in annual ryegrass swards. Ciência Rural 46: 169-175.) and replicated four times in a completely randomized design. Four weeks after sowing, canopies were approximately 20 cm tall. They were first lowered to 10-cm residual height to standardize the pre-experimental conditions and favor pasture establishment. On 09 Aug 2014, the canopies were 20 cm tall and were lowered to the intended residual heights by manual scissors trimming (Table 3), stablishing the beginning of the data collection period. The canopy heights were measured with a sward stick (Barthram, 1985Barthram, G.T. 1985. Experimental techniques: the HFRO sward stick. p. 29-30. In: Alcock, M.M., ed. Biennial report of the Hill Farming Research Organization. Hill Farming Research Organization, Midlothian, UK.) at 15 points per plot twice a week during plot establishment, and daily during the data collection period.
Data were collected throughout a single regrowth cycle from 09 Aug 2014 until the canopies achieved 40 cm in height. This procedure was performed in order to detect, at some point during regrowth, maximum forage accumulation rates (Parsons et al., 1988Parsons, A.J.; Johnson, I.R.; Harvey, A. 1988. Use of a model to optimize the interaction between frequency and severity of intermittent defoliation and to provide a fundamental comparison of the continuous and intermittent defoliation of grass. Grass and Forage Science 43: 49-59.). Forage samplings were performed at every 4 cm increment in height throughout regrowth, from the residue until the canopy reached 40 cm (Table 3). Forage samples were collected to ground level using quadrats of 0.03 m2 and scissors, and were taken to laboratory for immediate processing.
Experiment III (black oat)
Black oat ‘IAPAR 61’ (Avena strigosa Schreb.) was broadcast-sown (90 kg seeds ha−1) on 15 Apr 2015 into nine plots of 2.8 m2. The experimental treatments consisted of three defoliation intensities (lowering 40, 60, and 80 % of the initial height) applied from a recommended pre-cutting height of 25 cm (Guzatti et al., 2015Guzatti, G.C.; Duchini, P.G.; Sbrissia, A.F.; Ribeiro-Filho, H.M.N. 2015. Qualitative aspects and biomass production in oats and ryegrass pastures cultivated pure or intercropping and subjected to lenient grazing. Arquivo Brasileiro de Medicina Veterinária e Zootecnia 67: 1399-1407 (in Portuguese, with abstract in English).; Duchini et al., 2014Duchini, P.G.; Guzatti, G.C.; Ribeiro-Filho, H.M.N.; Sbrissia, A.F. 2014. Tiller size/density compensation in temperate climate grasses grown in monoculture or in intercropping systems under intermittent grazing. Grass and Forage Science 69: 655-665.) and replicated three times in a complete randomized design. On 8 May 2015, canopies were trimmed to a residual height of 10 cm to standardize the pre-experimental conditions and favor pasture establishment. After reaching a height of 25 cm (25 May 2015), pastures were lowered for the first time to the intended residual heights (Table 3). From that point, as canopies reached 25 cm in height (from 06 June 2015 onward), another lowering to the intended residual heights was performed, starting a new data collection period. The canopy heights were measured with a sward stick (Barthram, 1985Barthram, G.T. 1985. Experimental techniques: the HFRO sward stick. p. 29-30. In: Alcock, M.M., ed. Biennial report of the Hill Farming Research Organization. Hill Farming Research Organization, Midlothian, UK.) at 15 points per plot, twice a week during the plots establishment, and daily during the data collection period.
Similar to Experiment II, data were collected throughout a single regrowth cycle from 06 June 2015 (residual heights) until the canopies achieved 40 cm in height (as mentioned above). Forage samplings were performed at every 4 cm increment in height throughout regrowth, from the residue until the canopy reached 40 cm in height (Table 3). Forage samples were collected to ground level using quadrats of 0.06 m2 and scissors, and were taken to laboratory for immediate processing.
Laboratory assessments
The laboratory assessments for experiments I, II, and III followed the same protocol. The number of tillers in each forage sample was counted to estimate the tiller population density (TPD; tillers m−2). Then, green leaf blades from 50 tillers chosen randomly per sample were detached and scanned in a leaf area meter. The results (cm2) were divided by 50 to estimate leaf area per tiller (LA; cm2 per tiller). After TPD and LA were estimated, each sample (i.e., 50 tillers + the remaining material) was separated into plant parts (green leaf blades, stems + sheath, and senescent material), and dried in a forced-air oven at 65 °C for 72 h. The dry weights of these fractions were used to calculate total forage mass (kg DM ha−1).
From these data, the LAI, the average LAI (aLAI), average forage accumulation rate (FAR; kg DM ha−1 d−1), and instantaneous forage accumulation rate (IFAR; kg DM ha−1 d−1) were calculated as follows:
where: LAIi represents the leaf area index at some specific point during regrowth; LAI0 is the leaf area index at the beginning of the regrowth period; FMi is the forage mass (kg DM ha−1) at some specific point during regrowth; FMi–1 is the forage mass (kg DM ha−1) recorded before the FMi; FM0 is the forage mass (kg DM ha−1) at the beginning of the regrowth period; and t is the time interval (days) between FM assessments. Thus, (FMi – FM0) represents the net forage mass variation between the beginning and some specific point during regrowth, and (FMi – FMi–1) equals the net forage mass variation between subsequent increments in height (Table 3).
Finally, the values for maximum average forage accumulation rate (FARmax, kg DM ha−1 d−1), maximum instantaneous forage accumulation rate (IFARmax, kg DM ha−1 d−1), canopy height to reach FARmax (CHFARmax, cm), average forage accumulation rate (FARCHT, kg DM ha−1 d−1), and average LAI (aLAICHT) when pastures reached the canopy height target, and the time (in days) to reach IFARmax and FARmax were determined for each species-defoliation intensity combinations by plotting the data against days at regrowth.
Statistical analyses
Data were analyzed separately for each experiment using the PROC GLM of SAS (SAS Institute, 2008). For Experiment I, data from regrowth cycles were averaged to compose a single mean per plot (n = 12), and analyzed using a model including the fixed effect of defoliation intensity and the random effect of blocks. Data from Experiment II (n = 12) and III (n = 9) were analyzed using a model including the fixed effect of defoliation intensity. Treatment means were estimated using LSMEANS and compared using the Tukey-Kramer test. The significance level was set at 5 % (p < 0.05).
Results
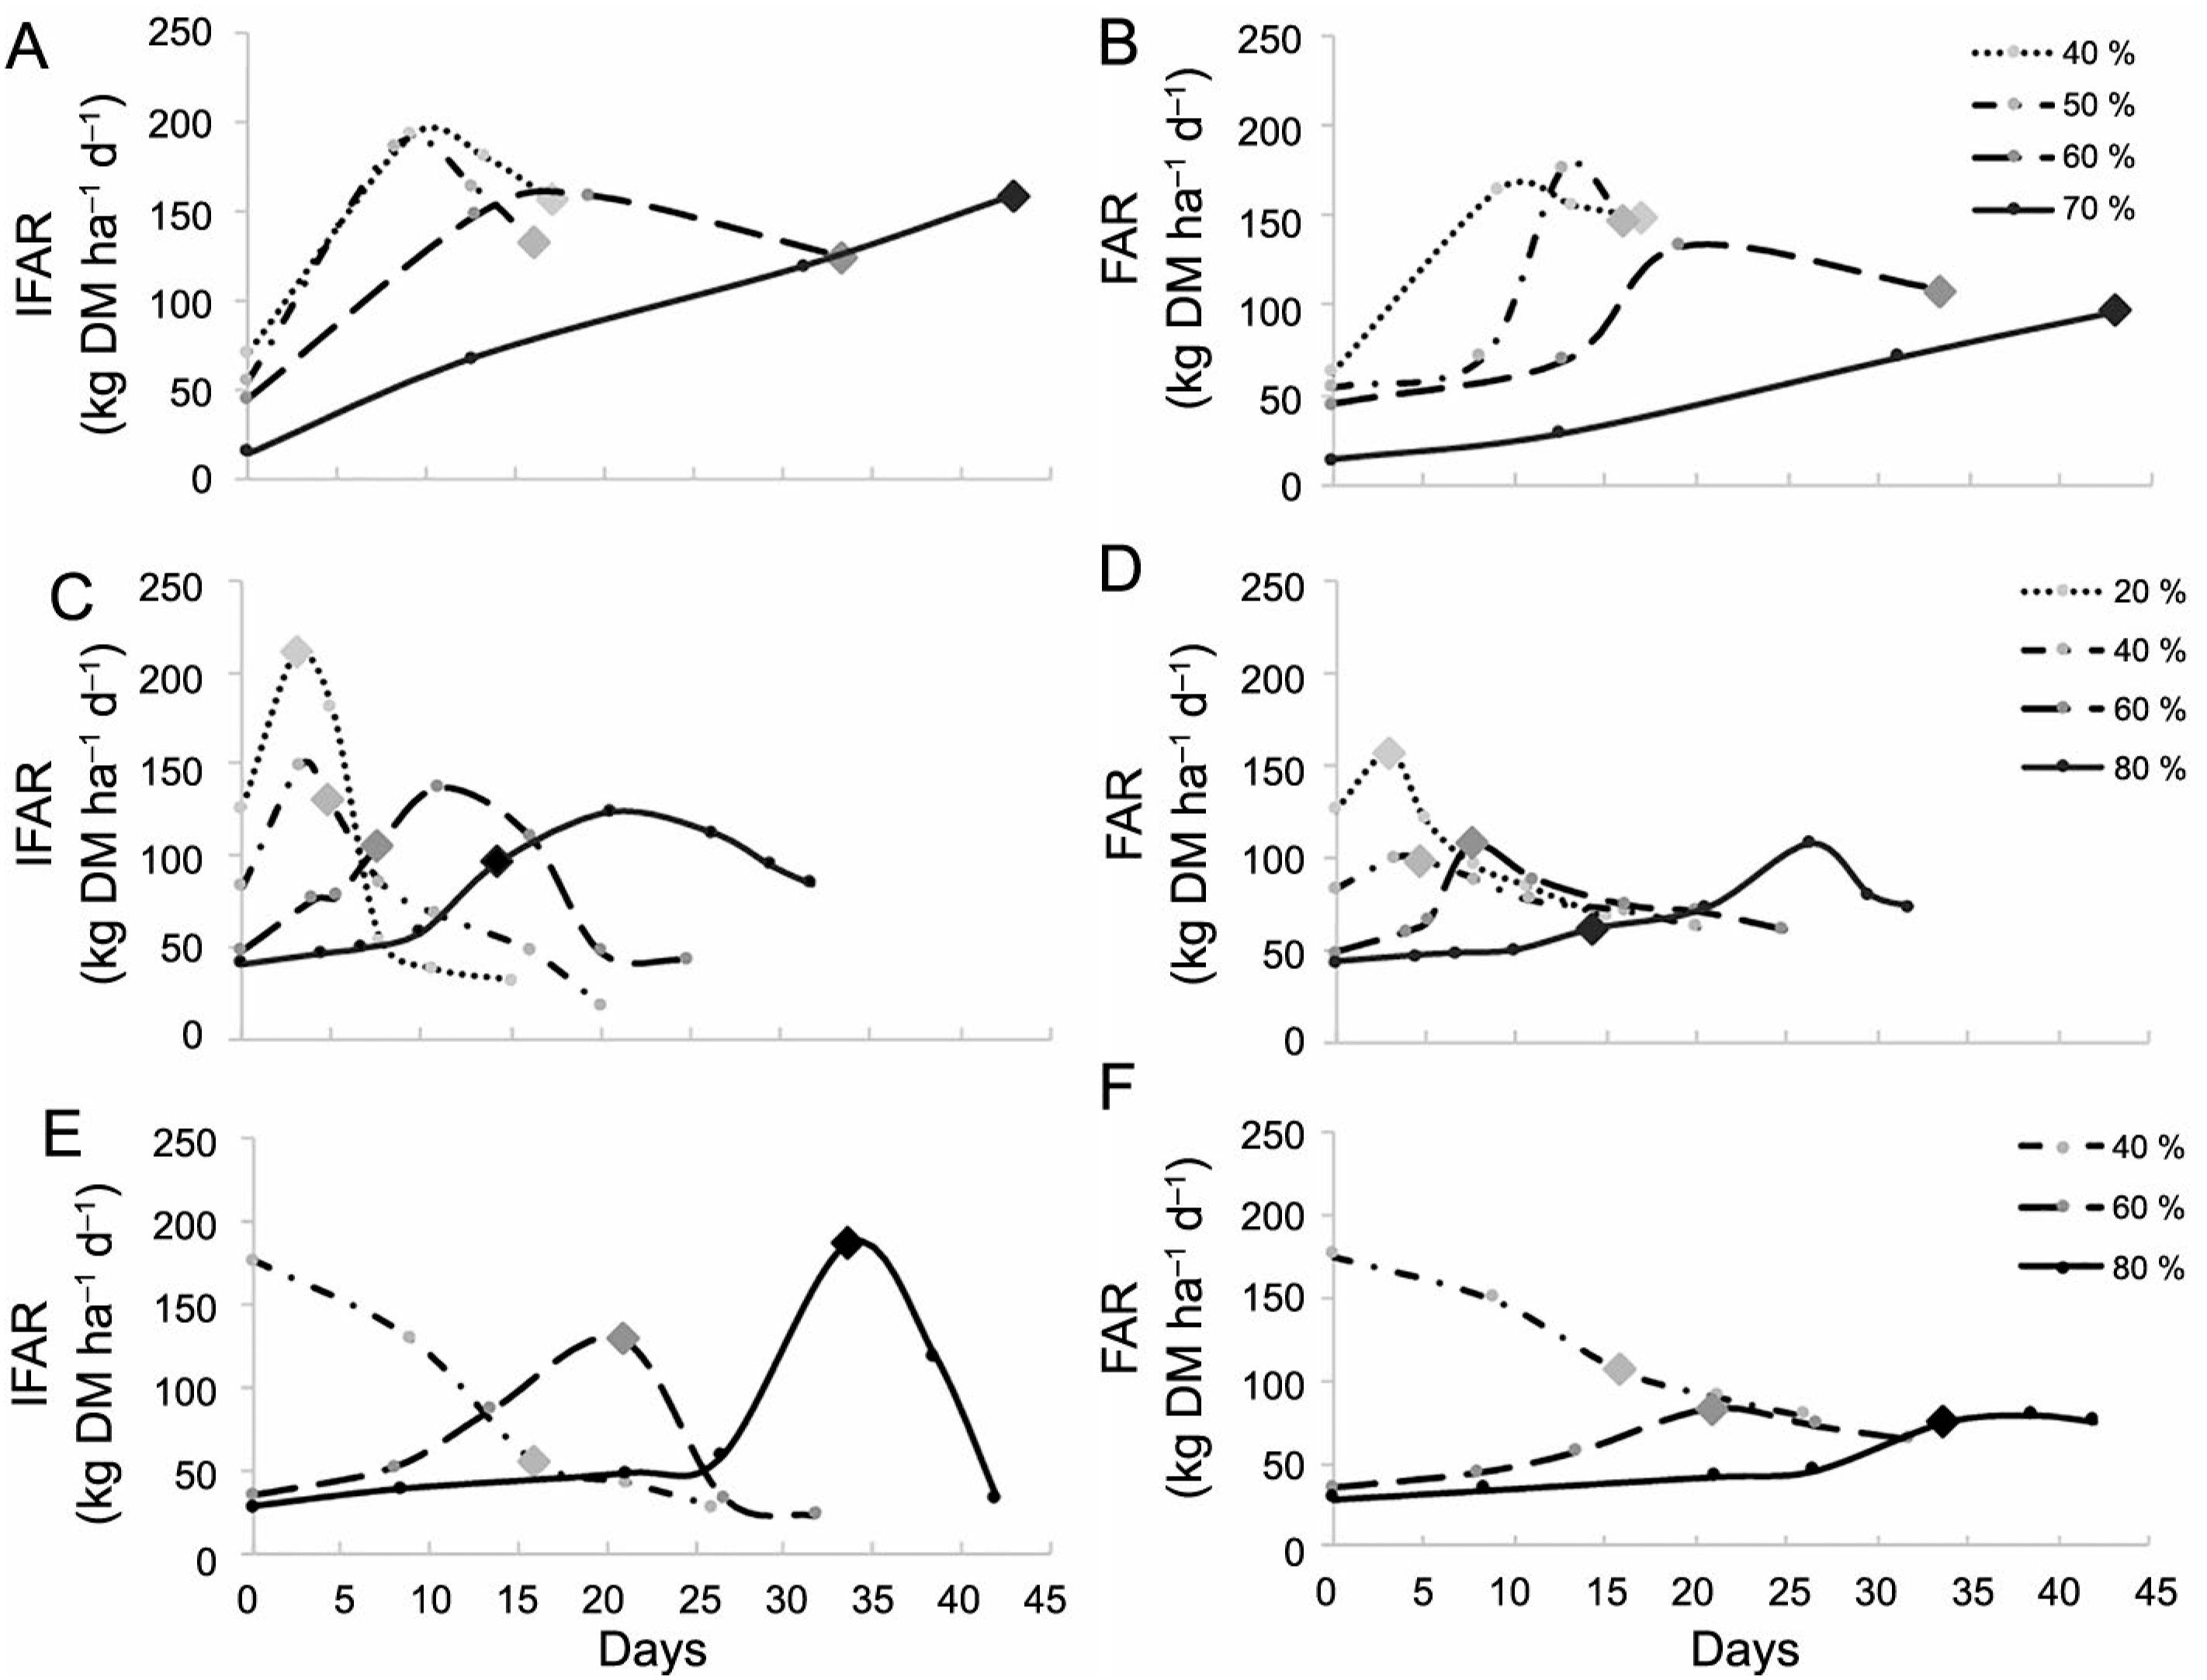
In general, increments in defoliation intensity had negative effects on aLAICHT and FARCHT (Table 4); however, kikuyugrass maintained similar levels when lowered by 40 or 50 % of initial height. Similarly, canopies under greater defoliation intensities (≥ 40 % for annual ryegrass and > 50 % for black oats and kikuyugrass) had a lower FARmax and reached that condition above the CHT (CHFARmax; Table 4). The time required for canopies to reach IFARmax and FARmax rose as defoliation intensity increased (Figure 1A-F); however, kikuyugrass did not reach either FARmax or IFARmax when defoliated at 70 %, since the protocol used for this species comprised assessments of only up to 25 cm (Table 4).
Variables related to canopy height and forage accumulation rate of kikuyugrass, annual ryegrass, and black oat pastures subjected to different defoliation intensities.
Instantaneous (IFAR; A, C, and E) and average (FAR; B, D, and F) forage accumulation rates evolution in kikuyugrass (A and B), annual ryegrass (C and D), and black oat (E and F) pastures submitted to different defoliation intensities. Diamonds correspond to the moment when pastures reached their pre-cutting canopy height targets (CHT).
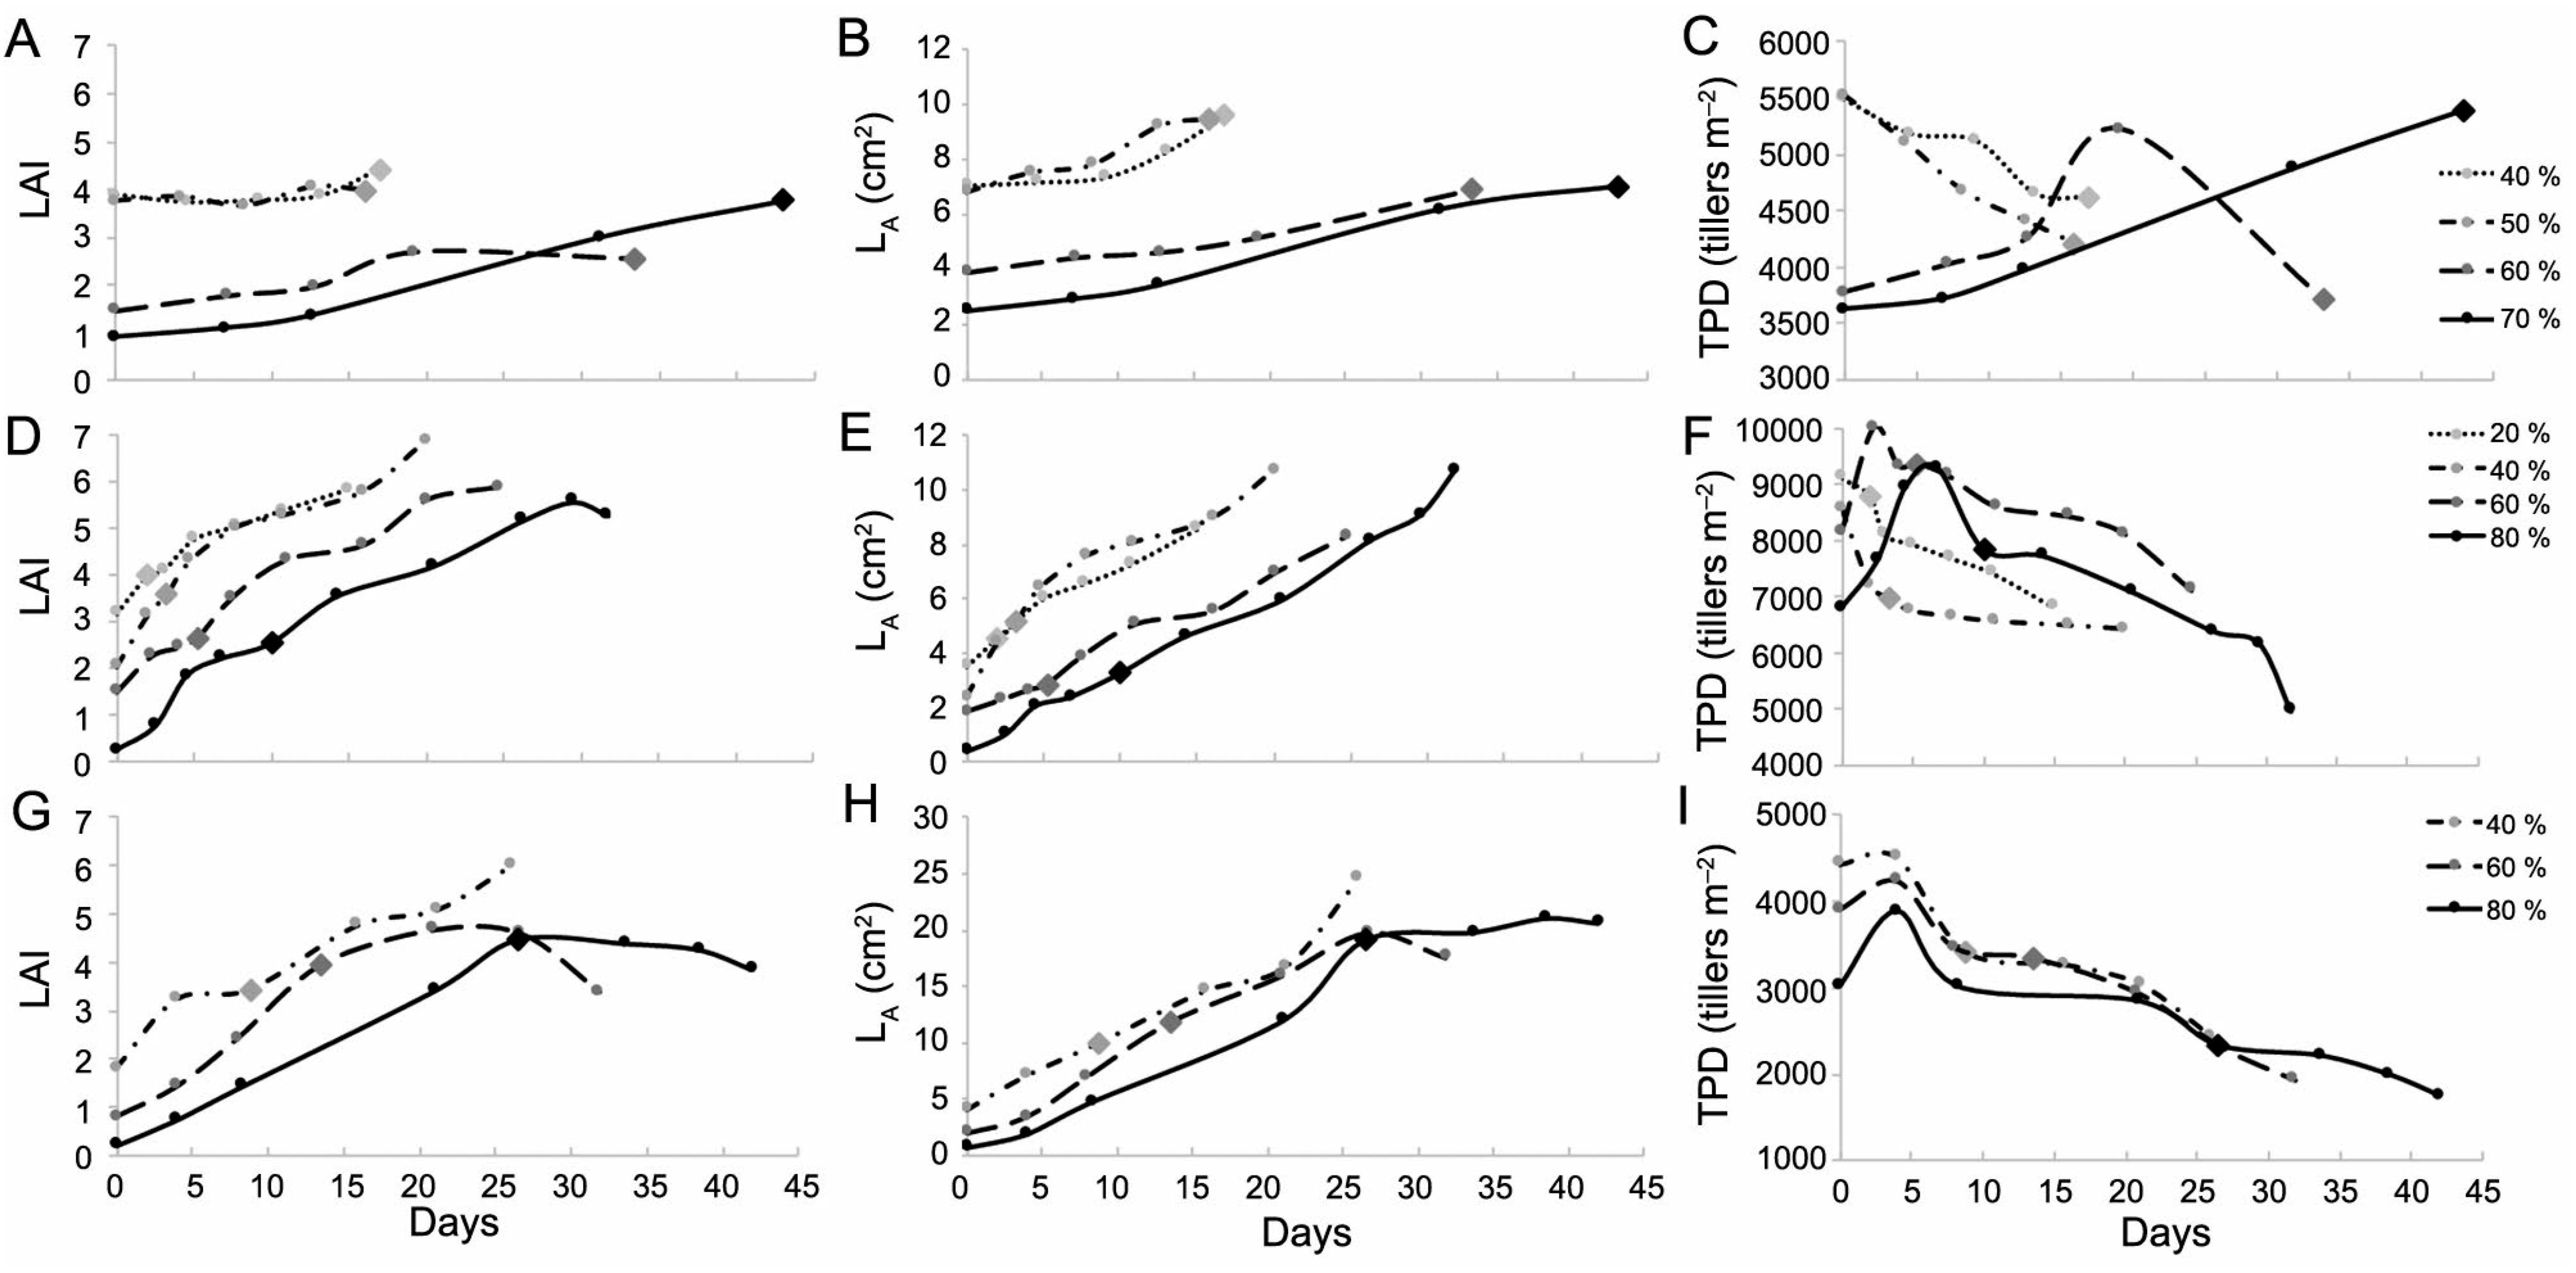
The LAI recovery in canopies under intense defoliation (> 50 %) depended on TPD and LA increments, mainly for kikuyugrass and annual ryegrass (Figures 2A-I). Black oat was less capable to recruit new tillers to recover LAI, even after intense defoliations (Figures 2G and 2I). Less-intense defoliations (≤ 50 %) resulted in LAI recovery through LA increments for all of the studied species (Figures 2B, 2E and 2H). For kikuyugrass, lenient defoliations (40 and 50 %) caused tiller mortality and LA increases in the same proportions thus LAI was similar throughout the regrowth period (Figures 2A-C).
Tiller population density (TPD) and average leaf area per tiller (LA) contribution in LAI recovery for kikuyugrass (A, B, and C), annual ryegrass (D, E, and F), and black oat (G, H, and I) pastures submitted to different defoliation intensities. Diamonds correspond to the moment when pastures reached their pre-cutting canopy height targets (CHT).
Discussion
Impact of defoliation intensity on the productive potential of pastures
Overall, decreases in FARCHT and aLAICHT occurred with increasing defoliation intensity (Table 4). These decreases occurred due to a gradual reduction in residual LAI, as residual LAI determines the amount of light intercepted by the canopy after defoliation and, consequently, the leaf area replacement and organic reserves usages during regrowth (Donaghy and Fulkerson, 1998Donaghy, D.J.; Fulkerson, W.J. 1998. Priority for allocation of water soluble carbohydrate reserves during regrowth of Lolium perenne. Grass and Forage Science 53: 211-218.). Another factor that might have contributed to these decreases was the initial LAI recovery pattern, since the initial TPD increase is associated to the emergence of new tillers, as they are light and have a low LA, they have little contribution to the LAI and forage accumulation (Tainton, 1974Tainton, N. 1974. Effects of different grazing rotations on pasture production. Grass and Forage Science 29: 191-202.). Thus, the increase in defoliation intensity triggered greater tissue renewal from low residual LAI (low pasture photosynthetic capacity), reducing FARCHT.
Although the increase in defoliation intensity reduced the forage production capacity of all three species, some distinctions were observed (Table 4). The lack of difference between defoliations of 40 and 50 % in the kikuyugrass was probably due to compensatory mechanisms between tiller size and tissue flows, as previously reported for this species under moderate defoliation intensity (50 % of initial pre-grazing height; Sbrissia et al., 2018Sbrissia, A.F.; Duchini, P.G.; Zanini, G.D.; Santos, G.T.; Padilha, D.A.; Schmitt, D. 2018. Defoliation strategies in pastures submitted to intermittent stocking method: underlying mechanisms buffering forage accumulation over a range of grazing heights. Crop Science 56: 1-10.). On the other hand, the annual ryegrass and black oat growth habit (caespitose grasses) might have contributed, as small increments in defoliation intensity significantly decreased the residual LAIs and consequently their productive potentials (Figures 1B and 1C). Such responses suggest that these forage species exhibit mechanisms of adaptation to defoliation that are different from those observed in kikuyugrass, even under moderate defoliation intensities.
According to Parsons et al. (1988)Parsons, A.J.; Johnson, I.R.; Harvey, A. 1988. Use of a model to optimize the interaction between frequency and severity of intermittent defoliation and to provide a fundamental comparison of the continuous and intermittent defoliation of grass. Grass and Forage Science 43: 49-59., young leaves and/or those that grow under full light conditions (e.g., pastures managed at shorter heights) exhibit greater photosynthetic capacity as compared to old leaves and/or those grown under shadowy conditions (e.g., pastures managed at taller heights), which could, in theory, explain some productive equivalencies of pastures managed under different conditions (e.g., different heights or residual LAI). However, in our study, this advantage does not seem to have been enough to compensate for the differences in residual LAI when the pastures were defoliated more than 50 %. This probably ocurred because once pasture regrowth, it partially depends on tiller recruitment, a process that involves a concomitant investment on tissues that do not contribute to LAI and aerial biomass increment (e.g., roots) (Tainton, 1974Tainton, N. 1974. Effects of different grazing rotations on pasture production. Grass and Forage Science 29: 191-202.), which extend the period to reach the maximum growth rates. Therefore, Nelson and Zarrough (1981)Nelson, C.J.; Zarrough, K.M. 1981. Tiller density and tiller weight as yield determination of vegetative swards. Plant Physiology and Herbage Production 13: 25-29. showed that tiller growth is more important than TPD to determine forage accumulation rate in established swards. Additionally, greater LAIs (observed in the less-intense defoliations; Figures 2A, 2D and 2G) usually results in greater leaf elongation rates (Berone et al., 2007Berone, G.D.; Lattanzi, F.A.; Colabelli, M.R.; Agnusdei, M.G. 2007. A comparative analysis of the temperature response of leaf elongation in Bromus stamineus and Lolium perenne plants in the field: intrinsic and size-mediated effects. Annals of Botany 100: 813-820.; Sbrissia et al., 2018Sbrissia, A.F.; Duchini, P.G.; Zanini, G.D.; Santos, G.T.; Padilha, D.A.; Schmitt, D. 2018. Defoliation strategies in pastures submitted to intermittent stocking method: underlying mechanisms buffering forage accumulation over a range of grazing heights. Crop Science 56: 1-10.), which, associated with the greater TPD (Figures 2C, 2F and 2I), allowed fast initial increments of average and instantaneous forage accumulation rates in the canopies that were defoliated less intensively (Figures 1A-F). Therefore, apparently, the intense tissue renewal per se cannot be considered a factor that justifies the use of defoliation intensities above 50 % of initial height, particularly when the objective is to maximize forage accumulation.
Defoliation intensity influence on LAI recovery
The greater defoliation intensities resulted in lower residual LAI due to lower TPD and LA; thus, canopies used different means to recover the LAI after defoliation (Figures 2A-I). Canopies that were lowered by more than half of their canopy height target invested in increasing both LA and TPD at the initial regrowth, while those lowered up to 50 % recovered their LAI mainly through LA increments (Figures 2A-I).
Although every species exhibited TPD reduction after a period of regrowth, this occurred at different intensities and LAI for the three species, which could be a result of their different tillering and TPD maintenance abilities (Duchini et al., 2014Duchini, P.G.; Guzatti, G.C.; Ribeiro-Filho, H.M.N.; Sbrissia, A.F. 2014. Tiller size/density compensation in temperate climate grasses grown in monoculture or in intercropping systems under intermittent grazing. Grass and Forage Science 69: 655-665.; Sbrissia et al., 2018Sbrissia, A.F.; Duchini, P.G.; Zanini, G.D.; Santos, G.T.; Padilha, D.A.; Schmitt, D. 2018. Defoliation strategies in pastures submitted to intermittent stocking method: underlying mechanisms buffering forage accumulation over a range of grazing heights. Crop Science 56: 1-10.). Therefore, LAI recovery after defoliation depends not only on the defoliation intensity, but also on interspecific factors. In this sense, kikuyugrass submitted to moderate defoliation exhibited lower LAI variations, maintaining a high LA and adjusting TPD; however, when submitted to intense defoliation, this species resorted to LA and TPD adjustments (Figures 2A-C). Annual ryegrass showed adjustments in TPD and increments in LA to recover its LAI in all defoliation intensities (Figures 2D-F), whereas black oat regulated its LAI throughout the regrowth primarily through adjustments in LA, regardless of the defoliation intensity (Figures 2G-I). These results are in line with those reported in the literature, as annual ryegrass and kikuyugrass have higher tillering capacity while black oat has difficulty to maintain its TPD over time and depends on quick LA increments to recompose its LAI (Duchini et al., 2014Duchini, P.G.; Guzatti, G.C.; Ribeiro-Filho, H.M.N.; Sbrissia, A.F. 2014. Tiller size/density compensation in temperate climate grasses grown in monoculture or in intercropping systems under intermittent grazing. Grass and Forage Science 69: 655-665.; Sbrissia et al., 2018Sbrissia, A.F.; Duchini, P.G.; Zanini, G.D.; Santos, G.T.; Padilha, D.A.; Schmitt, D. 2018. Defoliation strategies in pastures submitted to intermittent stocking method: underlying mechanisms buffering forage accumulation over a range of grazing heights. Crop Science 56: 1-10.). It is worth noting that the deviations from these trends in specific moments of regrowth are due to the emergence of small and low LA tillers and/or tiller size/density compensation mechanisms (Matthew et al., 1995Matthew, C.; Lemaire, G.; Hamilton, N.R.S.; Hernandez-Garay, A. 1995. A modified self-thinning equation to describe size/density relationships for defoliated swards. Annals of Botany 76: 579-587.).
Defoliation intensity effect on average and instantaneous forage accumulation rate
Parsons et al. (1988)Parsons, A.J.; Johnson, I.R.; Harvey, A. 1988. Use of a model to optimize the interaction between frequency and severity of intermittent defoliation and to provide a fundamental comparison of the continuous and intermittent defoliation of grass. Grass and Forage Science 43: 49-59. used mathematical models to show the LAI recovery pattern of perennial ryegrass (Lolium perenne L.) submitted to different defoliation intensities to dissert about the rates of gross photosynthesis (Pgross), net photosynthesis (Pnet; i.e., gross tissue production), senescence, and average and instantaneous growth rates. In their study, pastures that were intensively defoliated had lower initial Pnet and senescence rates, which led to a delay in reaching the maximum growth rates, while lenient defoliations had little effect on Pnet and senescence, allowing those pastures to quickly obtain the maximum growth rates. Similarly, our results showed that increasing defoliation intensity promoted delays to obtain the IFARmax and FARmax rates in kikuyugrass, annual ryegrass, and black oat pastures (Table 4; Figures 1A-F). An important difference compared to Parsons et al. (1988)Parsons, A.J.; Johnson, I.R.; Harvey, A. 1988. Use of a model to optimize the interaction between frequency and severity of intermittent defoliation and to provide a fundamental comparison of the continuous and intermittent defoliation of grass. Grass and Forage Science 43: 49-59. is that, while they found different intervals to reach the FARmax, our results show that, over time, increasing height is needed to reach this condition in highly defoliated swards.
Therefore, based on various studies suggesting a period for pastures to be defoliated to maximize forage production, for instance, the FARmax (Parsons et al., 1988Parsons, A.J.; Johnson, I.R.; Harvey, A. 1988. Use of a model to optimize the interaction between frequency and severity of intermittent defoliation and to provide a fundamental comparison of the continuous and intermittent defoliation of grass. Grass and Forage Science 43: 49-59.) and IFARmax (Morley, 1968Morley, F.H.W. 1968. Pasture growth curves and grazing management. Australian Journal of Experimental Agriculture 8: 40-45.; Maeda and Yonetani, 1978Maeda, S.; Yonetani, T. 1978. Optimum cutting stage of forage plants. II. Seasonal changes of CGR and average productivity in Italian ryegrass population. Journal of Japanese Society of Grassland Science 24: 10-16.), or when both of these are equivalently high (Parsons et al., 2011Parsons, A.J.; Rowarth, J.; Thornley, J.; Newton, P. 2011. Primary production of grasslands, herbage accumulation and use, and impacts of climate change. p. 3-13. In: Lemaire, G.; Hodgson, J.; Chabbi, A., eds. Grassland productivity and ecosystem services. CAB International, Wallingford, UK.), our findings show that the productive response of management based on presumed ideal pre-defoliation heights are dependent on the defoliation intensity to which the pasture will be submitted. Generally, in canopies submitted to defoliations up to 60 %, the maximum growth rates were obtained at heights close to the pre-defined targets for our study (Table 4; Figures 1A-F). On the other hand, for defoliation intensities of 70 % and 80 %, the maximum forage accumulation rates were reached at greater heights as compared to the pre-determined ones (Table 4; Figures 1A-F). This lack of synchrony may be due to the average LAI reduction and to the delay in LAI recovery caused by greater defoliation intensity. Thus, for intensively defoliated pastures, the delay in reaching their maximum forage accumulation rates reflects not only the low initial growth rates (Chapman, 2016Chapman, D.F. 2016. Using ecophysiology to improve farm efficiency: application in temperate dairy grazing systems. Agriculture 6: 17-36.), but also their need to reach greater heights to minimize the negative effects of low residual LAIs. The use of heights greater than those defined in this study as the pre-defoliation target could favor the accumulation of stem and dead material (Da Silva et al., 2015Da Silva, S.C.; Sbrissia, A.F.; Pereira, L.E.T. 2015. Ecophysiology of C4 forage grasses: understanding plant growth for optimising their use and management. Agriculture 5: 598-625.), structures that reduce the nutritional value of the material offered to the animals and impose physical restrictions on the foraging process (Stobbs, 1973Stobbs, T.H. 1973. The effect of plant structure on the intake of tropical pastures. I. Variation in the bite size of grazing cattle. Australian Journal of Agricultural Research 24: 609-619.; Benvenutti et al., 2006Benvenutti, M.A.; Gordon, I.J.; Poppi, D.P. 2006. The effect of the density and physical properties of grass stems on the foraging behaviour and instantaneous intake rate by cattle grazing an artificial reproductive tropical sward. Grass and Forage Science 61: 272-281.).
Implications
The findings reported here highlight the mechanisms of LAI recovery and forage accumulation rates in defoliated swards. As the defoliation intensity increases, greater canopy heights are needed for pastures to achieve their maximum forage accumulation rates, requiring longer regrowth intervals. The need for high tiller appearance after defoliation, which delays canopy LAI recovery, seems to be one of the main causes; thus, grazing management strategies that involve costly tiller recruitment could decrease both overall forage production and sward persistence over time. However, the plant ability to recover LAI after successive intense defoliations seems to be species-dependent and related to their phenotypic plasticity.
Acknowledgements
The authors would like to thank FAPESC (Fundação de Apoio à Pesquisa Científica e Tecnológica do Estado de Santa Catarina; grant number 2019 TR-584) for funding this research. The first author would like to thank FAPESC and CAPES (Coordenação de Aperfeiçoamento de Pessoal de Nível Superior) for the scholarship.
References
- Alvares, C.A.; Stape, J.L.; Sentelhas P.C.; Gonçalves, J.L.M.; Sparovek, G. 2013. Köppen's climate classification map for Brazil. Meteorologische Zeitschrift 22: 711-728.
- Barbosa, R.A.; Nascimento Jr, D.; Euclides, V.P.B.; Silva, S.C.; Zimmer, A.H.; Torres, R.A.A.J. 2007. Tanzania grass subjected to combinations of intensity and frequency of grazing. Pesquisa Agropecuária Brasileira 42: 329-340 (in Portuguese, with abstract in English).
- Barthram, G.T. 1985. Experimental techniques: the HFRO sward stick. p. 29-30. In: Alcock, M.M., ed. Biennial report of the Hill Farming Research Organization. Hill Farming Research Organization, Midlothian, UK.
- Benvenutti, M.A.; Gordon, I.J.; Poppi, D.P. 2006. The effect of the density and physical properties of grass stems on the foraging behaviour and instantaneous intake rate by cattle grazing an artificial reproductive tropical sward. Grass and Forage Science 61: 272-281.
- Berone, G.D.; Lattanzi, F.A.; Colabelli, M.R.; Agnusdei, M.G. 2007. A comparative analysis of the temperature response of leaf elongation in Bromus stamineus and Lolium perenne plants in the field: intrinsic and size-mediated effects. Annals of Botany 100: 813-820.
- Brougham, R.W. 1958. Interception of light by the foliage of pure and mixed stands of pasture plants. Australian Journal of Agricultural Research 9: 39-52.
- Carnevalli, R.A.; Silva, S.C.; Bueno, A.A.O.; Uebele, M.C.; Bueno, F.O.; Hodgson, J.; Silva, G.N.; Morais, J.P.G. 2006. Herbage production and grazing losses in Panicum maximum cv. Mombaça under four grazing managements. Tropical Grasslands 40: 165-176.
- Chapman, D.F. 2016. Using ecophysiology to improve farm efficiency: application in temperate dairy grazing systems. Agriculture 6: 17-36.
- Comissão de Química e Fertilidade do Solo [CQFS]. 2004. Fertilizing and Liming Manual for the States of Rio Grande do Sul and Santa Catarina = Manual de adubação e calagem para os Estados do Rio Grande do Sul e Santa Catarina. CQFS RS/SC, Porto Alegre, RS, Brazil (in Portuguese).
- Da Silva, S.C.; Bueno, A.A.O.; Carnevalli, R.A.; Uebele, M.C.; Bueno, F.O.; Hodgson, J.; Matthew, C.; Arnold, G.C.; Moraes, J.P.G. 2009. Sward structural characteristics and herbage accumulation of Panicum maximum cv. Mombaça subjected to rotational stocking managements. Scientia Agricola 66: 8-19.
- Da Silva, S.C.; Sbrissia, A.F.; Pereira, L.E.T. 2015. Ecophysiology of C4 forage grasses: understanding plant growth for optimising their use and management. Agriculture 5: 598-625.
- Donaghy, D.J.; Fulkerson, W.J. 1998. Priority for allocation of water soluble carbohydrate reserves during regrowth of Lolium perenne Grass and Forage Science 53: 211-218.
- Duchini, P.G.; Guzatti, G.C.; Ribeiro-Filho, H.M.N.; Sbrissia, A.F. 2014. Tiller size/density compensation in temperate climate grasses grown in monoculture or in intercropping systems under intermittent grazing. Grass and Forage Science 69: 655-665.
- Gautier, H.; Varlet-Grancher, C.; Hazard, L. 1999. Tillering responses to the light environment and to defoliation in populations of perennial ryegrass (Lolium perenne L.) selected for contrasting leaf length. Annals of Botany 83: 423-429.
- Guzatti, G.C.; Duchini, P.G.; Sbrissia, A.F.; Ribeiro-Filho, H.M.N. 2015. Qualitative aspects and biomass production in oats and ryegrass pastures cultivated pure or intercropping and subjected to lenient grazing. Arquivo Brasileiro de Medicina Veterinária e Zootecnia 67: 1399-1407 (in Portuguese, with abstract in English).
- Irving, J. 2015. Carbon assimilation, biomass partitioning and productivity in grasses. Agriculture 5: 1116-1134.
- Korte, C.J.; Watkin, B.R.; Harris, W. 1982. Use of residual leaf area index and light interception as criteria for spring-grazing management of a ryegrass-dominant pasture. New Zealand Journal of Agricultural Research 25: 309-319.
- Lemaire, G.; Chapman, D. 1996. Tissue flows in grazed plant communities. p. 3-36. In: Hodgson, J.; Illius, A.W., eds. The ecology and management of grazing systems. CAB International, Wallingford, UK.
- Maeda, S.; Yonetani, T. 1978. Optimum cutting stage of forage plants. II. Seasonal changes of CGR and average productivity in Italian ryegrass population. Journal of Japanese Society of Grassland Science 24: 10-16.
- Matthew, C.; Lemaire, G.; Hamilton, N.R.S.; Hernandez-Garay, A. 1995. A modified self-thinning equation to describe size/density relationships for defoliated swards. Annals of Botany 76: 579-587.
- McSteen, P. 2009. Hormonal regulation of branching in grasses. Plant Physiology 149: 46-55.
- Morley, F.H.W. 1968. Pasture growth curves and grazing management. Australian Journal of Experimental Agriculture 8: 40-45.
- Nelson, C.J.; Zarrough, K.M. 1981. Tiller density and tiller weight as yield determination of vegetative swards. Plant Physiology and Herbage Production 13: 25-29.
- Parsons, A.J.; Rowarth, J.; Thornley, J.; Newton, P. 2011. Primary production of grasslands, herbage accumulation and use, and impacts of climate change. p. 3-13. In: Lemaire, G.; Hodgson, J.; Chabbi, A., eds. Grassland productivity and ecosystem services. CAB International, Wallingford, UK.
- Parsons, A.J.; Johnson, I.R.; Harvey, A. 1988. Use of a model to optimize the interaction between frequency and severity of intermittent defoliation and to provide a fundamental comparison of the continuous and intermittent defoliation of grass. Grass and Forage Science 43: 49-59.
- Santos, G.T.; Zanini, G.D.; Padilha, D.A.; Sbrissia, A.F. 2016. A grazing height target to minimize tiller stem elongation rate in annual ryegrass swards. Ciência Rural 46: 169-175.
- Sbrissia, A.F.; Duchini, P.G.; Zanini, G.D.; Santos, G.T.; Padilha, D.A.; Schmitt, D. 2018. Defoliation strategies in pastures submitted to intermittent stocking method: underlying mechanisms buffering forage accumulation over a range of grazing heights. Crop Science 56: 1-10.
- Soil Survey Staff. 1999. Soil Taxonomy: A Basic System of Soil Classification for Making and Interpreting Soil Surveys. 2ed. USDA-NRCS, Washington, DC, USA. (Agricultural Handbook, 436).
- Stobbs, T.H. 1973. The effect of plant structure on the intake of tropical pastures. I. Variation in the bite size of grazing cattle. Australian Journal of Agricultural Research 24: 609-619.
- Tainton, N. 1974. Effects of different grazing rotations on pasture production. Grass and Forage Science 29: 191-202.
- Zanini, G.D.; Santos, G.T.; Sbrissia, A.F. 2012. Frequencies and intensities of defoliation in Aruana guineagrass swards: morphogenetic and structural characteristics. Revista Brasileira de Zootecnia 41: 1848-1857.
Edited by
Publication Dates
-
Publication in this collection
17 Apr 2020 -
Date of issue
2021
History
-
Received
04 Apr 2019 -
Accepted
11 July 2019