ABSTRACT:
This study aimed to evaluate the relationship of edaphic fauna under a no-tillage system with different levels of soybean productivity [High (NTH), Medium (NTM) and Low (NTL)] in the west of Santa Catarina (Brazil), identifying which chemical and physical variables most affect them, and the best indicators that can be used. Native forest (NF) areas were used as a reference. A total of 207 samples of soil fauna were collected by soil monolith and pitfall trap methods over two years of evaluation in four municipalities. Based on edaphic fauna data, Shannon-Wiener (H’), Pielou (J), Dominance (D), Margalef and Fisher Alpha (α) indices were generated, in addition to the average richness and abundance. Data from NTs were submitted to analysis of variance and compared by Tukey's test (p > 0.05). The NF was used as a reference and compared with the agriculture system by Dunnett test (p > 0.05), and regressions between soybean productivity and diversity indices. The H’, Margalef, α indices, and average richness for soil fauna sampled by soil monoliths followed the productivity gradient NTH > NTM > NTL, showing a positive correlation with the increase of soybean productivity. NTH has a diversity index similar to that of NF. Soybean productivity is affected by the richness and diversity of edaphic fauna, but abundance was not sensitive in predicting treatments under no-tillage; Fisher's alpha index was more sensitive in treatment separation with soil monoliths. The environmental variables aluminum, organic matter, phosphorus, potassium and penetration resistance affect the fauna edaphic.
Keywords:
soil quality; soil biology; agricultural sustainability; conservation system
Introduction
Currently, with NT intensification, there were increases in variation between the nutrient content in soil and crop productivity response under this system (Nicolodi and Gianello, 2017Nicolodi, M.; Gianello, C. 2017. Noise in soil fertility assessment and challenges to its characterization = Ruído na avaliação da fertilidade do solo e desafios a sua caracterização. Revista Plantio Direto 158: 10-25 (in Portuguese).). The evaluation and the mineralist concept of fertility used to define soil production capacity were insufficient to explain the results obtained for corn productivity under the NT system (Nicolodi et al., 2008Nicolodi, M.; Gianello, C.; Anghinoni, I.; Marré, J.; Mielniczuk, J. 2008. Insufficiency of the mineralist concept to express soil fertility as perceived by plants in no-tillage system. Revista Brasileira de Ciência do Solo 32: 2735-2744 (in Portuguese, with abstract in English).; 2014Nicolodi, M.; Gianello, C.; Anghinoni, I.; Marré, J.; Mielniczuk, J. 2014. The mineralist concept to express the soil fertility perceived by plants grown under no-tillage system. International Journal of Agricultural Science Research 3: 187-195.).
This has resulted in a number of cases with low crop responses under high soil fertility conditions and high productivities under low fertility conditions. Although this variability has always existed, increasing variances have been observed under NT (Nicolodi and Gianello, 2017Nicolodi, M.; Gianello, C. 2017. Noise in soil fertility assessment and challenges to its characterization = Ruído na avaliação da fertilidade do solo e desafios a sua caracterização. Revista Plantio Direto 158: 10-25 (in Portuguese).). Limitations in the evaluation of soil conservation through chemical analysis alone have led to searches for soil biological indicators by farmers, technicians and agronomists (Mendes et al., 2019Mendes, I.C.; Souza, L.M.; Souza, D.M.G.; Lopes, A.A.C.; Reis-Junior, F.B.; Lacerda, M.P.C.; Malaquias, J.V. 2019. Critical limits for microbial indicators in tropical Oxisols at post-harvest: the FERTBIO soil sample concept. Applied Soil Ecology 139: 85-93.).
Based on the above, it is believed that ecological indicators such as edaphic fauna of these locations may be affecting the production response of the crops. Edaphic fauna is already known to act on organic matter decomposition, nutrient cycling, litter fragmentation and gallery opening, performing numerous ecosystem functions under different soil management systems (Baretta et al., 2014Baretta, D.; Bartz, M.L.C.; Fachini, I.; Anselmi, R.; Zortéa, T.; Maluche-Baretta, C.R.D. 2014. Soil fauna and its relation with environmental variables in soil management systems. Revista Ciência Agronômica 45: 871-879.; Bender and Van Der Heijden, 2015Bender, S.F.; Van Der Heijden, M.G.A. 2015. Soil biota enhance agricultural sustainability by improving crop productivity, nutrient uptake and reducing nitrogen leaching losses. Journal of Applied Ecology 52: 228-239.; Choudhary et al., 2018Choudhary, M.; Datta, A.; Jat, H.S.; Yadav, A.K.; Gathala, M.K.; Sapkota, T.B.; Sharma, P.C.; Jat, M.L.; Singh, R.; Ladha, J.K. 2018. Changes in soil biology under conservation agriculture based on sustainable intensification of cereal systems in the Indo-Gangetic Plains. Geoderma 313: 193-204.; Pompeo et al., 2017Pompeo, P.N.; Oliveira Filho, L.C.I.; Santos, M.A.B.; Mafra, A.L.; Klauberg Filho, O.; Baretta, D. 2017. Morphological diversity of Coleoptera (Arthropoda: Insecta) in agriculture and forest systems. Revista Brasileira de Ciência do Solo 41: 1-15.), as well as unquestionable usefulness as indicators, usually easy to collect in the field and identify (Baretta et al., 2014Baretta, D.; Bartz, M.L.C.; Fachini, I.; Anselmi, R.; Zortéa, T.; Maluche-Baretta, C.R.D. 2014. Soil fauna and its relation with environmental variables in soil management systems. Revista Ciência Agronômica 45: 871-879.; Choudhary et al., 2018Choudhary, M.; Datta, A.; Jat, H.S.; Yadav, A.K.; Gathala, M.K.; Sapkota, T.B.; Sharma, P.C.; Jat, M.L.; Singh, R.; Ladha, J.K. 2018. Changes in soil biology under conservation agriculture based on sustainable intensification of cereal systems in the Indo-Gangetic Plains. Geoderma 313: 193-204.; Favero et al., 2011Favero, S.; Souza, H.A.; Oliveira, A.K.M. 2011. Coleoptera (Insecta) as forest fragmentation indicators in the Rio Negro sub-region of the Pantanal, Mato Grosso do Sul, Brazil. Brazilian Journal of Biology 71: 291-295.).
Furthermore, despite the increasing demand for biological assessments of soil quality (Krüger et al., 2018Krüger, I.; Chartin, C.; Van Wesemael, B.; Carnol, M. 2018. Defining a reference system for biological indicators of agricultural soil quality in Wallonia, Belgium. Ecological Indicators 95: 568-578.), there is little or no information so far on the relationship between soil biology and soybean productivity, especially relating to edaphic fauna.
Thus, we formulated the following hypotheses: a) edaphic fauna (abundance and diversity) is related to soybean productivity and b) high productivity is linked to a more diverse soil fauna; and c) chemical and physical soil properties can act as drivers of the diversity effects. The study aimed to evaluate the relationship of edaphic fauna under a no-tillage system with different levels of soybean productivity [High (NTH), Medium (NTM) and Low (NTL)] in the west of Santa Catarina (Brazil), determine which chemicals and physical variables most affect them, and identify the best indicators that can be used.
Materials and Methods
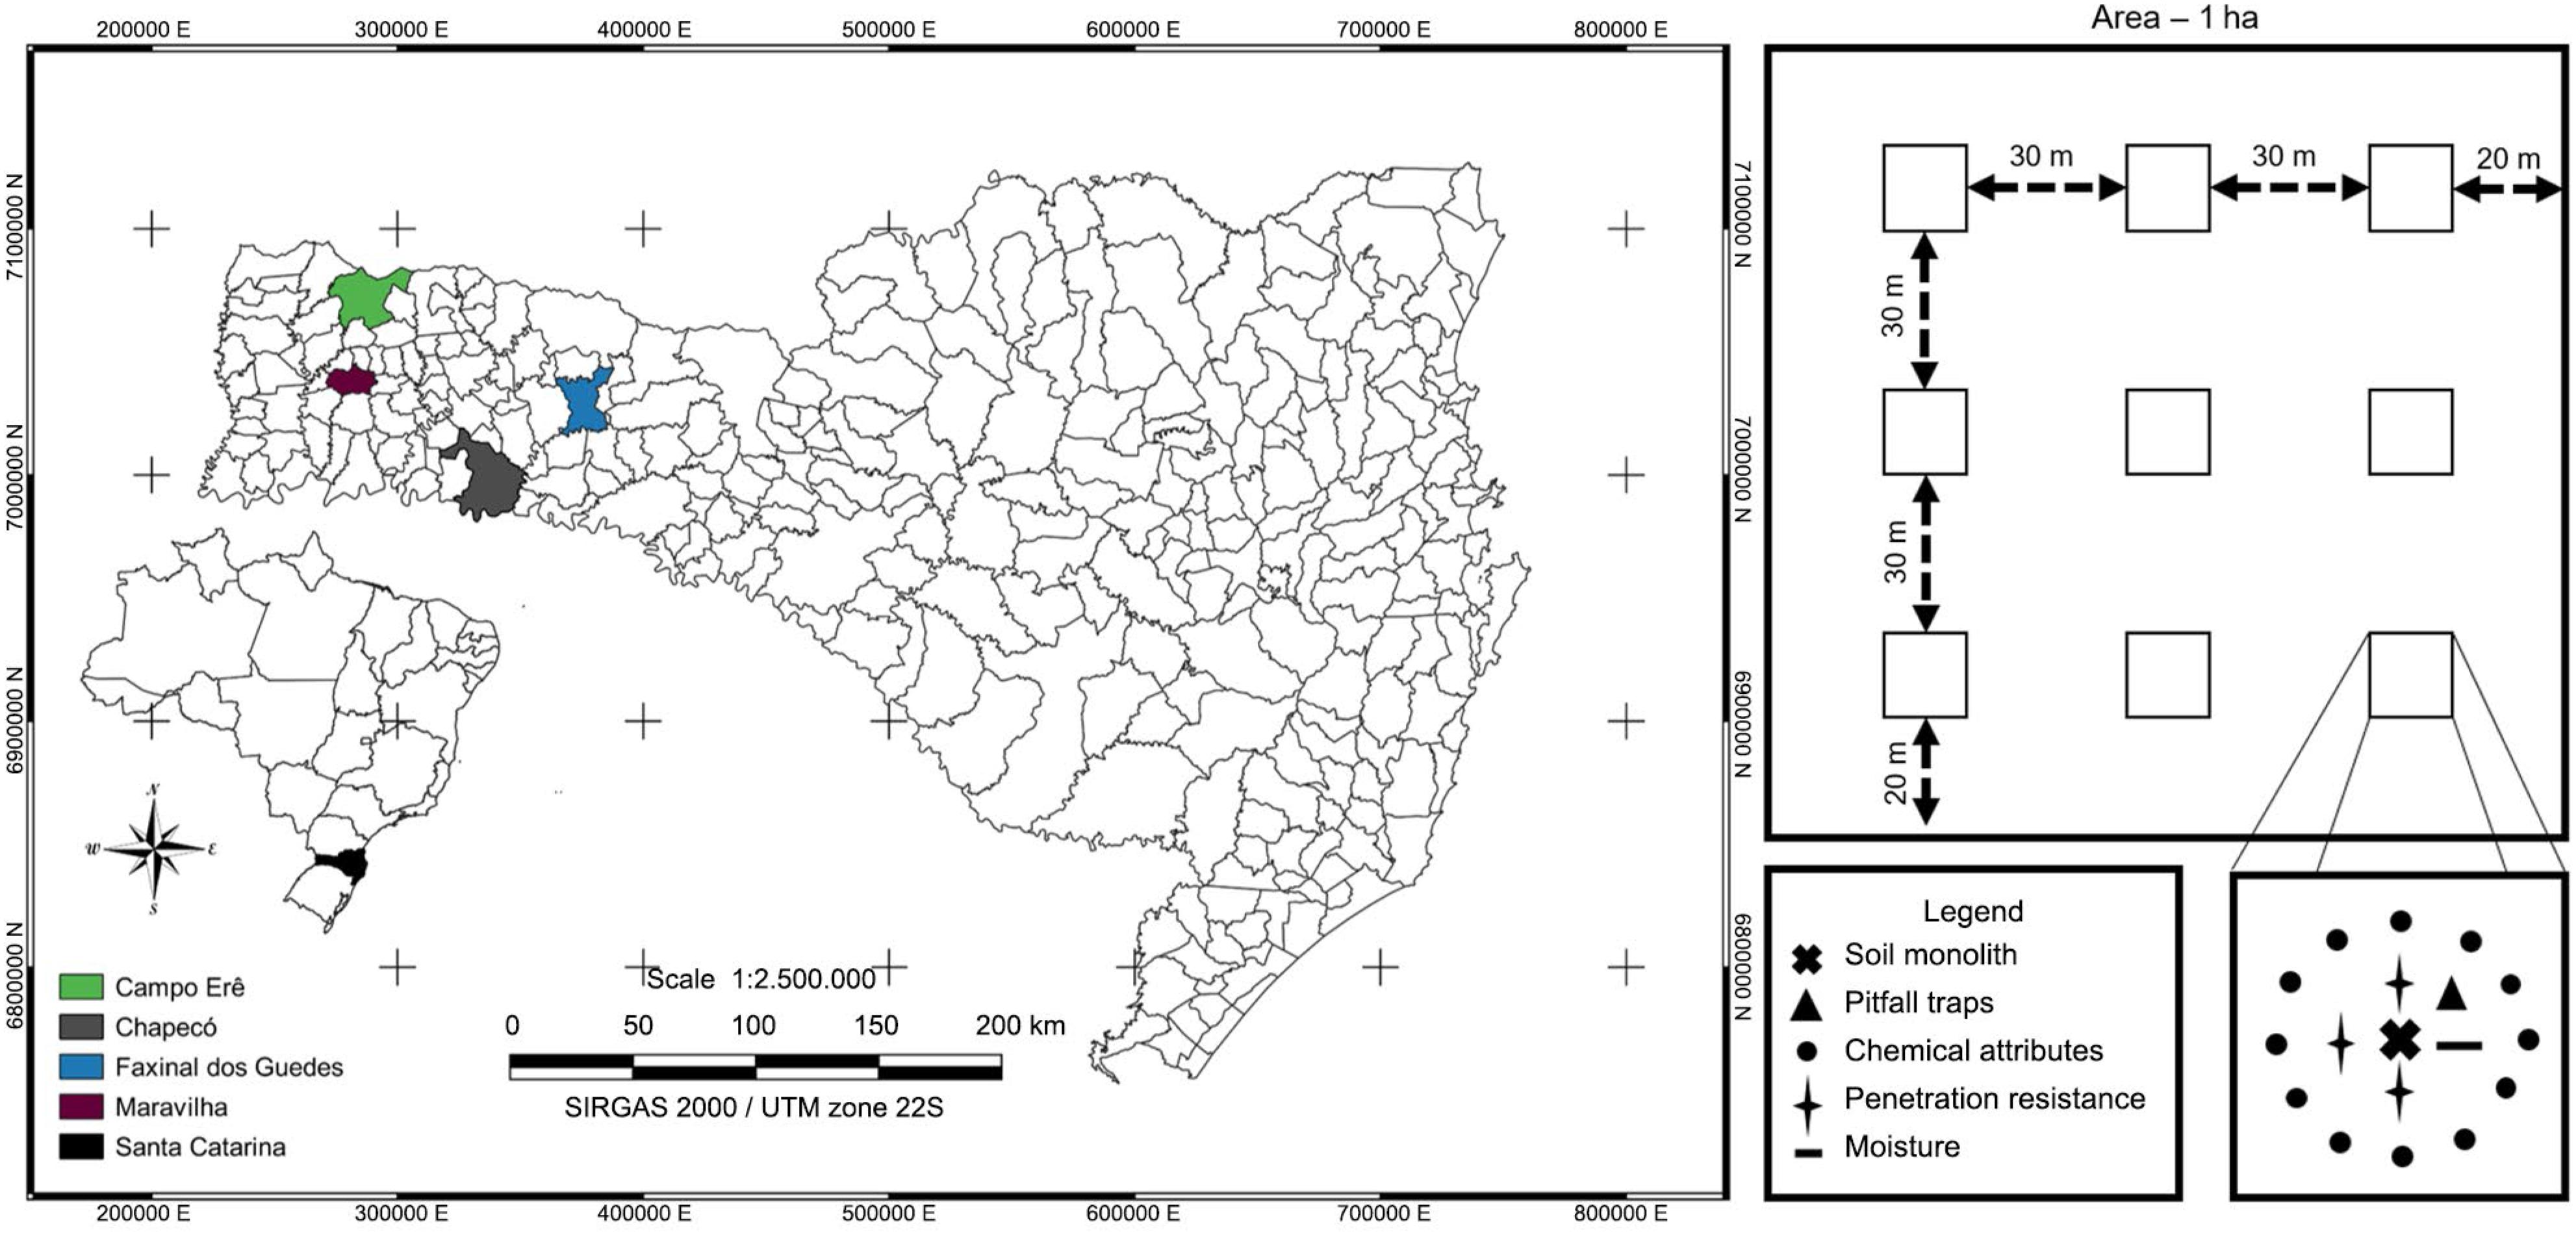
The study was conducted in the western region of Santa Catarina, in the municipalities of Chapecó (27°4’51.74” S; 52°41’3.07” W; 637 m a.s.l), Campo Êre (26º22’26.26” S; 53º08’37.93” W; 924 m a.s.l), Faxinal dos Guedes (26º47’14,36” S; 52º14’56.23” W; 859 m a.s.l) and Maravilha (26°44’2.11” S; 53°6’54.13” W; 623 m a.s.l), during the agricultural years of 2016/2017 and 2017/2018, except for the city of Maravilha in the agricultural year of 2017/2018. The sites sampled are characterized by no-tillage (NT) with more than sixteen years of implementation since, within each municipality (true replicate), the authors prioritized the choice of areas with the same crop management (planting time, fertilization and pest and disease management) to avoid interferences in analyses that could originate from other areas, in addition to those variables intrinsic to each point evaluated (chemical and physical - more information can be see in Table 1). Samplings were also carried out in two areas of Native Forest (NF) near NT areas (less than three km apart), one located in the city of Chapecó and the other in Faxinal dos Guedes, each representing Cfa (humid temperate climate with hot summer) and Cfb (humid temperate climate with temperate summer) climates, respectively (Alvares et al., 2014Alvares, C.A.; Stape, J.L.; Sentelhas, P.C.; Gonçalves, J.L.M.; Sparovek, G. 2014. Köppen's climate classification map for Brazil. Meteorologische Zeitschrift 22: 711-728.). The NF systems were used as reference for the biological data, since they are balanced systems, with great diversity of plants that were stable and without anthropic intervention (Pompeo et al., 2016Pompeo, P.N.; Santos, M.A.B.; Biasi, J.P.; Siqueira, S.F.; Rosa, M.G.; Baretta, C.R.D. M.; Baretta, D. 2016. Fauna and its relation to edaphic attributes in Lages, Santa Catarina–Brazil. Scientia Agraria 17: 42-51 (in Portuguese, with abstract in English).; Pompeo et al., 2017Pompeo, P.N.; Oliveira Filho, L.C.I.; Santos, M.A.B.; Mafra, A.L.; Klauberg Filho, O.; Baretta, D. 2017. Morphological diversity of Coleoptera (Arthropoda: Insecta) in agriculture and forest systems. Revista Brasileira de Ciência do Solo 41: 1-15.).
Fertilization and pesticides used to control invasive plants, pests and diseases to soybean crop of the areas sampled in the cities of Maravilha, Campo Êre, Chapecó and Faxinal dos Guedes under No-Tillage Systems with High (NTH), Medium (NTM) and Low (NTL) soybean productivity.
We selected NT with different levels of productivity, in a gradient of High (NTH, > 3,600 kg ha−1), Medium (NTM, between 3,600 and 2,400 kg ha−1), and Low (NTL, < 2,400 kg ha−1) productivity of soybean (Glycine max L.), in each municipality selected. The selection took into account the average productivity for the state of Santa Catarina in the 2015/2016 harvest according to the National Supply Company (3,341 kg ha−1), and their reports of researchers and agronomists linked to rural extension who know the region. For the years evaluated, the average soybean found ranged from 1,701 kg ha−1 in the areas of NTH productivity up to 8,101 kg ha−1 for the NTL productivity areas.
The edaphic fauna samples were collected at the beginning of the reproductive stage of the soybean life-cycle (phenological stage - R2), which coincides with the months of Dec and Jan, adopting the soil monolith and pitfall trap methods. A sampling grid of 3 × 3 points was used, at a distance of 30 m from each other and 20 m from the edge, and a total area of 1 ha, in each having an NT with different levels of productivity (NTH, NTM and NTL) and in the NF, totaling 207 points sampled during the two years of evaluation (Figure 1).
Location of the cities selected for the samplings on the left: Chapecó, Campo Êre, Faxinal do Guedes, and Maravilha, and a schematic representation of the sample collection to determine soil attributes on the right.
The edaphic fauna was sampled by soil monoliths (Anderson and Ingram, 1993Anderson, J.M.; Ingram, J.S.I. 1993. Tropical Soil Biology and Fertility: A Handbook of Methods. 2ed. CAB International, Wallingford, UK.) and pitfall traps (Baretta et al., 2014Baretta, D.; Bartz, M.L.C.; Fachini, I.; Anselmi, R.; Zortéa, T.; Maluche-Baretta, C.R.D. 2014. Soil fauna and its relation with environmental variables in soil management systems. Revista Ciência Agronômica 45: 871-879.). A soil monolith (25 × 25 cm) was excavated to a depth of 10 cm, and the organisms were screened manually, with the aid of artificial lighting. The pitfall traps consisted of cylindrical containers with an opening of 8 cm in diameter, with a volume capacity of 500 mL, containing 200 mL of detergent solution at 0.5 % (v/v) and buried with the open end leveled with the surface of the soil for 72 consecutive h. The fauna of the traps was triaged with the aid of two overlapping sieves, with mesh size of 2 mm and 0.053 mm under running water, respectively.
All organisms found were maintained in 70 % alcohol, with the exception of earthworms, which were kept in 92.8 % alcohol. Subsequently, the organisms of the edaphic fauna were identified at the taxonomic level of Class/Subclass/Order/Epifamily (Ruggiero et al., 2015Ruggiero, M.A.; Gordon, D.P.; Orrell, T.M.; Bailly, N. Bourgoin, T.; Brusca, R.C.; Cavalier-Smith, T.; Guiry, M.D.; Kirk, P.M. 2015. A higher level classification of all living organisms. Plos One 10: e0130114.) using a stereoscopic microscope (40x magnification), quantified and deposited in absolute alcohol. The soil was sampled for chemical analysis around the fauna collection points, using a Dutch auger to collect 12 subsamples from the 0.00 – 0.10 m layer, which were homogenized to form a composite sample. The chemical attributes were analyzed according to Tedesco et al. (1995)Tedesco, M.J.; Gianello, C.; Bissani, C.A.; Bohnen, H.; Wolkweiss, S.J. 1995. Soil, Plant and Other Material Analysis = Análises de Solo, Plantas e Outros Materiais. UFRGS, Porto Alegre, RS, Brazil (in Portuguese).. Resistance to penetration and soil moisture were evaluated at the time of sampling using a digital penetrometer and a portable apparatus, respectively (Table 2).
Chemical and physical characteristics of the areas sampled in the cities of Maravilha, Campo Êre, Chapecó and Faxinal dos Guedes, under No-Tillage Systems with High (NTH), Medium (NTM) and Low (NTL) soybean productivity, and Native Forest in Cfa and Cfb climates.
For the analyses, the points within each municipality were ranked by productivity and reclassified as NTH, NTM and NTL, thus forming a “range”. Reordering was necessary to better separate the most productive from the least productive points, which was only possible because the collections of all data were made for each point sampled. From these points the treatments were grouped and averaged, considering each treatment for each city a true replica of the evaluated system. Thus, three levels of productivity × four cities (3 × 4 = 12), in the 2016/2017 harvest and three productivity levels × three cities (3 × 3 = 9), in the 2017/2018 harvest, and two other areas of native forest were used as a balanced system reference.
The data of abundance [pitfall traps; individuals per trap (ind. trap−1)] and density [soil monoliths; individuals per square meter (ind. m−2)] of edaphic fauna were used to calculate the Shannon-Wiener diversity indices (H’) (H’ = − ∑pi ln pi, where pi is the proportion of individuals found in species i; for a well-sampled community, we can estimate this proportion as pi = ni/N, where ni is the number of individuals in species i and N the total number of individuals in the community), Pielou Equality (J) (J = H’/ln S, where S is the total number of species), Dominance (D) (D= − ∑(pi)2), Fisher Alpha (α) (S = a*ln(1+n/a)), where S is the number of taxa, n the number of individuals and a the Fisher's alpha), Margalef (Margalef's richness index = (S-1)/ln(n)) and Average richness, using the Past 3.0 statistical program, in order to verify how the no-tillage system with different productivities could affect the distribution of the edaphic fauna groups. Values for Average Richness, Average Abundance, Density, H’, J, D, α and Margalef were calculated point by point.
The data of Average Richness, Average Abundance, H’, J, D, α, and Margalef were submitted to analyses of normality and homogeneity, and then the means were compared by the Tukey test (p < 0.05) between agricultural systems. The Native Forest was used as a reference system and the agriculture systems diversity indices were compared by the Dunnett test (p < 0.05). The regression analyses were performed with linear and quadratic regression models charting the diversity indices of the fauna against soybean productivity using the Sigma Plot 10.0 program. The regressions showing the indices of edaphic fauna sampled by soil monoliths are presented, since the analyses for pitfall trap were not significant (p < 0.05).
Abundance values were subjected to detrended correspondence analysis (DCA), in order to determine the gradient length generated by the data matrix. As this length was < 3, with linear response, we decided to perform a principal component analysis (PCA). The fauna edaphic abundance was used as a response variable and soil chemical and physical properties as explanatory environmental variables in the PCA. The collinear and significant explanatory variables were identified by redundancy analysis (RDA), removing the variables with collinearity and maintaining the more significant ones. Only the last variables selected by RDA were later used in PCA as passive explanatory environmental variables for changes observed in fauna edaphic groups. Characteristics such as altitude, longitude and latitude were used as covariates in the analysis. All multivariate statistical analyses were conducted using the CANOCO statistical software package, version 4.5.
Results and Discussion
A total of 3,303 individuals were identified by soil monoliths and 59,515 by traps, making a total of 62,818 individuals, distributed over 25 taxonomic groups (Table 3). Of the total recorded, 19 groups were captured by soil monoliths and 23 by traps, with 17 groups sharing the two collection methods (Table 3).
Attributes of edaphic fauna sampled by soil monolith and pitfall trap methods in Native Forest (NF) and under No-Tillage Systems with High (NTH), Medium (NTM) and Low (NTL) productivity of soybean in the West of Santa Catarina (n = 21).
The number of edaphic fauna individuals sampled by soil monoliths, when converted to ind. m−2, had an average density of 364 ind. m−2. The maximum density was 624 ind. m−2, in NF, and the minimum was 144 ind. m−2, in NTL (Table 3). The results obtained with the edaphic fauna captured by pitfall traps did not differ between the systems evaluated. Topping and Sunderland (1992)Topping, C.J.; Sunderland, K.D. 1992. Limitations to the use of pitfall traps in ecological studies exemplified by a study of spiders in a field of winter wheat. Journal of Applied Ecology 29: 485-491. evaluated the limitation of the use of pitfall traps in the study of spiders and emphasized the low efficiency of this method for assessing abundance, as well as the capacity of certain edaphic fauna organisms to escape from this type of trap, as it is often not representative of the real diversity. The same authors also mention that, due to method limitations, environment, type of material, container diameter and others, almost 40 % of the work led to erroneous conclusions based on abundance.
The highest values of average density, total richness, average richness, H’ and Margalef indices of the edaphic fauna sampled by soil monoliths were obtained in the NF (Table 3). The purpose of using NF is to use it as a reference for the diversity indices found in no-tillage with different productivities, whether they are adequate or not, since the conversion of forest systems to agricultural systems causes disturbances in the edaphic organisms, leading to a reduction in biodiversity (Cardoso et al., 2013Cardoso, E.J.B.N.; Vasconcellos, R.L.F.; Bini, D.; Miyauchi, M.Y.H.; Santos, C.A.S.; Alves, P.R.L.; Paula, A.M; Nakatani, A.S.; Pereira, J.M.; Nogueira, M.A. 2013. Soil health: looking for suitable indicators. What should be considered to assess the effects of use and management on soil health? Scientia Agricola 70: 274-289.), which will find a new balance.
The Tukey test results showed a reduction in the H’, α, and Margalef diversity indices and average richness, for the soybean productivity gradient (NTH > NTM > NTL), and inverse behavior for the D index. The Dunnett test, using the forest as a reference, showed that, for the average richness and H’ index, the values in NTL were below those in NF, while for the Margalef and D index the NTM values also differed. In other words, we can state that high-productivity no-tillage systems have diversity indices similar to those found in preserved sites (NF) (Table 3).
The results found by Bartz et al. (2014)Bartz, M.L.C.; Brown, G.G.; Orso, R.; Mafra, A.L.; Baretta, D. 2014. The influence of land use systems on soil and surface litter fauna in the western region of Santa Catarina. Revista Ciência Agronômica 45: 880-887. evidenced greater edaphic fauna diversity under NF compared to NT. The authors obtained H’ values of 0.68 and 0.49 under NF and NT, respectively, for edaphic fauna captured by soil traps in the summer. However, the work conducted by Almeida et al. (2017)Almeida. H.S.; Silva, R.F.; Grolli, A.L.; Scheid, D.L. 2017. Occurrence and diversity of soil fauna under different land use systems = Ocorrência e diversidade da fauna edáfica sob diferentes sistemas de uso do solo. Revista Brasileira de Tecnologia Agropecuária 1: 15-23 (in Portuguese). found no differences under NT soybean cultivation for 20 years and NF for the indices of J, D, H’ and Margalef.
The D index was higher in NTL. The dominance of one or another group of edaphic fauna is not positive and may compromise ecosystem service functions, as shown by Dangles and Malmqvist (2004)Dangles, O.; Malmqvist, B. 2004. Species richness–decomposition relationships depend on species dominance. Ecology Letters 7: 395-402., who found significant reduction in waste decomposition when there was dominance of few groups of edaphic fauna. In addition, when in a situation of stress, community restructuring is usually perpetrated by opportunistic groups with rapid population growth and most often shorter life cycles (Rapport et al., 1985Rapport, D.J; Regier, H.A.; Hutchinson, T.C. 1985. Ecosystem behavior under stress. The American Naturalist 125: 617-640.). The greatest dominance in NTL is by Coleoptera in TSBF sampling (Table 3) and, although it is a very diverse group, this dominance may be related to phytophagous individuals.
The D index is a complement of the equability index, which indicates that when its value is high, there is greater dominance in the edaphic community (Somerfield et al., 2008Somerfield, P.J.; Clarke, K.R.; Warwick, R.M. 2008. Simpson index. Encyclopedia of Ecology. Elsevier, Oxford, UK. https://doi.org/10.1016/B978-008045405-4.00133-6
https://doi.org/10.1016/B978-008045405-4...
), i.e., greater D means predominance of few edaphic groups in a given edaphic community. A number of studies have found that sites with high dominance of a single species can significantly reduce the development of grasses (Chauvel et al., 1999Chauvel, A.; Grimaldi, M.; Barros, E.; Blanchart, E.; Desjardins, T.; Sarrazin, M.; Lavelle, P. 1999. Pasture damage by an Amazonian earthworm. Nature 4: 32-33.). Similarly, a microcosm study revealed that the removal of a single species of Enchytraeidae caused a reduction in the primary production of plants (Laakso and Setälä, 1999Laakso, J.; Setälä, H. 1999. Sensitivity of primary production to changes in the architecture of belowground food webs. Oikos 87: 57-64.).
The diversity of groups can be affected by several factors such as soil moisture, temperature, plant cover, food supply, among others. This increase in the diversity of edaphic fauna may have different relationships with the benefits provided by the organisms in the soil functions (Birkhofer et al., 2015Birkhofer, K.; Smith, H.G.; Weisser, W.W.; Wolters, V.; Gossner, M.M. 2015. Land-use effects on the functional distinctness of arthropod communities. Ecography 38: 1-12.), allowing for a linear relationship between increased diversity and soybean productivity. The increase in the diversity of organisms (microorganisms and edaphic fauna) can promote the increase in nutrient cycling, organic matter decomposition, galleries, and soil structuring, consequently affecting the increase in crop productivity (Bender and Van Der Heijden, 2015Bender, S.F.; Van Der Heijden, M.G.A. 2015. Soil biota enhance agricultural sustainability by improving crop productivity, nutrient uptake and reducing nitrogen leaching losses. Journal of Applied Ecology 52: 228-239.). Despite the lack of clarity about which mechanism prevailed, it was evident that the increase in diversity of the edaphic fauna sampled by soil monoliths is accompanied by increases in soybean productivity under the no-tillage system.
The J index is derived from the H’ diversity index, which allows for representing the uniformity of the distribution of the individuals among the existing species (Pielou, 1966Pielou, E.C. 1966. The measurement of diversity in different types of biological collections. Journal of Theoretical Biology 13: 131-144.), so the higher the values obtained, the better the distribution of the edaphic fauna between groups. However, differences between the evaluated systems were not observed for any of the edaphic fauna sampling methods. Results found by Bartz et al. (2014)Bartz, M.L.C.; Brown, G.G.; Orso, R.; Mafra, A.L.; Baretta, D. 2014. The influence of land use systems on soil and surface litter fauna in the western region of Santa Catarina. Revista Ciência Agronômica 45: 880-887. showed higher values in NF (J = 0.55) than in NT (J = 0.49) for the fauna captured by pitfall traps.
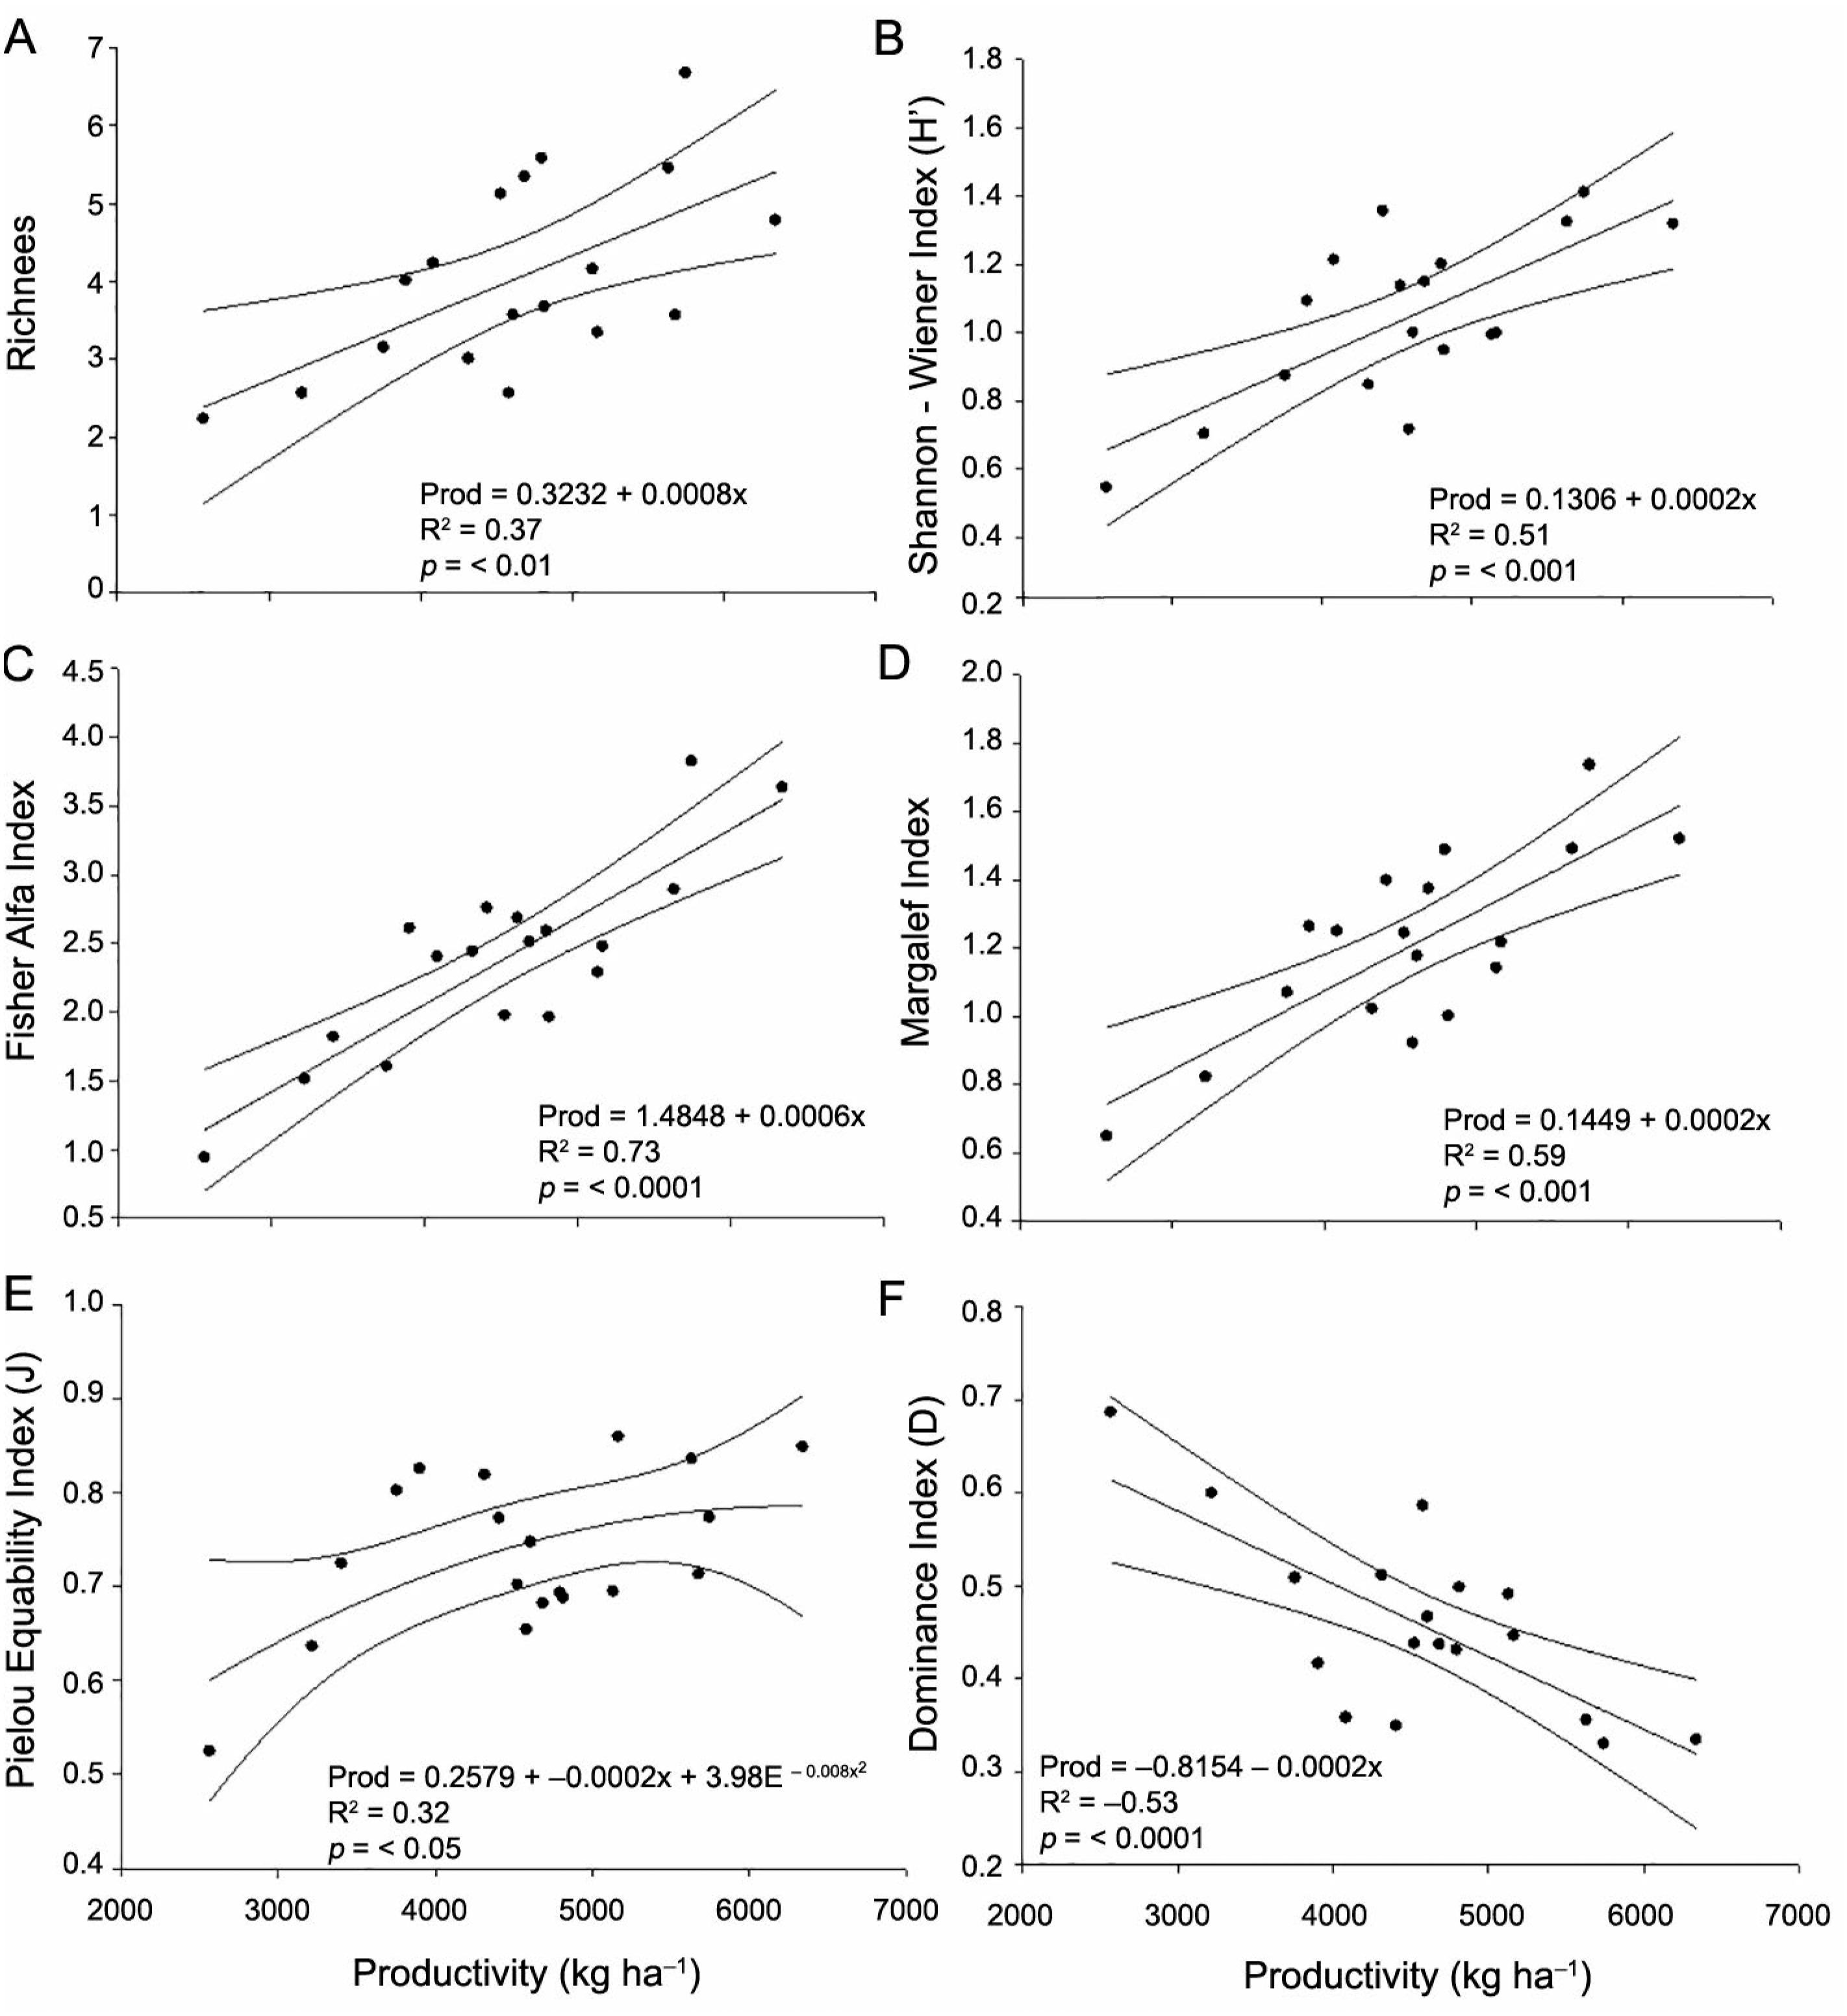
The α and Margalef indices followed the same trend as the H’ index. However, these indices have some differences in the form of calculation. The α index, in general, has presented advantages over other commonly used diversity indices, as it has a higher discriminatory capacity, less influenced by the number of samplings and less influenced by the density of more common species in comparison to the H’ and D indices (Schulte et al., 2005Schulte, R.P.O.; Lantinga, E.A.; Hawkins, M.J. 2005. A new family of Fisher-curves estimates Fisher's alpha more accurately. Journal of Theoretical Biology 232: 305-313.). The Margalef index has shown better results compared to H’ and D since it includes a measure of similarity, showing greater sensitivity to environmental changes (Iglesias-Rios and Mazzoni, 2014Iglesias-Rios, R.; Mazzoni, R. 2014. Measuring diversity: looking for processes that generate diversity. Natureza & Conservação 12: 156-161.). The higher sensitivity of these indices is also evident in the regression analysis (Figure 2).
Regression between richness (A), Shannon-Wiener diversity (B), Fisher's alpha (C), Margalef (D), Pielou Equability (E) and Dominance (F) indices of edaphic fauna sampled by soil monoliths and soybean Productivity (Prod) under a No-Tillage System in the west of Santa Catarina (n = 21).
The linear regression analysis showed positive correlation between the richness of groups (R2 = 0.37, p < 0.01) (Figure 2A), H’ (R2 = 0.51, p < 0.001) (Figure 2B), α (R2 = 0.73, p < 0.0001) (Figure 2C), and Margalef (R2 = 0.59, p < 0.001) (Figure 2D) and soybean productivity as well as a quadratic correlation between J (R2 = 0.32, p < 0.05) (Figure 2E) and soybean productivity in NT. However, there was negative linear correlation between the D index (R2 = –0.53, p < 0.01) and soybean productivity in NT (Figure 2F).
The analysis shows strong correlation between the diversity indices and the productivity of the soybean crop, considering the wide variability of edaphic fauna data. Evaluating the effects of no-tillage with corn mulch on soil macrofauna in northeastern China, Jiang et al. (2018)Jiang, Y.; Ma, N.; Chen, Z.; Xie, H. 2018. Soil macrofauna assemblage composition and functional groups in no-tillage with corn stover mulch agroecosystems in a mollisol area of northeastern China. Applied Soil Ecology 128: 61-70. found values of R2 = 0.45 (p < 0.05) and R2 = 0.53 (p < 0.01) between the abundance of the general fauna, abundance of decomposers and the rate of soil cover, respectively. However, these authors found an R2 = 0.05 (p > 0.36) between edaphic fauna richness and soil cover rate. Despite the low R2 for diversity, the authors reinforce the importance of edaphic fauna abundance and diversity for the maintenance of productivity, when there is low input and in conservation systems.
The J index, unlike other diversity indices, showed quadratic behavior, proving to be less sensitive for discriminating increases in soybean productivity. Increases in the diversity of the edaphic fauna, represented by the H’ index, promoted increases in soybean productivity. On the other hand, an increase in the D index led to a reduction in crop productivity due to the dominance of a few groups. Dominance is detrimental to soybean productivity, since the few groups that remain do not either replace nor perform the same functions as the high diversity of edaphic fauna groups.
The α index had the best response among the indices evaluated, with a lower dispersion of the data in relation to the trend line (Figure 2C), followed by the Margalef index (Figure 2D). Although these indices are less usual than the traditional H’, D and J, in the present study they showed low variability in the data with potential for application to practical work when evaluating soybean productivity.
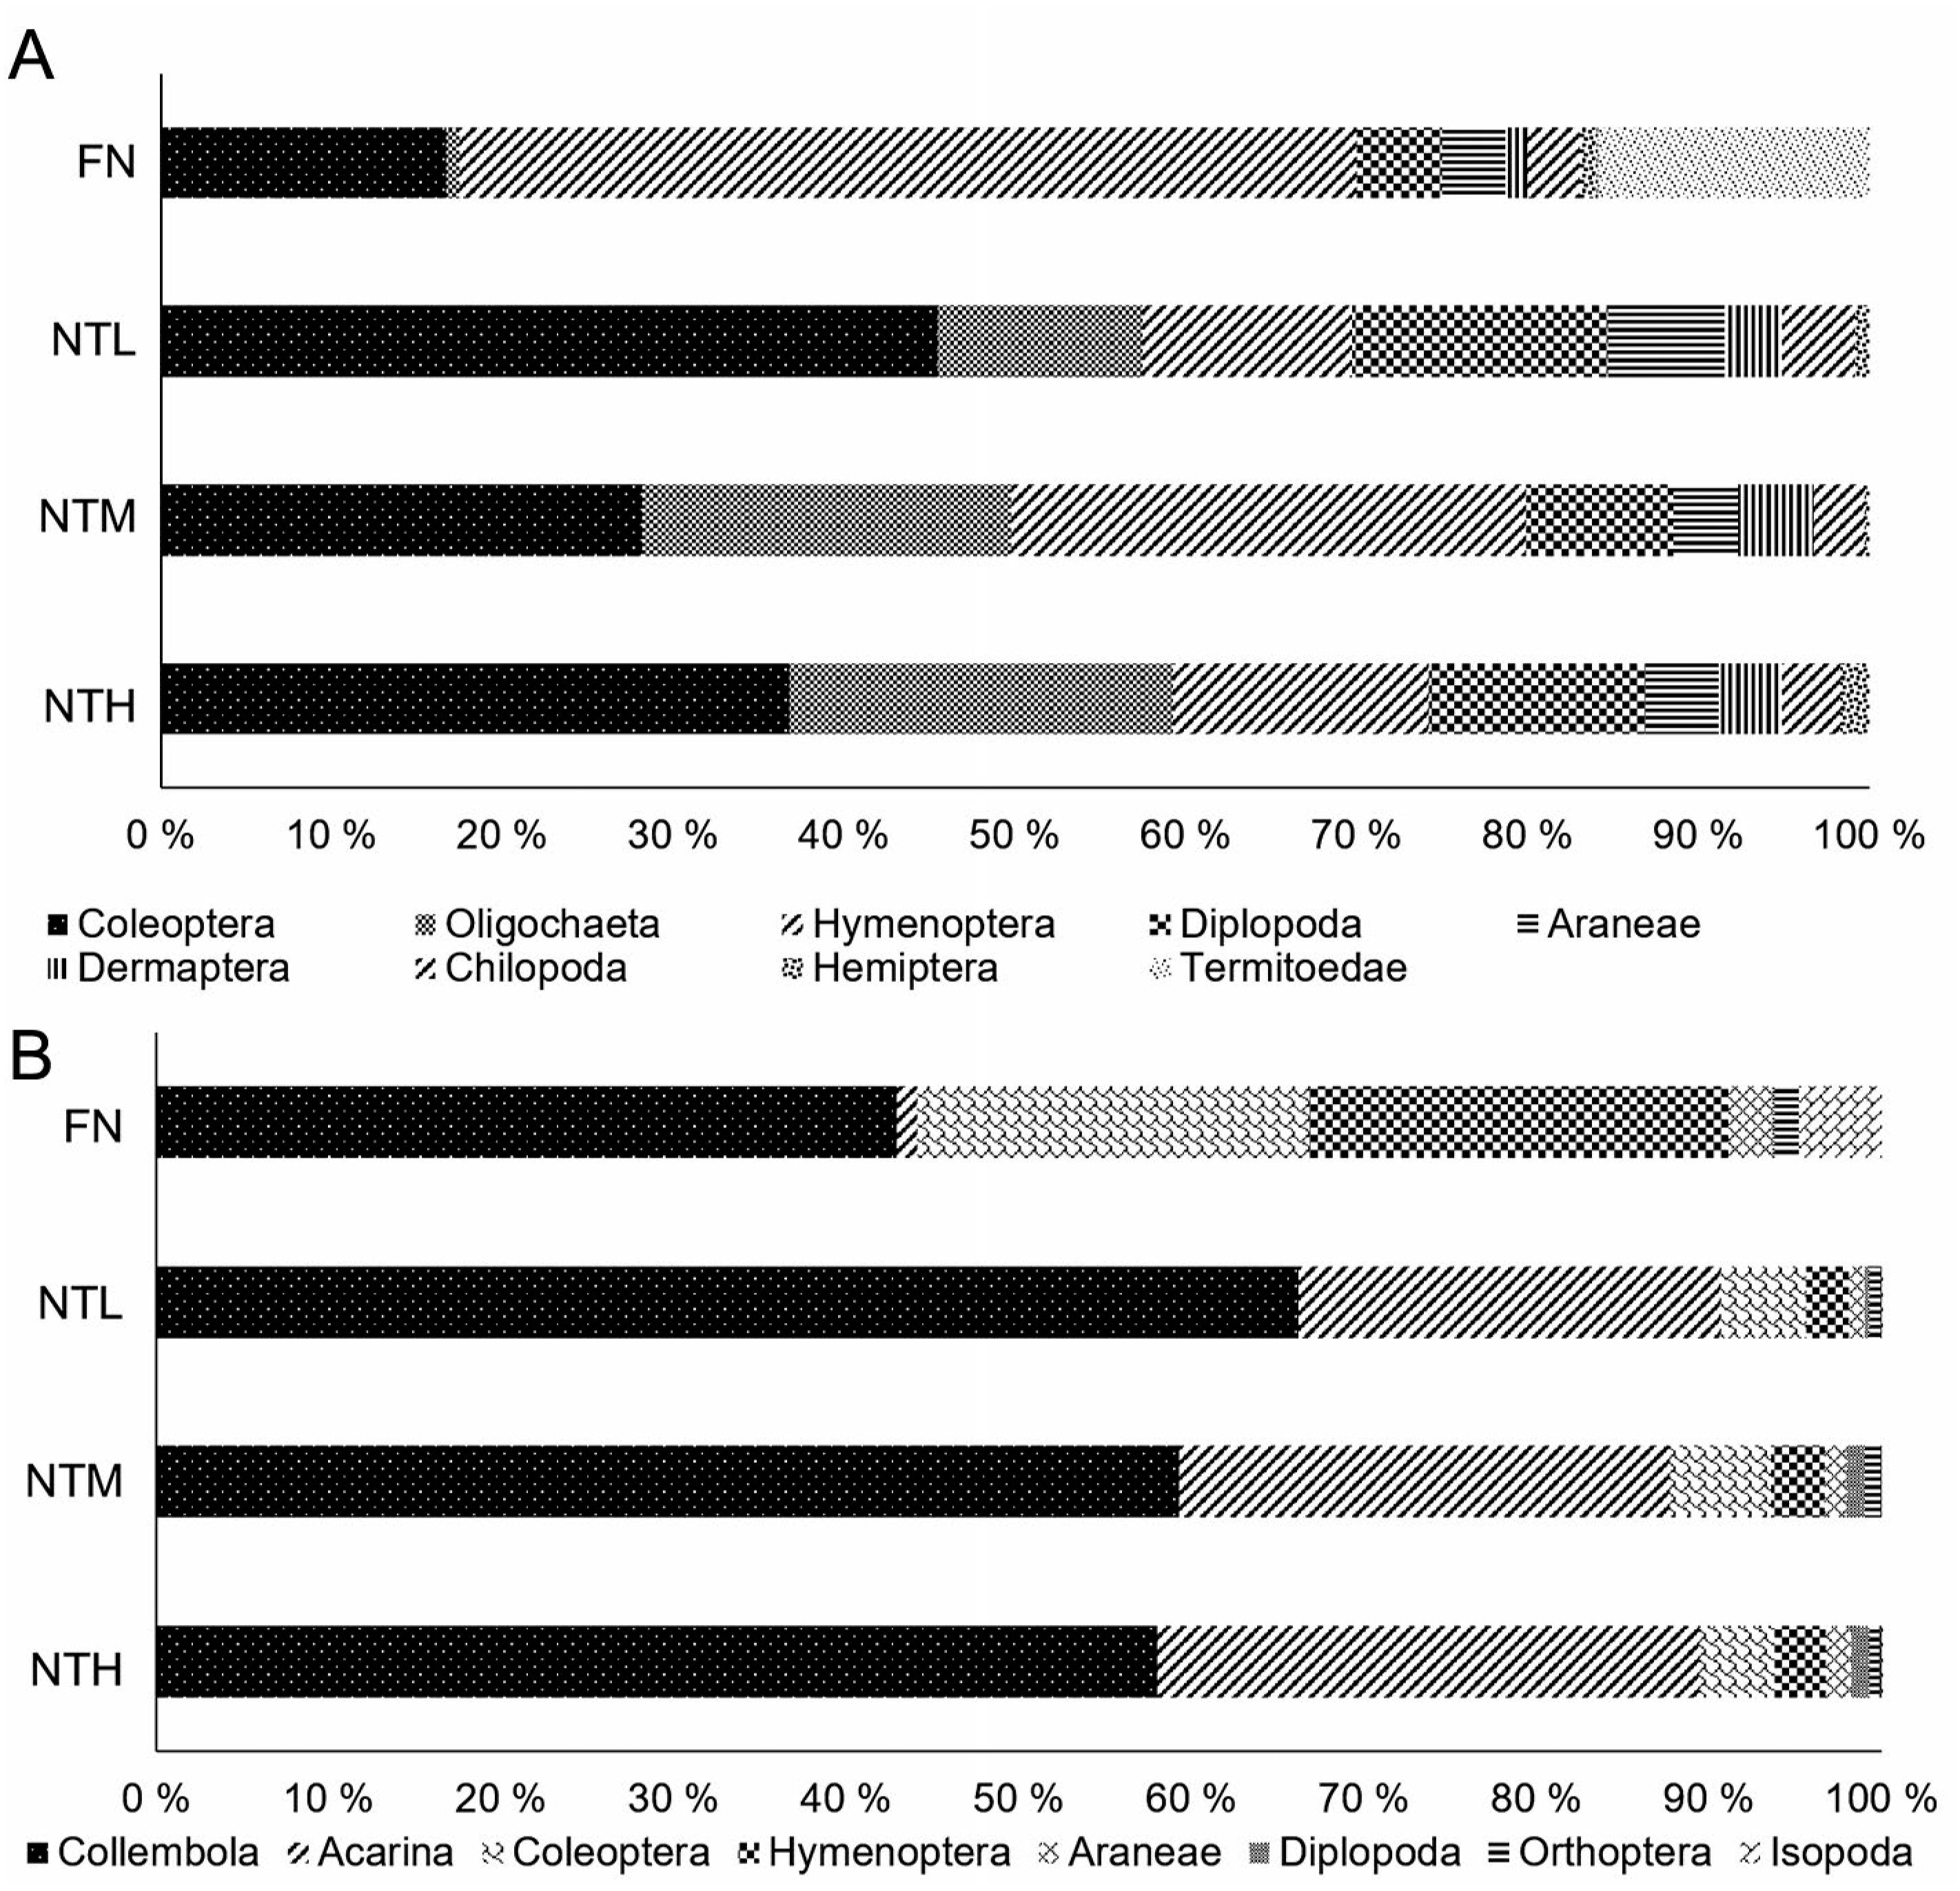
The relative frequency of the edaphic fauna was affected by the different systems evaluated. For the edaphic fauna sampled by soil monoliths, the Coleoptera group was the most representative among the agricultural systems, followed by Oligochaeta and Hymenoptera, representing together approximately 70 % of the organisms captured. In areas of NF, the Hymenoptera group stands out registering approximately 50 % of the relative frequency (Figure 3A). For the edaphic fauna sampled by pitfall traps in NT, the Collembola and Acari groups represent 90 % of the frequency; however, in NF the most frequent groups were Collembola, Coleoptera and Hymenoptera (Figure 3B).
Relative frequency of the edaphic fauna groups sampled by soil monoliths (A) and pitfall traps (B) in Native Forest (NF) under a No-Tillage System with High (NTH), Medium (NTM) and Low (NTL) productivity of soybean in the west of Santa Catarina (n = 21).
Among the edaphic groups, the beetles (Coleoptera) stand out, showing different behavior between the collection methods. In the capture by soil monoliths it was more abundant in NT compared to NF, whereas for pitfall traps this relationship was inverted, found with higher frequency in NF (Figure 3). This may have occurred because coleopterans have different adaptations in terms of soil life, being able to live on the surface (epigeic), in direct contact with the soil (edaphic), or in intermediate form (hemiedaphic) (Parisi et al., 2005Parisi, V.; Menta, C.; Gardi, C.; Jacomini, C.; Mozzanica, E. 2005. Microarthropod communities as a tool to assess soil quality and biodiversity: a new approach in Italy. Agriculture, Ecosystems & Environment 105: 323-333.; Pompeo et al., 2017Pompeo, P.N.; Oliveira Filho, L.C.I.; Santos, M.A.B.; Mafra, A.L.; Klauberg Filho, O.; Baretta, D. 2017. Morphological diversity of Coleoptera (Arthropoda: Insecta) in agriculture and forest systems. Revista Brasileira de Ciência do Solo 41: 1-15.), so the methods may differ in the capture of the organisms within this order. Within this group, there are families that perform important ecosystem services, as they perform excavation and subsequent incorporation and accumulation of organic matter in the soil at different depths, being important indicators of soil quality (Pompeo et al., 2017Pompeo, P.N.; Oliveira Filho, L.C.I.; Santos, M.A.B.; Mafra, A.L.; Klauberg Filho, O.; Baretta, D. 2017. Morphological diversity of Coleoptera (Arthropoda: Insecta) in agriculture and forest systems. Revista Brasileira de Ciência do Solo 41: 1-15.).
Another very important group, the ants (Hymenoptera), was mainly distinguished in NF (Figure 3A), by its intrinsic characteristics. These ecosystem engineers work on particle redistribution, creation of galleries, improved water infiltration, nutrient cycling and organic matter (Nakamura et al., 2007Nakamura, A.; Catterall, C.P.; House, A.P.N.; Kitching, R.L.; Burwell, C.J. 2007. The use of ants and other soil and litter arthropods as bio-indicators of the impacts of rainforest clearing and subsequent land use. Journal of Insect Conservation 11: 177-186.). However, advances in the identification of family, genus or species can be an important tool in view of the wide range of eating habits, and certain species are found only in more conserved environments with greater plant biodiversity (Roeder and Roeder, 2016Roeder, K.A.; Roeder, D. 2016. A checklist and assemblage comparison of ants (Hymenoptera: Formicidae) from the Wichita Mountains Wildlife Refuge in Oklahoma. Check List 12: 1-15.), which may justify the greater predominance of this group in NF.
Among the most relevant edaphic groups in the literature captured by soil monoliths (Figure 3A), we highlight earthworms (Oligochaeta), which favor crop development, through increases in the rate of infiltration and flow of gas exchanges and water in the soil, as well as increasing soil aggregate stability (Van Groenigen et al., 2014Van Groenigen, J.W.; Lubbers, I.M.; Vos, H.M.J.; Brown, G.G.; Deyn, G.B.; Van Groenigen, K.J. 2014. Earthworms increase plant production: a meta-analysis. Scientific Reports 4: 1-7.; D’Hose et al., 2018D’Hose, T.; Molendijk, L.; Berg, W.V.D.; Hoek, H.; Runia, W.; Evert, F.V.; Berge, H.T.; Spiegel, H.; Sandèn, T.; Grignani, C.; Ruysschaert, G. 2018. Responses of soil biota to non-inversion tillage and organic amendments: an analysis on European multiyear field experiments. Pedobiologia 66: 18-28.). Van Groenigen et al. (2014)Van Groenigen, J.W.; Lubbers, I.M.; Vos, H.M.J.; Brown, G.G.; Deyn, G.B.; Van Groenigen, K.J. 2014. Earthworms increase plant production: a meta-analysis. Scientific Reports 4: 1-7., conducting a meta-analysis between earthworms and increases in crop productivity, collecting data from 462 works from 58 studies worldwide, found a positive effect of the presence of earthworms, increasing crop productivity by 25 %. To classify soils as productive, these same authors attribute the value of 400 worms per m2, above the values found in NTH. However, the higher proportion of earthworms found in NTH compared to NTM and NTL may also contribute to increased productivity.
Among the edaphic mesofauna, springtails (Collembola) are sensitive individuals, which help to monitor changes in soil quality by expressing the environmental variations rapidly. These organisms feed on fungal hyphae and plant remains, and are considered primary consumers in the decomposition group (Čuchta et al., 2019Čuchta, P.; Kaňa, J.; Pouska, V. 2019. An important role of decomposing wood for soil environment with a reference to communities of springtails (Collembola). Environmental Monitoring and Assessment 191: 222.). Thus, they are an important indicator of soil quality.
Although highly beneficial, NTL is where the highest proportion of these organisms is found (Figure 3). The result is an imbalanced environment, which has smaller proportions of other organisms of the edaphic fauna that carry out equally important activities such as predation, formation of galleries and fragmentation. A number of authors suggest that high values for the Acarina/Collembola ratio result in high soil quality, since it has been established that in degraded soils the number of Acarina species decreases. This relationship is clear in the relative frequency plot (Figure 3), with the highest ratio in NTH compared to that in NTL (Santorufo et al., 2012Santorufo, L.; Van Gestel, C.A.M.; Rocco, A.; Maisto, G. 2012. Soil invertebrates the bioindicators of urban soil quality. Environmental Pollution 161: 57-63.).
Edaphic mites (Acarina) together with springtails are the most abundant soil organisms, especially in no-till systems (Figure 3B). Bartz et al. (2014)Bartz, M.L.C.; Brown, G.G.; Orso, R.; Mafra, A.L.; Baretta, D. 2014. The influence of land use systems on soil and surface litter fauna in the western region of Santa Catarina. Revista Ciência Agronômica 45: 880-887. found that these organisms were more common in the no-till and less common in NF. This group, in turn, responds more slowly to changes in the soil when compared to the springtails and are considered K-strategists (Walter and Proctor, 2013Walter, D.E.; Proctor, H. 2013. Mites: Ecology, Evolution & Behavior. 2ed. Springer, New York, NY, USA.). In this group, there is a large fraction of predators, which can play an important role in the soil ecosystem. Among the predators, different trophic groups can be distinguished: omnivores, parasites, general predators, microarthropod predators, and nematode predators, which indirectly provide benefits for plants (Postma-Blaauw et al., 2010Postma-Blaauw, M.B.; Goede, R.G.M.; Bloem, J.; Faber, J.H.; Brussaard, L. 2010. Soil biota community structure and abundance under agricultural intensification and extensification. Ecology 91: 460-473.). Thus, the greater proportion of mites in NTH compared to NTL may indicate more balanced production systems and more food supply. Predators are at the top of the food chain and the absence of this kind of work makes the comparison with other databases difficult, demonstrating that a large field of research remains unexplored.
The principal component analysis for fauna collected by soil monoliths and pitfall traps (Figure 4A and 4B, respectively) demonstrated separation of the systems evaluated. For fauna sampled by soil monoliths (Figure 4A), PC1 and PC2 explained 41 % and 17 % of the data variability, respectively. The analysis shows that the NTH treatment differed from NTM and NTL, with greater richness of groups associated with the most productive system (NTH), positively affected by K contents.
Principal Component Analysis (PCA) of the edaphic fauna groups sampled by soil monoliths (A) and pitfall traps (B) in Native Forest (NF) and No-Tillage System with High (NTH), Medium (NTM) and Low (NTL) productivity of soybean in the West of Santa Catarina. Ara = Araneae; Aca = Acarina; Col = Coleoptera; Coll = Collembola; Ort = Orthoptera; Chi = Chilopoda; Oli = Oligochaeta (earthworm); Opi = Opiliones; Der = Dermaptera; Dip = Diplopoda; Dipl = Diplura; Gas = Gastropoda; Hem = Hemiptera; Thy = Thysanoptera; Sym = Symphyla; Bla = Blattodea; Sip = Siphonaptera; Isop = Isopoda; Hem = Hemiptera; Hym = Hymenoptera; Ter = Termitoidae; Tri = Trichoptera; Pse = Pseudoscorpionida; Pro = Protura; Tys = Thysanura; Out = Others; P = Phosphorus; OM = Organic Matter; Clay; K = Potassium; Al = Aluminum; PR0-10 = Penetration Resistance 0 to 10 cm. PC1 = Principal Component 1; PC2 = Principal Component 2.
The NF was separated from the agricultural systems, but together with the NTH system showed the largest group richness. However, it is noticed that the forest fragments have a community structure that cannot be compared with the agricultural systems, as observed in the strong weight that it caused in the PC1 of PCA. The edaphic groups present in NF were positively affected by the levels of organic matter (OM) and aluminum (Al), common characteristics of these sites.
The benefits provided by edaphic fauna are unquestionable in terms of life support services such as nutrient cycling, litter fragmentation and opening of galleries that favor the passage of water and air flows (Baretta et al., 2014Baretta, D.; Bartz, M.L.C.; Fachini, I.; Anselmi, R.; Zortéa, T.; Maluche-Baretta, C.R.D. 2014. Soil fauna and its relation with environmental variables in soil management systems. Revista Ciência Agronômica 45: 871-879.; Bender and Van Der Heijden, 2015Bender, S.F.; Van Der Heijden, M.G.A. 2015. Soil biota enhance agricultural sustainability by improving crop productivity, nutrient uptake and reducing nitrogen leaching losses. Journal of Applied Ecology 52: 228-239.; Jiang et al., 2018Jiang, Y.; Ma, N.; Chen, Z.; Xie, H. 2018. Soil macrofauna assemblage composition and functional groups in no-tillage with corn stover mulch agroecosystems in a mollisol area of northeastern China. Applied Soil Ecology 128: 61-70.). Thus, the greater richness of groups associated with NTH (Figure 4A) allows for greater diversification and maintenance of these services, which, in times of stress (anthropic or environmental), promote the maintenance of such soil functions (Bender et al., 2016Bender, S.F.; Wagg, C.; Van Der Heijden, M.G.A. 2016. An underground revolution: biodiversity and soil ecological engineering for agricultural sustainability. Trends in Ecology & Evolution 31: 440-452.). On the other hand, the lowest richness systems (NTL) are more susceptible to disturbances or less resilient, which result in impaired soil function.
In the edaphic fauna sampled by pitfall traps (Figure 4B), PC1 and PC2 explain 33 % and 19 % of the data variability, respectively. For the agricultural systems, the component analysis showed the separation of NTL from NTM and NTH, while NF separated from the agricultural systems. NTL relate more closely to the Araneae, Termitoidae, Thysanoptera and other groups, while in NTM and NTH, the most correlated groups were Oligochaeta, Chilopoda, Collembola, Trichoptera and Diplopoda. These groups were correlated with K and penetration resistance in the 0 – 10 cm layer. NF was correlated with less abundant groups compared to agricultural systems, again correlated by OM and Al contents.
Earthworms are commonly associated with changes in soil structure and increased nutrient availability (D’Hose et al., 2018D’Hose, T.; Molendijk, L.; Berg, W.V.D.; Hoek, H.; Runia, W.; Evert, F.V.; Berge, H.T.; Spiegel, H.; Sandèn, T.; Grignani, C.; Ruysschaert, G. 2018. Responses of soil biota to non-inversion tillage and organic amendments: an analysis on European multiyear field experiments. Pedobiologia 66: 18-28.; Van Groenigen et al. (2014)Van Groenigen, J.W.; Lubbers, I.M.; Vos, H.M.J.; Brown, G.G.; Deyn, G.B.; Van Groenigen, K.J. 2014. Earthworms increase plant production: a meta-analysis. Scientific Reports 4: 1-7.. The Diplopoda group associated with NTH is cited as shredders after earthworms, the largest litter shredders/consumers (Edwards, 1974Edwards, C.A. 1974. Macroarthropods. p. 533-554. In: Dickinson, C.H.; Pugh, G.J.F., eds. Biology of plant litter decomposition. Academic Press, New York, NY, USA.). Thus, the greater activity of these groups may favor increases in nutrient availability and improve soil structure, increasing soil water and air flows.
Increasing the OM content contributes to ecosystem sustainability and their effects on fauna groups are well known, favoring various edaphic groups such as coleoptera (Pompeo et al., 2016Pompeo, P.N.; Santos, M.A.B.; Biasi, J.P.; Siqueira, S.F.; Rosa, M.G.; Baretta, C.R.D. M.; Baretta, D. 2016. Fauna and its relation to edaphic attributes in Lages, Santa Catarina–Brazil. Scientia Agraria 17: 42-51 (in Portuguese, with abstract in English).), larvae of diptera (Courtney et al., 2017Courtney, G.W.; Pape, T.; Skevington, J.H.; Sinclair, B.J. 2017. Biodiversity of Diptera. p. 229-278. In: Foottit, R.G.; Adler, P.H., eds. Insect biodiversity: science and society. Wiley-Blackwell, London, UK.), enchytraeids and earthworms (Lagerlöf et al., 1989Lagerlöf, L.; Andrén, O.; Paustian, K. 1989. Dynamics and contribution to carbon flows of Enchytraeidae (Oligochaeta) under four cropping systems. Journal of Applied Ecology 26: 183-199.; D’Hose et al., 2018D’Hose, T.; Molendijk, L.; Berg, W.V.D.; Hoek, H.; Runia, W.; Evert, F.V.; Berge, H.T.; Spiegel, H.; Sandèn, T.; Grignani, C.; Ruysschaert, G. 2018. Responses of soil biota to non-inversion tillage and organic amendments: an analysis on European multiyear field experiments. Pedobiologia 66: 18-28.). The highest levels of OM in NF are related to the wide diversity of flora, which results in a constant accumulation of plant material on the soil. These soils naturally have high levels of Al (Figure 1), which is not found in agricultural systems due to the liming practice.
Groups such as Acarina were favored by the higher presence of P, and a similar response was also obtained by King and Hutchinson (1980)King, K.L.; Hutchinson, K.J. 1980. Effects of superphosphate and stocking intensity on grassland microarthropods. Journal of Applied Ecology 17: 581-591.. These authors evaluated the effects of superphosphate and grazing intensity on microarthropods and found an increase of Collembola and Acarina communities with increased phosphate fertilization. The authors attribute this response to the increase in nutrient availability, which positively affects the development of plants and the microbial community, which is the food base of these groups. A study evaluating soil acidity involving ecology of grassland food webs conducted by Mulder and Elser (2009)Mulder, C.; Elser, J. 2009. Soil acidity, ecological stoichiometry and allometric scaling in grassland food webs. Global Change Biology 15: 2730-2738. identified a correlation between nutrient content (P) and edaphic fauna. The authors observed that the decrease in P availability decreased fauna abundance, but increased body biomass, attributing it to the fact that the increase in P and lower C:P ratio leads to a higher P allocation in ribosomal RNA, which in turn allows for increased protein synthesis, increasing the growth rates of individuals and population growth.
In relation to PR0-10, it has a direct relationship with soil density, and studies have mentioned a negative effect of its increase on infiltration, aeration, root growth limitations and biological activity (Bedano et al., 2016). The values of PR0-10 (Table 2) were below the limiting values for soybean development (Soil Survey Staff, 1993Soil Survey Staff. 1993. Soil Survey Manual. USDA-SCS, Washington, DC, USA.). However, in addition to mechanical factors, the cementing action of earthworm coprolites (Van Groenigen et al. (2014)Van Groenigen, J.W.; Lubbers, I.M.; Vos, H.M.J.; Brown, G.G.; Deyn, G.B.; Van Groenigen, K.J. 2014. Earthworms increase plant production: a meta-analysis. Scientific Reports 4: 1-7. may increase soil structure and aggregation, as well as root activity.
Although there are a number of studies evaluating the parameters of edaphic fauna and soil quality, this is the first work in Brazil aimed at identifying the relationship between edaphic fauna and soybean yield in three no-tillage systems in commercial crops of producers under real field conditions. However, there is a need for further studies involving the morphotype or even the taxonomic identification of these indicator groups, in addition to establishing a database and future reference values for edaphic fauna.
Conclusions
Soybean productivity is affected by richness and diversity of edaphic fauna, but the abundance was not sensitive in predicting treatments under no-tillage;
Fisher's alpha index was more sensitive in treatment separation in the sampling of edaphic fauna with soil monoliths;
The environmental variables aluminum, organic matter, phosphorus, potassium and penetration resistance affect the distribution of fauna edaphic groups.
Acknowledgments
The authors thank the Sustainable Agriculture Foundation (Agrisus) for financing the project (Process Number PA 1894/16 and 2519/18), Program of Postgraduate Monitoring Scholarships (PROMOP) for the scholarship of E. K., Agricultural Research and Rural Extension Company of Santa Catarina (EPAGRI/CEPAF) for the partnership, and the rural producers involved. D. B. thanks the National Council for Scientific and Technological Development (CNPq) for the Research Productivity Grant (CNPq 305939 / 2018-1).
References
- Almeida. H.S.; Silva, R.F.; Grolli, A.L.; Scheid, D.L. 2017. Occurrence and diversity of soil fauna under different land use systems = Ocorrência e diversidade da fauna edáfica sob diferentes sistemas de uso do solo. Revista Brasileira de Tecnologia Agropecuária 1: 15-23 (in Portuguese).
- Alvares, C.A.; Stape, J.L.; Sentelhas, P.C.; Gonçalves, J.L.M.; Sparovek, G. 2014. Köppen's climate classification map for Brazil. Meteorologische Zeitschrift 22: 711-728.
- Anderson, J.M.; Ingram, J.S.I. 1993. Tropical Soil Biology and Fertility: A Handbook of Methods. 2ed. CAB International, Wallingford, UK.
- Baretta, D.; Bartz, M.L.C.; Fachini, I.; Anselmi, R.; Zortéa, T.; Maluche-Baretta, C.R.D. 2014. Soil fauna and its relation with environmental variables in soil management systems. Revista Ciência Agronômica 45: 871-879.
- Bartz, M.L.C.; Brown, G.G.; Orso, R.; Mafra, A.L.; Baretta, D. 2014. The influence of land use systems on soil and surface litter fauna in the western region of Santa Catarina. Revista Ciência Agronômica 45: 880-887.
- Bender, S.F.; Van Der Heijden, M.G.A. 2015. Soil biota enhance agricultural sustainability by improving crop productivity, nutrient uptake and reducing nitrogen leaching losses. Journal of Applied Ecology 52: 228-239.
- Bender, S.F.; Wagg, C.; Van Der Heijden, M.G.A. 2016. An underground revolution: biodiversity and soil ecological engineering for agricultural sustainability. Trends in Ecology & Evolution 31: 440-452.
- Birkhofer, K.; Smith, H.G.; Weisser, W.W.; Wolters, V.; Gossner, M.M. 2015. Land-use effects on the functional distinctness of arthropod communities. Ecography 38: 1-12.
- Cardoso, E.J.B.N.; Vasconcellos, R.L.F.; Bini, D.; Miyauchi, M.Y.H.; Santos, C.A.S.; Alves, P.R.L.; Paula, A.M; Nakatani, A.S.; Pereira, J.M.; Nogueira, M.A. 2013. Soil health: looking for suitable indicators. What should be considered to assess the effects of use and management on soil health? Scientia Agricola 70: 274-289.
- Chauvel, A.; Grimaldi, M.; Barros, E.; Blanchart, E.; Desjardins, T.; Sarrazin, M.; Lavelle, P. 1999. Pasture damage by an Amazonian earthworm. Nature 4: 32-33.
- Choudhary, M.; Datta, A.; Jat, H.S.; Yadav, A.K.; Gathala, M.K.; Sapkota, T.B.; Sharma, P.C.; Jat, M.L.; Singh, R.; Ladha, J.K. 2018. Changes in soil biology under conservation agriculture based on sustainable intensification of cereal systems in the Indo-Gangetic Plains. Geoderma 313: 193-204.
- Courtney, G.W.; Pape, T.; Skevington, J.H.; Sinclair, B.J. 2017. Biodiversity of Diptera. p. 229-278. In: Foottit, R.G.; Adler, P.H., eds. Insect biodiversity: science and society. Wiley-Blackwell, London, UK.
- Čuchta, P.; Kaňa, J.; Pouska, V. 2019. An important role of decomposing wood for soil environment with a reference to communities of springtails (Collembola). Environmental Monitoring and Assessment 191: 222.
- Dangles, O.; Malmqvist, B. 2004. Species richness–decomposition relationships depend on species dominance. Ecology Letters 7: 395-402.
- D’Hose, T.; Molendijk, L.; Berg, W.V.D.; Hoek, H.; Runia, W.; Evert, F.V.; Berge, H.T.; Spiegel, H.; Sandèn, T.; Grignani, C.; Ruysschaert, G. 2018. Responses of soil biota to non-inversion tillage and organic amendments: an analysis on European multiyear field experiments. Pedobiologia 66: 18-28.
- Edwards, C.A. 1974. Macroarthropods. p. 533-554. In: Dickinson, C.H.; Pugh, G.J.F., eds. Biology of plant litter decomposition. Academic Press, New York, NY, USA.
- Favero, S.; Souza, H.A.; Oliveira, A.K.M. 2011. Coleoptera (Insecta) as forest fragmentation indicators in the Rio Negro sub-region of the Pantanal, Mato Grosso do Sul, Brazil. Brazilian Journal of Biology 71: 291-295.
- Iglesias-Rios, R.; Mazzoni, R. 2014. Measuring diversity: looking for processes that generate diversity. Natureza & Conservação 12: 156-161.
- Jiang, Y.; Ma, N.; Chen, Z.; Xie, H. 2018. Soil macrofauna assemblage composition and functional groups in no-tillage with corn stover mulch agroecosystems in a mollisol area of northeastern China. Applied Soil Ecology 128: 61-70.
- King, K.L.; Hutchinson, K.J. 1980. Effects of superphosphate and stocking intensity on grassland microarthropods. Journal of Applied Ecology 17: 581-591.
- Krüger, I.; Chartin, C.; Van Wesemael, B.; Carnol, M. 2018. Defining a reference system for biological indicators of agricultural soil quality in Wallonia, Belgium. Ecological Indicators 95: 568-578.
- Laakso, J.; Setälä, H. 1999. Sensitivity of primary production to changes in the architecture of belowground food webs. Oikos 87: 57-64.
- Lagerlöf, L.; Andrén, O.; Paustian, K. 1989. Dynamics and contribution to carbon flows of Enchytraeidae (Oligochaeta) under four cropping systems. Journal of Applied Ecology 26: 183-199.
- Mendes, I.C.; Souza, L.M.; Souza, D.M.G.; Lopes, A.A.C.; Reis-Junior, F.B.; Lacerda, M.P.C.; Malaquias, J.V. 2019. Critical limits for microbial indicators in tropical Oxisols at post-harvest: the FERTBIO soil sample concept. Applied Soil Ecology 139: 85-93.
- Mulder, C.; Elser, J. 2009. Soil acidity, ecological stoichiometry and allometric scaling in grassland food webs. Global Change Biology 15: 2730-2738.
- Nakamura, A.; Catterall, C.P.; House, A.P.N.; Kitching, R.L.; Burwell, C.J. 2007. The use of ants and other soil and litter arthropods as bio-indicators of the impacts of rainforest clearing and subsequent land use. Journal of Insect Conservation 11: 177-186.
- Nicolodi, M.; Gianello, C. 2017. Noise in soil fertility assessment and challenges to its characterization = Ruído na avaliação da fertilidade do solo e desafios a sua caracterização. Revista Plantio Direto 158: 10-25 (in Portuguese).
- Nicolodi, M.; Gianello, C.; Anghinoni, I.; Marré, J.; Mielniczuk, J. 2008. Insufficiency of the mineralist concept to express soil fertility as perceived by plants in no-tillage system. Revista Brasileira de Ciência do Solo 32: 2735-2744 (in Portuguese, with abstract in English).
- Nicolodi, M.; Gianello, C.; Anghinoni, I.; Marré, J.; Mielniczuk, J. 2014. The mineralist concept to express the soil fertility perceived by plants grown under no-tillage system. International Journal of Agricultural Science Research 3: 187-195.
- Parisi, V.; Menta, C.; Gardi, C.; Jacomini, C.; Mozzanica, E. 2005. Microarthropod communities as a tool to assess soil quality and biodiversity: a new approach in Italy. Agriculture, Ecosystems & Environment 105: 323-333.
- Pielou, E.C. 1966. The measurement of diversity in different types of biological collections. Journal of Theoretical Biology 13: 131-144.
- Pompeo, P.N.; Oliveira Filho, L.C.I.; Santos, M.A.B.; Mafra, A.L.; Klauberg Filho, O.; Baretta, D. 2017. Morphological diversity of Coleoptera (Arthropoda: Insecta) in agriculture and forest systems. Revista Brasileira de Ciência do Solo 41: 1-15.
- Pompeo, P.N.; Santos, M.A.B.; Biasi, J.P.; Siqueira, S.F.; Rosa, M.G.; Baretta, C.R.D. M.; Baretta, D. 2016. Fauna and its relation to edaphic attributes in Lages, Santa Catarina–Brazil. Scientia Agraria 17: 42-51 (in Portuguese, with abstract in English).
- Postma-Blaauw, M.B.; Goede, R.G.M.; Bloem, J.; Faber, J.H.; Brussaard, L. 2010. Soil biota community structure and abundance under agricultural intensification and extensification. Ecology 91: 460-473.
- Rapport, D.J; Regier, H.A.; Hutchinson, T.C. 1985. Ecosystem behavior under stress. The American Naturalist 125: 617-640.
- Roeder, K.A.; Roeder, D. 2016. A checklist and assemblage comparison of ants (Hymenoptera: Formicidae) from the Wichita Mountains Wildlife Refuge in Oklahoma. Check List 12: 1-15.
- Ruggiero, M.A.; Gordon, D.P.; Orrell, T.M.; Bailly, N. Bourgoin, T.; Brusca, R.C.; Cavalier-Smith, T.; Guiry, M.D.; Kirk, P.M. 2015. A higher level classification of all living organisms. Plos One 10: e0130114.
- Santorufo, L.; Van Gestel, C.A.M.; Rocco, A.; Maisto, G. 2012. Soil invertebrates the bioindicators of urban soil quality. Environmental Pollution 161: 57-63.
- Schulte, R.P.O.; Lantinga, E.A.; Hawkins, M.J. 2005. A new family of Fisher-curves estimates Fisher's alpha more accurately. Journal of Theoretical Biology 232: 305-313.
- Somerfield, P.J.; Clarke, K.R.; Warwick, R.M. 2008. Simpson index. Encyclopedia of Ecology. Elsevier, Oxford, UK. https://doi.org/10.1016/B978-008045405-4.00133-6
» https://doi.org/10.1016/B978-008045405-4.00133-6 - Soil Survey Staff. 1993. Soil Survey Manual. USDA-SCS, Washington, DC, USA.
- Tedesco, M.J.; Gianello, C.; Bissani, C.A.; Bohnen, H.; Wolkweiss, S.J. 1995. Soil, Plant and Other Material Analysis = Análises de Solo, Plantas e Outros Materiais. UFRGS, Porto Alegre, RS, Brazil (in Portuguese).
- Topping, C.J.; Sunderland, K.D. 1992. Limitations to the use of pitfall traps in ecological studies exemplified by a study of spiders in a field of winter wheat. Journal of Applied Ecology 29: 485-491.
- Van Groenigen, J.W.; Lubbers, I.M.; Vos, H.M.J.; Brown, G.G.; Deyn, G.B.; Van Groenigen, K.J. 2014. Earthworms increase plant production: a meta-analysis. Scientific Reports 4: 1-7.
- Walter, D.E.; Proctor, H. 2013. Mites: Ecology, Evolution & Behavior. 2ed. Springer, New York, NY, USA.
Edited by
Publication Dates
-
Publication in this collection
17 Apr 2020 -
Date of issue
2021
History
-
Received
20 May 2019 -
Accepted
18 Oct 2019