ABSTRACT:
Vitamin A deficiency is the third most important micronutrient deficiency having a significant impact on public health worldwide. The aim of this study was to develop a carotenoid extraction process with edible vegetable oils, using a central composite design which, concurrently, enriches the oils with provitamin A carotenoids. The stability of carotenoids in the oil and their shelf life was also evaluated. The process also aimed to meet the Recommended Daily Intake for vitamin A (600 μg retinol equivalent for an adult) with the enriched oil. The results showed that 20 % of the vegetable matrix (dried carrot) in vegetable oil and 5 min of extraction time was an optimum combination for both soy oil (64.43 μg retinol equivalent mL−1) and olive oil (62.98 μg retinol equivalent mL−1). Furthermore, the ingestion of just a spoonful (∼10 mL) of the enriched oils would meet the Recommended Daily Intake for vitamin A (600 μg retinol equivalent), and, thus, it was possible to affirm that a dose of vegetable oils enriched with provitamin A contributes to meeting the Recommended Daily Intake for vitamin A. The proposed process is based on simple and low-cost technology that can be used to enrich edible oils (soybean and olive oil) with provitamin A.
Keywords:
retinol; food-to-food fortification; oil shelf life; carotenoid stability; central composite design
Introduction
Retinoids are essential micronutrients, and since our bodies cannot synthesize them they must be obtained from our diet. There are two sources of retinoid in diets; the first is provitamin A carotenoids from dark green and colorful vegetables and the second is vitamin A from animal products such as meat and dairy products. Provitamin A carotenoids such as β-carotene can be cleaved to form two molecules of retinal, which are then reduced to form two molecules of retinol (O’Byrne and Blaner, 2005O’Byrne, S.M.; Blaner, W.S. 2005. Introduction to retinoids. p. 1-22. In: Packer, L.; Obermuller-Jevic, U.; Draemer, K.; Sies H., eds. Carotenoids and retinoids: molecular aspects and health issues. AOCS Press, Urbana, IL, USA.).
The World Health Organization (WHO) identifies vitamin A deficiency (VAD) as the third most important micronutrient deficiency with a significant impact on public health worldwide. WHO estimated that 250 million preschool children suffer from VAD and it is likely that in the VAD population there is a substantial number of pregnant women with VAD. An estimated 250,000 to 500,000 VAD children go blind every year, and half of them die within 12 months of losing their sight. The arsenal of nutritional “well-being weapons” includes a combination of breastfeeding and vitamin A supplementation, coupled with enduring solutions, such as the promotion of vitamin A-rich diets and food fortification (WHO, 2019World Health Organization [WHO]. 2019. Micronutrient Deficiencies: Vitamin A Deficiency. World Health Organization, Geneva, Switzerland). Epidemiological studies and clinical trials strongly support the observation that adequate carotenoid supplementation may significantly reduce the risk of several non-transmissible chronic diseases due to its potential role as an antioxidant (Fiedor and Burda, 2014Fiedor, J.; Burda, K. 2014. Potential role of carotenoids as antioxidants in human health and disease. Nutrients 6: 466-488).
The presence of lipids in the diet is fundamental to the uptake of carotenoids (Van Het Hof et al., 2000Van Het Hof, K.H.; West, C.E.; Weststrate, J.A.; Hautvast, J.G.A.J. 2000. Dietary factors that affect the bioavailability of carotenoids. Journal of Nutrition 130: 503-506). Thus, extracting carotenoids and immersing them in oil ensures the concomitant intake of lipids and carotenoids. Vegetable oils were chosen for carotenoid fortification because of their lipophilic character. According to Dary and Mora (2002)Dary, D.; Mora, J.O. 2002. Food fortification to reduce vitamin A deficiency: international vitamin A Consultative Group Recommendations. Journal of Nutrition (Suplement) 132: 2927–2933., these oils meet the characteristics that should be considered for a potential fortification matrix, such as: regularity of consumption by the target population; production in strategic regions; sensory alteration of the food when compared to the non-fortified matrix; adequate stability and bioavailability as relates to consumption.
The aim of this study was to develop a carotenoid extraction process using edible vegetable oils in order to enrich the oils with provitamin A carotenoids. The process aimed to meet the Recommended Daily Intake for vitamin A (600 μg retinol equivalent for an adult) with the enriched oil.
Materials and Methods
Plant material
Carrots (Daucus carota L.) were obtained from a local market in Rio de Janeiro (22°54’13” S, 43°12’35” W, altitude of 20 m), Brazil, and dried in a convective layer dryer. Round slices of carrots (30 – 40 mm in diameter and 2 mm thick) were placed on trays in a single layer and subjected to dehydration at a temperature of 60 °C with an air velocity of 1 m s−1 for 22 h. Immediately after, the dried material was ground using a hammer mill with a 0.8 mm sieve and the powder stored in plastic zipper vacuum airtight aluminum foil packs to protect it from oxygen and light, in a climatized room (25 °C) for one day until preparation of the edible oil enriched with carotenoid.
The vegetable oils were obtained from a local market in Rio de Janeiro, Brazil. The composition of the soy oil used, as declared by the manufacturer, was “100 % refined soy oil” and the olive oil was “extra virgin olive oil” (acidity ≤ 0.5 %).
According to the International Olive Council classification (IOC, 2020International Olive Council [IOC] 2020. Designations and definitions of olive oils. Available at: https://www.internationaloliveoil.org/olive-world/olive-oil/ [Accessed Mar 6, 2020
https://www.internationaloliveoil.org/ol...
), virgin olive oils are the oils obtained from the fruit of the olive tree (Olea europaea L.) solely by mechanical or other physical means under conditions, particularly thermal conditions, that do not lead to alterations in the oil, and which have not undergone any treatment other than washing, decantation, centrifugation and filtration. Extra virgin olive oil is a virgin olive oil that has a free acidity no higher than 0.8 %, expressed as oleic acid.
Preparation of the edible oil enriched with carotenoids
The process of preparing the edible oil enriched with carotenoids consisted of two steps: 1) extraction of the carotenoids with edible vegetable oils from the dehydrated matrix by agitation in a blender at 10,000 rpm processed at room temperature; 2) removal of solid material dispersed in the oil after extraction by vacuum filtration in a Buchner funnel (150 mm diameter) and quantitative filter paper (fast filtration).
The extraction parameters were Ratio of Carrot Mass /Oil Volume (%M/V) that varied from 6.70 to 63.33 and Time (min) that ranged from 5.0 to 13.5 min. The final extraction volume was 100 mL. The enriched oil was kept in amber glass bottles at room temperature and protected from moisture for shelf life experiments.
Carotenoid analysis
Extraction of carotenoids from carrot for analysis
The carotenoids were extracted according to Pacheco et al. (2014)Pacheco, P.; Peixoto, F.M.; Borguini, R.G.; Nascimento, L.S.M.; Bobeda, C.R.R.; Santiago, M.C.P.A.; Godoy, R.L.O. 2014. Microscale extraction method for HPLC carotenoid analysis in vegetable matrices. Scientia Agricola 71: 345-355. The sample was homogenized and approximately 0.1 g of dried carrot powder was weighed in a 2 mL microcentrifuge tube. One mL of acetone was added, and the solid residue macerated using a microturrax for 30 s. The mixture was centrifuged at 6,339 × g for 1 min and the supernatant transferred to a 25 mL burette containing 5 mL of 5 % ethyl ether solution in petroleum ether. Acetone (500 μL) was added to the residue of the centrifuge tube and the extraction procedure was repeated three or four times until the extract no longer exhibited the characteristic color of carotenoids. The resulting supernatant (acetone extract) was transferred, quantitatively, to a burette. Next, the extract was washed three times using ultrapure water or until the wash water had turned translucent. The extract was allowed to stand for 3 min before water decanting. The volume of ether extract was recorded, then 1 mL was transferred to a volume cuvette and the total carotenoid contents determined by spectrophotometry.
Total carotenoid quantification
The amount of total carotenoids from carrot was determined by spectrophotometry at 450 nm. Analyses were performed in triplicate (Rodriguez-Amaya, 2001Rodriguez-Amaya, D.B. 2001. A Guide to Carotenoid Analysis in Foods. ILSI Press, Washington, DC, USA).
Carotenoid profile determination
The petroleum ether extract (2 mL) was dried under nitrogen flow and the residue solubilized in 200 µL of acetone. The carotenoid profile was determined by HPLC (Pacheco et al., 2014Pacheco, P.; Peixoto, F.M.; Borguini, R.G.; Nascimento, L.S.M.; Bobeda, C.R.R.; Santiago, M.C.P.A.; Godoy, R.L.O. 2014. Microscale extraction method for HPLC carotenoid analysis in vegetable matrices. Scientia Agricola 71: 345-355), using an HPLC system, controlled by the Empower software program with a column oven at 33 ºC and a photodiode array detector (PDA). Carotenoid separation was obtained in a C30 column (S-3 Carotenoid, 4.6 mm × 250 mm; 3µ) by a gradient elution of methanol and methyl tert-butyl ether. The elution started with a mix of 80 % methanol and 20 % methyl tert-butyl ether. At 0.5 min the ether concentration was increased to 25 %, at 15.00 min to 85 % and at 15.05 to 90 % ether. This concentration was maintained at 90 % for 16.50 min and then at 16.55 min returned to the initial condition (20 %), remaining constant for up to 28 min. The flow rate was 0.8 mL min−1 and the running time 28 min. The injection volume of the samples was 15 μL. Carotenoids were identified based on their retention times and UV/Vis absorption spectra, compared to the retention times of the carotenoid standards. The carotenoid quantification was carried out using analytical standards (lutein, α-carotene, and β-carotene) previously isolated in the laboratory according to Kimura and Rodriguez-Amaya (2001)Rodriguez-Amaya, D.B. 2001. A Guide to Carotenoid Analysis in Foods. ILSI Press, Washington, DC, USA. After isolating the carotenoid of interest and determining its chromatographic purity, the concentration of the solution obtained was determined by spectrophotometry (Lambert-beer law). Using this value, the required volume of the standard solution corresponding to 5 μg of the carotenoid was calculated. Next, the solvent was removed and the standard suspended in 1 mL of petroleum ether, producing a solution with a concentration of 5 μg mL−1. This solution was used for the dilution of the analytical curve of seven points with the following final concentration 0.5; 1.5; 2.5; 3.5; 5.0; 6.5 and 8.0 µg mL−1. The standards, with purities in excess of 99 %, were used to make calibration curves, which were used to calculate the carotenoid content in each sample.
Determination of carotenoids in vegetable oil
Total carotenoid content and carotenoid profile in vegetable oil (not enriched) and enriched vegetable oils were evaluated by spectrophotometry and HPLC, respectively. Approximately 0.5 g of each vegetable oil (both not enriched and enriched with carotenoids) was weighed in 25 mL volumetric flasks and topped up with petroleum ether. The level of total carotenoids in the oil was determined by spectrophotometry at 450 nm. Carotenoid profiles were determined in a solution composed of 200 µL of oil and 800 µL of acetone by HPLC, using the same method described for vegetable matrixes (Pacheco et al., 2014Pacheco, P.; Peixoto, F.M.; Borguini, R.G.; Nascimento, L.S.M.; Bobeda, C.R.R.; Santiago, M.C.P.A.; Godoy, R.L.O. 2014. Microscale extraction method for HPLC carotenoid analysis in vegetable matrices. Scientia Agricola 71: 345-355).
Shelf life in not enriched and enriched soy and olive oils
The quality of vegetable oils (soy and olive) was evaluated both before and after the enrichment process with carotenoids. They were stored in amber glass bottles at room temperature and protected from moisture. Total carotenoids, acidity, peroxides and conjugated dienes and trienes (CDT) were evaluated every 30 days for 150 days. The acidity and peroxide index analyses were performed according to the official methods of AOCS (2009)American Oil Chemists’ Society [AOCS]. 2009. Official Methods and Recommended Practices. 6ed. AOCS, Urbana, IL, USA Ca 5a-40 and Cd 8-53, respectively. Vegetable oils were subjected to CDT analysis according to the standard DGF C IV 6 (1984)Deutsche Gesellschaft für Fettwissenschaft e.V [DGF]. 1984. German standard methods for the investigation of fats, fat products and related substances. = Deutsche Einheitsmethoden zur Untersuchung von Fetten, Fettprodukten und verwandten Stoffen. Wissenchaftliche Verlagsgesellschaft mbH, Stuttgart, Germany (in German). methodology, except for olive oil for which a UV extinction value was determined according to the AOCS Ch 5-91 method.
A basic kinetic model was used to predict changes during storage according to Equation 1:
where the sign depends on the increment (+) or degradation (-) of the compound of interest (total carotenoids, acidity and CDT), C is the compound, t time, n the reaction order and k the rate constant.
Finally, the shelf life for total carotenoids was calculated as the half shelf life (t1/2), which is the time necessary to reach half the initial amount of the compound of interest.
Efficiency of extraction
The carotenoid extraction efficiency (E) was calculated using Equation 2, the E expressing the percentage of carotenoids from vegetables that could be extracted by the oil.
where TCO is the total carotenoids in oil (μg mL−1); TCM total carotenoids in the vegetal matrix (μg g−1), and the ratio Carrot Mass /Oil Volume (%M/V).
Determination of oil recovery
The oil recovery after the extraction process was determined by comparing oil volume used at the beginning of extraction with the oil volume recovered in the final stage of the extraction process.
Experimental design and statistical analysis
The experimental design for the carotenoid extraction from carrots was carried out using a 22 Central Composite Rotational Design (CCRD) of response surface methodology, with four design points (nc = 4) at two levels (the combination of ±1 levels), four stars or axial points (ns = 4) which were represented by ± α (these points take care of the quadratic effects) and finally the central points with replicates (n = 3), making a total of 11 runs or treatments (Table 1). The two factors studied (independent variables) were the ratio of Carrot Mass /Oil Volume (%M/V) and Time (min). The CCRD was incorporated into the following responses: Efficiency, Total Carotenoids, Lutein, α-carotene, β-carotene, 9-cis-β-carotene, 13-cis-β-carotene, retinol and oil recovery. The desirability function (ranged from 0 to 1) was carried out to optimize the efficiency, total carotenoids and recovery. All statistical analysis was performed at a significance level of 5 %, and was carried out using the Statistica software program (Statsoft, Statistica 7.0). The response variables were modeled based on a polynomial equation (Equation 3) as follows:
Experimental design for the extraction parameters and predicted responses for the extraction of carotenoids from carrots using soy oil.
where X1 is the ratio of Carrot Mass/Oil Volume (%M/V); X2 time; βo the independent term; β11 the regression coefficients for the linear response of the ratio; β12 the regression coefficients for the quadratic response of the ratio; β21 the regression coefficients for the linear response of the time; β22 the regression coefficients for the quadratic response of the time and β31 the regression coefficients for the interaction of both factors.
To optimize the retinol equivalent (RE) content the desirability function was applied and optimization was performed using three simultaneous responses. According to Myers (2016)Myers, R.H.; Montgomery, D.C.; Anderson-Cook, C.M. 2016. Response surface methodology: process and product optimization using designed experiments. 4ed. Wiley-Blackwell, Hoboken, NJ, USA and de Paula et al. (2019)Paula, B.P.; Chávez, D.W.H.; Lemos-Junior, W.J.F.; Guerra, A.F.; Corrêa, M.F.D.; Pereira, K.S.; Coelho, M.A. Z. 2019. Growth parameters and survivability of Saccharomyces boulardii for probiotic alcoholic beverages development. Frontiers in Microbiology 10: 1-10, the first step consists in finding an individual desirability level (di) varying between 0 and 1 for each response (yi). Each desirability level could have a different objective, e.g. desirability could be minimized, maximized or just sufficient to reach a specific target. The following equation (Equation 4) explains how to calculate the individual desirability level.
where ri is a weight assigned to each response according to the degree of importance of the desirability level as follows: if ri = 1, the desirability became a priority to reach its target value, if 0 ≤ ri ≤ 1 means less important. yi is the value of the response for each treatment, Li the minimum response, and Ti the maximum response (Derrien et al., 2017Derrien, M.; Badr, A.; Gosselin, A.; Desjardins, Y.; Angers, P. 2017. Optimization of a green process for the extraction of lutein and chlorophyll from spinach by-products using response surface methodology (RSM). LWT - Food Science and Technology 79: 170-177).
The second step is to calculate the overall desirability level (D) by applying Equation 5 as follow:
where D is the overall desirability level and di the individual desirability level.
Results and Discussion
The total carotenoid content in dried carrot was 887.23 µg g−1, which was used to calculate the extraction efficiency (Table 1).
The results obtained by the experimental design (Table 1) show that the extraction efficiency (E) improved with the lowest (%M/V) ratio, e.g. with a ratio of 6.7 % the highest E of 97 % (p < 0.05) was obtained, recalling the E express percentage of carotenoids from vegetable that may be extracted by the oil. On the other hand, total carotenoids in oil increased with as the ratio increased. Thus, the lowest and highest values were 57.7 µg mL −1 and 328.67 µg mL−1 for the ratios 6.7 % and 63.3 %, respectively (Table 1), wherever the ratio increase has less E. Almost all the responses (lutein, α-carotene, β-carotene, Retinol equivalent) presented the same behavior, namely, that total carotenoid increased as the ratio increased. An increase in the ratio resulted in a higher carotenoid content in the oil; however, the E results decreased. This could be because the dry carrot amount rose, and made the availability of the vegetable oil to interact with the carrot difficult. Thus, the increment in the ratio increased results in higher carotenoid content in the oil but with less E, which in turn could result in an economic loss since after the extraction process, the dry carrot still retained the substance of interest.
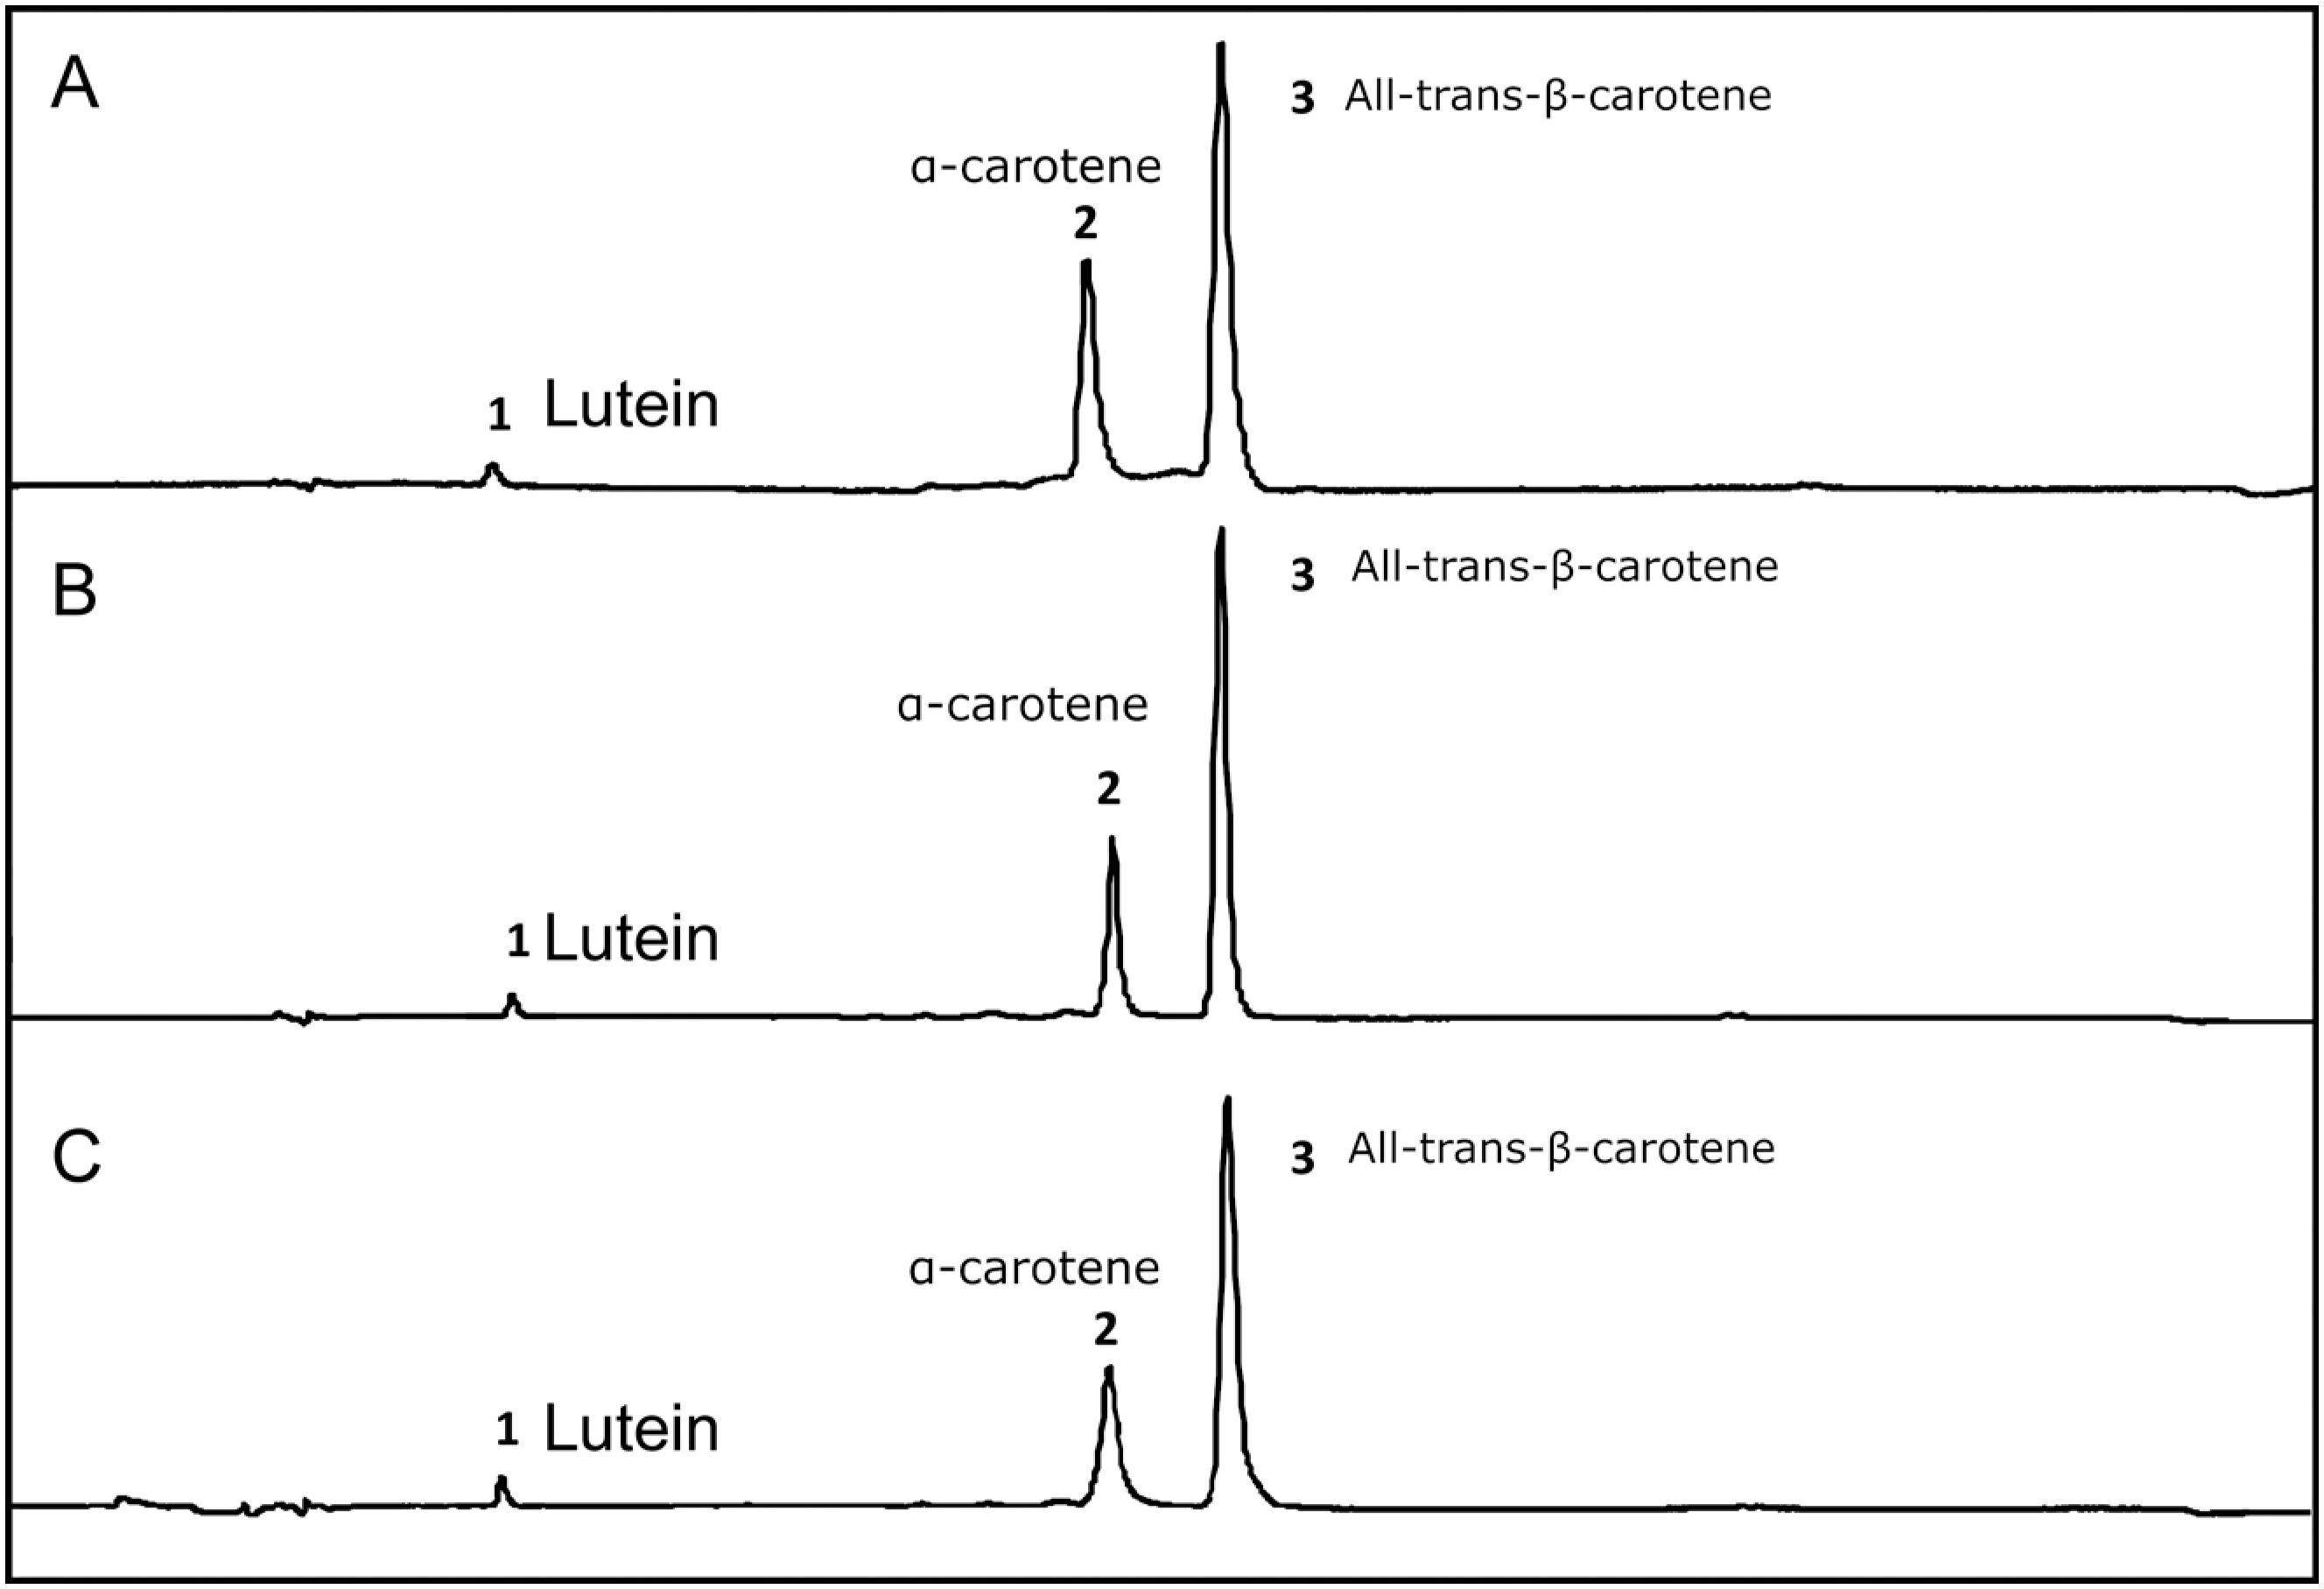
According to the chromatograms presented in Figure 1, there was no change in the carotenoid profile for dried carrot, soy and olive oil enriched with carotenoids. Thus, it was not possible to observe carotenoid degradation or trans-cis conversion. All procedures were taken to prevent carotenoid degradation. In the case of carrots, processing and storage were as fast as possible in order to avoid prolonged contact with oxygen, which is the main factor in the degradation of carotenoids. In the case of vegetable oils, transporting the carotenoids in the oil can be considered a protective factor, since the oil itself protects the carotenoids from contact with oxygen.
HPLC chromatograms at 450 nm of dried carrot (A), enriched soy oil (B) and enriched olive oil (C). Peak identification: 1) lutein; 2) α-carotene; 3) All-trans-β-carotene. Peak areas (UA): dried carrot (lutein 70828; α-carotene 1280403; β-carotene 2477785), enriched soy oil (lutein 219304; α-carotene 3169265; β-carotene 8653354) and enriched olive oil (lutein 295806; α-carotene 2813841; β-carotene 8257522).
Oil recovery had an inverse relationship with ratio, the higher the ratio the lower the oil recovery (p < 0.05). With increases in the ratio there was greater absorption of oil by the vegetal matrix, resulting in a lower recovery of oil at the end of the extraction process.
The ratio presented a linear relationship with the response variables as is observed in Table 2, where the p value for the linear coefficient was significant in all cases (p < 0.05). On the other hand, time had no significant effect and presented p values for linear coefficients in excess of 0.05. There were no quadratic effects (p > 0.05) either for ratios or for time, in the same way as there were no interactions (p > 0.05) between the two factors.
The mathematical models (Figure 2) were adequate for almost all responses with the exception of Efficiency, which had a low R2Abj (0.338). For the other variables, the R2Abj were 0.7818, 0.8760, 0.9452, 0.9588, 0.9653 and 0.9659 for the following: oil recovery, lutein, total carotenoids, α-carotene, retinol equivalent, β-carotene in that order. As was mentioned above, time was not significant (Table 2) for any of the variables (p > 0.05) but it was retained in the models to improve the 3D model fit.
Surface responses (mathematical models, their p value and the R2adj) of factors, Ratio (X1) and Time (X2) that enrich the oil with carotenoids from carrots. Mathematical models present coefficients with significant effects (p < 0.05). Although the coefficients for time (X2) were not significant (p > 0.05), they were maintained to improve the model fit. R2adj ≥ 0.70 were considered predictive (Toledo et al., 2019Toledo, V.C.S.; Carvalho, C.W.P.; Vargas-Solórzano, J.W.; Ascheri, J.L.R.; Comettant-Rabanal, R. 2019. Extrusion cooking of gluten-free whole grain flour blends. Journal of Food Process Engineering 43: 1-9).
Efficiency and oil recovery responses presented a negative relationship with the ratio (negative sign in the X1 coefficient). On the other hand the rest of the responses presented a direct association with the ratio (a positive sign in the X1 coefficient); thus the responses increased as the ratio increased.
As Efficiency did not have an adequate mathematical model, it was not considered in the optimization with the desirability function (Figure 3); thus, RE (Figures 3A, 3B and 3C for ratio, time and RE desirability, respectively) and total carotenoids (Figures 3D, 3E and 3F for ratio, time and total carotenoid desirability, respectively) were chosen because they presented the same behavior as the responses of lutein, α-carotene and β-carotene. On the other hand, recovery (Figures 3G, 3H, and 3I for ratio, time and recovery desirability respectively) was also chosen as it presented an opposite trend. Left and center columns in the Figure 3 represent the ratio and time variables as well as making it possible to observe the change in three responses in which the ratio and time changed.
Simultaneous optimization of process parameters (ratio and time) to achieve the Recommended Daily Intake (RDI) in retinol equivalent to obtain enriched soy oil using carrots, by applying the desirability function in responses to the surface methodology.
The right column indicates what was desirable in each response. Thus, the desirable amount of RE was fixed at 60 μg mL−1 (Figure 3C) based on the Recommended Daily Intake (RDI) for vitamin A which is 600 μg RE for an adult (ANVISA, 2005aAgência Nacional de Vigilância Sanitária [ANVISA]. 2005a. Technical Regulation of Recommended Daily Intake (RDI) of protein, vitamins and minerals = Regulamento técnico sobre a ingestão diária recomendada (IDR) de proteína, vitaminas e minerais. Anvisa, Brasília, DF, Brazil (in Portuguese)), that can be obtained from the ingestion of 10 mL (a spoonful) of provitamin A enriched oil. Thus, the desirability function was used to achieve 60 μg of RE mL−1, and to maximize total carotenoids and recovery. On the other hand, it was desirable to maximize the recovery and total carotenoids as observed in Figures 3F and 3I respectively.
The results of the desirability function are in the last row (Figures 3J and 3K for ratio and time respectively), thus, the optimum conditions were a ratio of 21 % and 15 min to obtain an oil enriched with ∼ 60 μg of RE mL−1 maximizing the total carotenoids and the recovery from carrots, but when considering the lack of significant effect of time, it would be advisable to reduce the time to a minimum (5 min) in order to minimize contact with oxygen. Contact with oxygen during blending in extraction processes can trigger a deterioration in the oil due to oxidative reactions and, therefore, reduce the shelf life of the product (McClements and Decker, 2007McClements, D.J.; Decker, E.A. 2007. Lipids. p. 131-178. In: Damodaran, S.; Parkin, L.K.; Fennema, O.R., eds. Fennema's food chemistry. 4ed. CRC Press, Boca Raton, FL, USA.).
To validate the model and considering the results of the desirability function, the parameters 20 % (M/V) ratio and the extraction times of 5 and 10 min were chosen to determine the amount of provitamin A in terms of RE in the soy oil (not enriched and enriched). The results confirmed an adequate RDI for the soy oil, with values of 64.43 μg RE mL−1 for 20/5 (ratio/time) and 70.53 μg RE mL−1 for 20/10 (ratio/time), varying by 6.9 % and 14.9 % respectively, these results validating the experiment. The same parameters (20 % ratio, the extraction times of 5 and 10 min) were applied to determine the amount of provitamin A carotenoids from carrots in olive oil, and these parameters obtained similar RE contents (62.98 and 69.31 μg RE mL−1 for 5 and 10 min of extraction, respectively).
Even time was not significant for modeling RE, and an increment in RE was observed. However, with an extraction time of 5 min, it was possible to reach the Recommended Daily Intake for vitamin A content (600 μg retinol equivalent for an adult) using one dose of the product (10 mL or a spoonful). In addition, 10 min for carotenoid extraction promotes an increase of 100 % in the duration of the extraction step, which means more use of equipment, higher cost, as well as higher exposure of oils to oxidation.
According to the Brazilian Legislation for Enriched or Fortified Foods (ANVISA, 1998Agência Nacional de Vigilância Sanitária [ANVISA]. 1998. Technical Regulation for the Identification and Quality Setting of Foods Enriched with Essential Nutrients = Regulamento Técnico para a Fixação de Identidade e Qualidade de Alimentos Adicionados de Nutrientes Essenciais. Anvisa, Brasília, DF, Brazil (in Portuguese)), 100 mL or 100 g of the product, ready for consumption, must supply at least 15 % of the reference RDI for liquids and 30 % of the reference case for solids. In this case, the vegetable oils with carotenoids obtained by the process presented can be considered fortified/enriched and should have the words “high content” or “rich” on the label.
The reaction orders (n) of 0, 1 and 2 (Table 3 and Figure 4) were tested for the kinetic deterioration parameters (total carotenoids, acidity, peroxide index and D as conjugates of dienes and trienes) of the enriched oil (soy and olive) with provitamin A from carrots. The criteria to choose the kinetic order were that all the parameters have to be significant (p < 0.05) and at the same time the model must have the highest R2. The second order was not adequate for any deterioration parameters (Table 3).
Basic kinetic parameter for zero, first and second order in stability study of vegetable oils enriched with provitamin A.
Experimental data and models for total carotenoids. Soy oil on the left, Olive oil on the right. Total carotenoids (A, E), acidity (B, F), peroxide index (C, G) and conjugated dienes and trienes (D, H) by kinetic modeling for oil enriched with provitamin A extracted from carrots.
In soy oil, regrading of 5 min extraction time, and total carotenoids (Figure 4A) followed a zero order kinetics degradation, as well as acidity (Figure 4B) without adjustment as per any kinetic order, due to the fact that it did not decrease sufficiently to describe a mathematical model with significant parameters (p < 0.05). Thus, acidity was stable for the 150 days of the experiment (Table 3), and the peroxide index and CDT (Figures 4C and 4D) presented a first order kinetics degradation. For 10 min extraction time the reaction order kinetics was: 0, no model adjustment, 0 and 1 for total carotenoids, oil acidity, peroxide index and CDT respectively.
Based on the olive oil results, it was not possible to adjust the data of total carotenoids and acidity (Figure 4E and 4F) to any kinetic order. This is probably due to the fact that the total carotenoids were stable through 150 days of storage time. Initially the acidity maintained stability (plateau), but after 90 days it presented a small increase and another plateau at the end of the experiment (150 days). The peroxide index (Figure 4G) presented a first order kinetics (n = 1) for not enriched, 5 min and 10 min of the blender in the extraction process; on the other hand the CDT (Figure 4H) presented a zero order kinetics (n = 0) for not enriched and 5 min of extraction time, and a first-order kinetics for 10 min of the blender for the extraction of the carotenoids.
The stability of the carotenoids in the soybean oil and olive oil was evaluated over 150 days of storage (Figures 4A and 4B). The results of the study showed 80 % and 97 % of carotenoid retention in soybean oil and olive oil, respectively. Carotenoids showed greater stability in olive oil than in soybean oil (Figure 4A and 4B respectively). According to Velasco and Dobarganes (2002)Velasco, J.; Dobarganes, C. 2002. Oxidative stability of virgin olive oil. European Journal of Lipid Science and Technology 104: 661–676, virgin olive oil has high resistance to oxidative deterioration due to the low content of polyunsaturated fatty acids and the high amounts of phenolic compounds. There is a greater amount of phenolic compounds in virgin olive oil compared to other refined oils, as they are eliminated or drastically reduced during the refining process. These phenolic compounds in virgin olive oil probably improve the stability of the carotenoids.
The shelf life for total carotenoids, calculated as the half shelf life (t1/2), for soy oil was 323 days (10.8 months) for not enriched and 237 days (7.9 months) for 5 min of the extraction process. It was not possible to calculate the shelf life of soy and olive oils in terms of acidity as they did not present a kinetic trend in any order (0, 1 or 2).
The time to achieve maximum concentration according to government laws (ANVISA, 2005bAgência Nacional de Vigilância Sanitária [ANVISA]. 2005b. Technical regulation of vegetable oils, vegetable fats and vegetable cream = Regulamento técnico para óleos vegetais, gorduras vegetais e creme vegetal. Anvisa, Brasília, DF, Brazil (in Portuguese)) pertaining to the peroxide index for soy oil (maximum concentration allowed is 10 meq kg−1) was 98 days for soy oil with no carotenoids, followed by soy oil with carotenoid extracted for 5 min (91 days) and soy oil with carotenoid extracted for 10 min (39 days). On the other hand, olive oil presented greater shelf life as a function of the peroxide index (maximum concentration allowed is 20 meq kg−1). Thus, the treatments of olive oil with no carotenoids, olive oil with carotenoid extracted after 5 min and olive oil with carotenoids after 10 min of blender reached 169, 197 and 98 days respectively. This greater shelf life of olive oil against soy oil is because the maximum allowed concentration is two times that of soy oil and the carotenoids presented a protective effect in the olive oil.
The use of oil for the extraction of provitamin A carotenoid from carrots was shown to be a superior strategy for enriching the oil. Soybean oil is the vegetable oil most commonly consumed by the Brazilian population, and olive oil is in second place, according to the most recent survey on consumption called Pesquisa de Orçamentos Familiares (POF, Family Budget Research) 2008-2009 carried out by the Instituto Brasileiro de Geografia e Estatística (IBGE). Thus, it can be used for carotenoid fortification and to increase provitamin A intake for needy populations. The differential in the proposed process used in this study is that carotenoids were extracted from natural sources. Thus, there were no additions of synthetic substances; furthermore, the technology used in the extraction process was simple and low-cost.
Vegetable oils composed of unsaturated fatty acids are highly recommended for their health benefits. These oils are at the base of the food pyramid and are recommended as the primary sources of fat. Foods high in good fats include vegetable oils (such as olive, canola, sunflower, soy, and corn), nuts, seeds, and fish (Willett and Skerrett, 2017Willet, W.; Skerrett, P.J. 2017. Eat, drink and be healthy: the Harvard Medical School guide to healthy eating. Free Press, New York, NY, USA).
Red palm oil is a source of provitamin A carotenoids. However, it is also rich in saturated fat, which could contribute to an increase in cholesterol and the development of atherosclerotic complications (Willett and Skerrett, 2017Willet, W.; Skerrett, P.J. 2017. Eat, drink and be healthy: the Harvard Medical School guide to healthy eating. Free Press, New York, NY, USA). In addition to its health-jeopardizing aspects, it has a strong flavor, which could prompt low acceptance by consumers.
The enriched oil can be used directly for consumption or as a replacement for the oil used in the preparation of food. The enrichment of foods with provitamin A aims to prevent and / or mitigate the VAD problem and increase the antioxidant potential by the action of β-carotene. According to the International Vitamin A Consultative Group (IVACG, 2017International Vitamin A Consultative Group [IVACG]. 2017. Conversion factor for vitamin A and carotenoids. Available at: http://pdf.usaid.gov/pdf_docs/Pnacp110.pdf/ [Accessed Feb 10, 2019]
http://pdf.usaid.gov/pdf_docs/Pnacp110.p...
), carotenoids immersed in oil have a higher conversion efficiency to equivalent retinol (6 times higher) when compared to carotenoids in vegetable matrices (eg: 1 µg RE = 2 µg β-carotene in oil or 12 µg β-carotene in mixed foods).
The choice of dietary lipid and its fatty acid profile is vital to the enhancement of the bioavailability of carotenoids. Lakshminarayana and Baskaran (2013)Lakshminarayana, R.; Baskaran, V. 2013. Influence of olive oil on the bioavailability of carotenoids. European Journal of Lipid Science and Technology 115: 1085-1093 showed that dietary unsaturated fat appears to be a suitable carrier for carotenoids when oxidative stress is a critical issue in nutrition–related degenerative disorders. Specific fatty acids or vegetable lipids play an important role in carotenoid bioavailability and are also involved in the regulation of the oxidative mechanism.
The present study is in accordance with the concept of food–to–food fortification (Chadare et al., 2019Chadare, F.J.; Idohou, R.; Nago, E.; Affonfere, M.; Agossadou, J.; Fassinou, T.K.; Kénou, C.; Honfo, S.; Azokpota, P.; Linnemann, A.R.; Hounhouigan, D.J. 2019. Conventional and food–to–food fortification: an appraisal of past practices and lessons learned. Food Science & Nutrition 7: 2781-2795), that often uses foods that are available in the area of the target population to enhance nutrient intake. This approach consists of selecting and associating foods (a common staple and a fortifying food) in such a way so as to optimize the bioavailability of interesting micronutrients to consumers.
There are no documented studies indicating that β-carotene from natural food sources, when ingested in moderation, can cause harm to an individual. There have been examples of ingestion of very large amounts of carotenoids from food sources, and the major side effect under these circumstances was the occasional appearance of carotenodermia, which is the accumulation of β-carotene in the skin with the effect of giving it a yellow or orange color (Krinsky, 2005Krinsky, N.I. 2005. Safety of β-carotene. p. 338-350. In: Packer, L.; Obermuller-Jevic, U.; Draemer, K.; Sies H., eds. Carotenoids and retinoids: molecular aspects and health issues. AOCS Press, Urbana, IL, USA.).
For industrial use of the carotenoid extraction using edible vegetable oil, it would be advisable that a carotenoid extraction followed certain steps: 1) the first one consists of a pre-mixer process, whereby a small amount of oil (20 L to 100 L of capacity) will be mixed with carrot powder using a high shear liquid-solid mixture (equipment for powder incorporation/dispersion into liquids). In this step, the proportion of the oil/carrot powder as well as shear rate and time must be optimized; 2) the second step would consist of the mixing of the product previously obtained with an increased quantity of oil (hide mixture tank). In this stage the proportion, time, temperature, and rotation must be optimized, and 3) the purification of the product could be done by filtration by, for example, a plate filter followed by a filter press.
Conclusion
The process developed to extract carotenoids showed that it was possible to enrich edible vegetable oils with carotenoids from natural sources, using only the vegetable oil as the vehicle of extraction. Small quantities of enriched oils, 10 mL for soybean oil or olive oil, can supply the Recommended Daily Intake for vitamin A for an adult.
Lastly, some final considerations: the proposed process consists of simple and low-cost technology that can be used to enrich edible oils (soybean and olive oil) with provitamin A. The ingestion of small quantities of the enriched oils can contribute to preventing and/or mitigating vitamin A deficiency, which is considered a public health issue in a number of countries and by certain populations worldwide.
References
- Agência Nacional de Vigilância Sanitária [ANVISA]. 1998. Technical Regulation for the Identification and Quality Setting of Foods Enriched with Essential Nutrients = Regulamento Técnico para a Fixação de Identidade e Qualidade de Alimentos Adicionados de Nutrientes Essenciais. Anvisa, Brasília, DF, Brazil (in Portuguese)
- Agência Nacional de Vigilância Sanitária [ANVISA]. 2005a. Technical Regulation of Recommended Daily Intake (RDI) of protein, vitamins and minerals = Regulamento técnico sobre a ingestão diária recomendada (IDR) de proteína, vitaminas e minerais. Anvisa, Brasília, DF, Brazil (in Portuguese)
- Agência Nacional de Vigilância Sanitária [ANVISA]. 2005b. Technical regulation of vegetable oils, vegetable fats and vegetable cream = Regulamento técnico para óleos vegetais, gorduras vegetais e creme vegetal. Anvisa, Brasília, DF, Brazil (in Portuguese)
- American Oil Chemists’ Society [AOCS]. 2009. Official Methods and Recommended Practices. 6ed. AOCS, Urbana, IL, USA
- Chadare, F.J.; Idohou, R.; Nago, E.; Affonfere, M.; Agossadou, J.; Fassinou, T.K.; Kénou, C.; Honfo, S.; Azokpota, P.; Linnemann, A.R.; Hounhouigan, D.J. 2019. Conventional and food–to–food fortification: an appraisal of past practices and lessons learned. Food Science & Nutrition 7: 2781-2795
- Dary, D.; Mora, J.O. 2002. Food fortification to reduce vitamin A deficiency: international vitamin A Consultative Group Recommendations. Journal of Nutrition (Suplement) 132: 2927–2933.
- Derrien, M.; Badr, A.; Gosselin, A.; Desjardins, Y.; Angers, P. 2017. Optimization of a green process for the extraction of lutein and chlorophyll from spinach by-products using response surface methodology (RSM). LWT - Food Science and Technology 79: 170-177
- Deutsche Gesellschaft für Fettwissenschaft e.V [DGF]. 1984. German standard methods for the investigation of fats, fat products and related substances. = Deutsche Einheitsmethoden zur Untersuchung von Fetten, Fettprodukten und verwandten Stoffen. Wissenchaftliche Verlagsgesellschaft mbH, Stuttgart, Germany (in German).
- Fiedor, J.; Burda, K. 2014. Potential role of carotenoids as antioxidants in human health and disease. Nutrients 6: 466-488
- International Vitamin A Consultative Group [IVACG]. 2017. Conversion factor for vitamin A and carotenoids. Available at: http://pdf.usaid.gov/pdf_docs/Pnacp110.pdf/ [Accessed Feb 10, 2019]
» http://pdf.usaid.gov/pdf_docs/Pnacp110.pdf/ - International Olive Council [IOC] 2020. Designations and definitions of olive oils. Available at: https://www.internationaloliveoil.org/olive-world/olive-oil/ [Accessed Mar 6, 2020
» https://www.internationaloliveoil.org/olive-world/olive-oil/ - Kimura, M.; Rodriguez-Amaya, D.B. 2002. A scheme for obtaining standards and HPLC quantification of leafy vegetable carotenoids. Food Chemistry 78: 389-398
- Krinsky, N.I. 2005. Safety of β-carotene. p. 338-350. In: Packer, L.; Obermuller-Jevic, U.; Draemer, K.; Sies H., eds. Carotenoids and retinoids: molecular aspects and health issues. AOCS Press, Urbana, IL, USA.
- Lakshminarayana, R.; Baskaran, V. 2013. Influence of olive oil on the bioavailability of carotenoids. European Journal of Lipid Science and Technology 115: 1085-1093
- McClements, D.J.; Decker, E.A. 2007. Lipids. p. 131-178. In: Damodaran, S.; Parkin, L.K.; Fennema, O.R., eds. Fennema's food chemistry. 4ed. CRC Press, Boca Raton, FL, USA.
- Myers, R.H.; Montgomery, D.C.; Anderson-Cook, C.M. 2016. Response surface methodology: process and product optimization using designed experiments. 4ed. Wiley-Blackwell, Hoboken, NJ, USA
- O’Byrne, S.M.; Blaner, W.S. 2005. Introduction to retinoids. p. 1-22. In: Packer, L.; Obermuller-Jevic, U.; Draemer, K.; Sies H., eds. Carotenoids and retinoids: molecular aspects and health issues. AOCS Press, Urbana, IL, USA.
- Pacheco, P.; Peixoto, F.M.; Borguini, R.G.; Nascimento, L.S.M.; Bobeda, C.R.R.; Santiago, M.C.P.A.; Godoy, R.L.O. 2014. Microscale extraction method for HPLC carotenoid analysis in vegetable matrices. Scientia Agricola 71: 345-355
- Paula, B.P.; Chávez, D.W.H.; Lemos-Junior, W.J.F.; Guerra, A.F.; Corrêa, M.F.D.; Pereira, K.S.; Coelho, M.A. Z. 2019. Growth parameters and survivability of Saccharomyces boulardii for probiotic alcoholic beverages development. Frontiers in Microbiology 10: 1-10
- Rodriguez-Amaya, D.B. 2001. A Guide to Carotenoid Analysis in Foods. ILSI Press, Washington, DC, USA
- Toledo, V.C.S.; Carvalho, C.W.P.; Vargas-Solórzano, J.W.; Ascheri, J.L.R.; Comettant-Rabanal, R. 2019. Extrusion cooking of gluten-free whole grain flour blends. Journal of Food Process Engineering 43: 1-9
- Van Het Hof, K.H.; West, C.E.; Weststrate, J.A.; Hautvast, J.G.A.J. 2000. Dietary factors that affect the bioavailability of carotenoids. Journal of Nutrition 130: 503-506
- Velasco, J.; Dobarganes, C. 2002. Oxidative stability of virgin olive oil. European Journal of Lipid Science and Technology 104: 661–676
- Willet, W.; Skerrett, P.J. 2017. Eat, drink and be healthy: the Harvard Medical School guide to healthy eating. Free Press, New York, NY, USA
- World Health Organization [WHO]. 2019. Micronutrient Deficiencies: Vitamin A Deficiency. World Health Organization, Geneva, Switzerland
Edited by
Publication Dates
-
Publication in this collection
24 Aug 2020 -
Date of issue
2021
History
-
Received
03 Dec 2019 -
Accepted
25 Mar 2020