ABSTRACT:
In Brazil several digital soil class mapping studies were carried out from 2006 onwards to maximize the use of existing maps and information and to provide estimates for wider areas. However, there is no consensus on which methods have produced superior results in the predictive value of soil maps. This study conducts a systematic review of digital soil class mapping in Brazil and aims to analyze the factors which can improve the accuracy of digital soil class maps. Data from 334 digital soil class mapping studies were grouped and analyzed by Student's t-test, Wilcoxon-Mann-Whitney test and Kruskal-Wallis test. When conventional maps were used for validation, the studies showed average values of 63 % and when field samples were used, 56 % for Overall Accuracy. Studies compatible with the Planimetric Cartographic Accuracy Standard for Digital Cartographic Products (PEC-PCD) averaged between 4 % and 15 % higher accuracy than those of the incompatible group. There seems to be no evidence that increasing the number of variables and samples results in more accurate soil map prediction, but studies using variables related to four soil-forming factors enhanced accuracy. From a density of 0.08 MU km–2 and upwards, it became more difficult for studies to obtain greater accuracy. Artificial neural network classifiers and Decision Tree models seem to be producing more accurate digital soil class maps.
Keywords:
pedology; mapping unit density; artificial neural networks; soil-forming factors; overall accuracy
Introduction
Soil maps are crucial to environmental and agricultural management but conventional soil mapping is costly and time-consuming and existing soil maps are lacking in details. In the past few decades, digital soil mapping (DSM) methods have been tested and analyzed by the scientific community to maximize both the use of existing maps and information and to provide estimates for wider areas.
There is geographic variation in the uptake of digital soil mapping technologies and certain countries have made considerable progress. However, Minasny and McBratney (2016)Minasny, B.; McBratney, A.B. 2016. Digital soil mapping: a brief history and some lessons. Geoderma 264: 301-311. https://doi.org/10.1016/j.geoderma.2015.07.017
https://doi.org/10.1016/j.geoderma.2015....
and Arrouays et al. (2017)Arrouays, D.; Lagacherie, P.; Hartemink, A.E. 2017. Digital soil mapping across the globe. Geoderma Regional 9: 1-4. https://doi.org/10.1016/j.geodrs.2017.03.002
https://doi.org/10.1016/j.geodrs.2017.03...
, found that methodologies and assessment of DSM results need to be standardized, errors should be minimized and better evaluated, and strategies devised to overcome the lack of detailed cartographic bases and dearth of soil maps and data.
Recent reviews indicate other challenges such as soil mapping of flat terrains, simulation of the soil heterogeneity on a regional scale, linking DSM and soil spectroscopy (Zhang et al., 2017Zhang, G.-L.; Liu, F.; Song, X.-D. 2017. Recent progress and future prospect of digital soil mapping: a review. Journal of Integrative Agriculture 16: 2871-2885. https://doi.org/10.1016/S2095-3119(17)61762-3
https://doi.org/10.1016/S2095-3119(17)61...
) and the use of process-based soil-landscape evolution modelling with interactions between pedology and DSM (Ma et al., 2019Ma, Y.; Minasny, B.; Malone, B.P.; Mcbratney, A.B. 2019. Pedology and digital soil mapping (DSM). European Journal of Soil Science 70: 216-235. https://doi.org/10.1111/ejss.12790
https://doi.org/10.1111/ejss.12790...
).
Studies of digital soil class mapping in Brazil began in 2006 (Giasson et al., 2006Giasson, E.; Clarke, R.T.; Vasconcellos, A.; Junior, I.; Henrique, G.; Tornquist, C.G. 2006. Digital soil mapping using multiple logistic regression on terrain parameters in southern Brazil. Scientia Agricola 63: 262-268. https://doi.org/10.1590/S0103-90162006000300008
https://doi.org/10.1590/S0103-9016200600...
) and were re-analyzed six years later by Ten Caten et al. (2012) who found an agreement average of 48 % (Kappa coefficient) in 11 articles. Overall accuracy (OA) was not analyzed and the classifiers most used were logistic regressions, though there is no consensus on which methods have shown better results in the prediction of soil maps.
Cancian et al. (2018)Cancian, L.C.; Dalmolin, R.S.D.; Ten Caten, A. 2018. Bibliometric analysis for pattern exploration in worldwide digital soil mapping publications. Anais da Academia Brasileira de Ciências 90: 3911-3923. https://doi.org/10.1590/0001-3765201820180423
https://doi.org/10.1590/0001-37652018201...
, conducted a bibliometric analysis of the scientific production of DSM in the period from 1996 to 2017 and perceived that publications are increasing and that Brazilian research is gaining prominence on the world stage. The authors found approximately 200 researchers working with DSM in Brazil.
Those who intend to produce digital maps of soil classes can refer to publications that test different classifiers, sets of predictor variables and sample size. However, there is no study that presents the data from these publications in an integrated and systematic way.
In this study we sought to produce information from data from several publications to assist in decision making for those who want to produce digital soil maps. The aim was to analyze the factors used in digital soil class mapping and to assess the accuracy of the studies based on a systematic review of articles published between 2006 and 2019 in Brazil.
Materials and Methods
Bibliographic survey
The following criteria were used for a systematic survey of articles (inclusion criteria): a) study area in Brazil, to analyze results of the Brazilian approach in studies of digital mapping of soil classes; b) period: from 2006 to 2019; c) study objective: digital soil class mapping; d) articles with quantitative validation; and e) articles that used supervised learning methods such as: Support Vector Machines, Artificial Neural Networks, naïve Bayes, Logistic Regression and Decision Trees.
The following articles were excluded (exclusion criteria): a) articles whose study objective was the digital mapping of soil attributes or soil polygon disaggregation mapping; b) articles with no spatial soil class prediction using classification algorithms (e.g., map algebra) and/or mapping units (MU) delimited manually; c) articles with only qualitative validation of spatial soil class prediction; and d) articles that used unsupervised classification methods (clustering) and Fuzzy Logic because the process of modelling is very different from supervised learning methods that are the focus of this study.
Two electronic libraries were used for this study a) Portal de Periódicos CAPES (Coordination for the Improvement of Higher Education Personnel) and b) SciELO (Scientific Electronic Library Online). These are electronic libraries financed by public funds to promote free access of scientific journals. The Portal de Periódicos CAPES offers free access for professors, researchers, students and employees of participating institutions such as all federal institutions of Brazilian higher education among others. The SciELO promotes free public access to scientific journals from developing countries. Currently, Portal de Periódicos CAPES offers access to complete texts available in more than 38,000 national and international journals, while SciELO has 1,285 active journals.
For the moment and the objectives of this study, research in these two electronic libraries proved to be adequate. However, researchers are being encouraged to internationalize Brazilian research and for future studies it is worth considering consulting other databases as (e.g., Web of Science and Scopus).
The following strings and filters were used: a) topic: “Mapeamento Digital de Solos”; type of resource/literature: “article”; period: “2006 – 2019” (Surveys 1 and 3) and b) topic: “Digital Soil Mapping AND Brazil”; type of resource/literature: “article”; period: “2006 – 2019”; (Surveys 2 and 4).
All the articles from the survey were tabulated and analyzed. If an article met the inclusion criteria then it was included for participation in this study; if an article met the exclusion criteria then it was not included. The Mendeley Reference Manager (Dearden et al., 2011Dearden, P.; Kowalski, B.; Lowe, J.; Roland, R.; Surridge, M.; Thomas, S.; Jones, S. 2011. Mendeley Reference Manager. Mendeley Support Team, London, UK.) was used for bibliographic management.
Database
For the construction of the database, data of all studies contained in the articles were extracted. We consider all the soil class prediction tests carried in an article as studies; e.g., if in an article featured three learning algorithms were compared for prediction soil classes, then these tests were considered as three studies. The same occurs if two or more sets of predictor variables were compared or any tests that were performed that present the respective validation values. Thus, the result of this is a relationship of “one-to-many”; i.e., one article to many studies.
The following quantitative and qualitative data were extracted from the studies of the articles selected: a) year of publication; b) reference city of the study area; c) size of study area (km2); d) cartographic scale; e) number of mapping units; f) number of samples used in the predictive models (pixels from raster data of legacy map and/or points of fields observations); g) digital elevation model (DEM) used; h) pixel size (m); i) number of predictor variables used; j) learning algorithms; k) overall accuracy (%); and l) Kappa coefficient (%).
Data grouping
Reproducibility and exactness assessment groups
The studies were assigned to the reproducibility assessment group where they were validated using conventional maps. Once they were validated using points of field observations they were assigned to the exactness assessment group.
Soil-forming factors
All the predictor variables used in the selected articles were extracted and assigned to a soil-forming factor attribute such as climate, parent material, organisms, relief and time (Table 1). Thus, it was possible to calculate the number of soil-forming factors used in each study.
A number of the predictor variables have indirect or multiple-factor relationships with a soil-forming factor (Ma et al., 2019Ma, Y.; Minasny, B.; Malone, B.P.; Mcbratney, A.B. 2019. Pedology and digital soil mapping (DSM). European Journal of Soil Science 70: 216-235. https://doi.org/10.1111/ejss.12790
https://doi.org/10.1111/ejss.12790...
); in this study we associated variables that were directly related to a particular factor.
For the climate soil forming factor, predictor variables that influence temperature and soil moisture were assigned. For the parent material the characteristics of the mineral solid soil phase as well as the lithology of the environment used whereas for the organism the biological characteristics of the environment, and for relief the terrain model derivatives were used. For the time factor, only the geomorphic surface variable was used and this was used in two studies (Arruda et al., 2013Arruda, G.P.; Demattê, J.A.M.; Chagas, C.S. 2013. Digital soil mapping by artificial neural networks based on soil-landscape relationships. Revista Brasileira de Ciência do Solo 37: 327-338 (in Portuguese, with abstract in English). https://doi.org/10.1590/S0100-06832013000200004
https://doi.org/10.1590/S0100-0683201300...
and Arruda et al., 2016Arruda, G.P.; Demattê, J.A.M.; Chagas, C.S.; Fiorio, P.R.; Souza, A.B.; Fongaro, C.T. 2016. Digital soil mapping using reference area and artificial neural networks. Scientia Agricola 73: 266-273. https://doi.org/10.1590/0103-9016-2015-0131
https://doi.org/10.1590/0103-9016-2015-0...
).
The principal components were used as predictor variables for elevation, hydrology and curvature (Ten Caten et al., 2011aTen Caten, A.; Dalmolin, R.S.D.; Pedron, F.A.; Mendonça-Santos, M.L. 2011a. Multivariate analysis applied to reduce the number of predictors in digital soil mapping. Pesquisa Agropecuária Brasileira 46: 553-561 (in Portuguese, with abstract in English). https://doi.org/10.1590/S0100-204X2011000500014
https://doi.org/10.1590/S0100-204X201100...
), the only component characteristics explained by the authors were assigned to a soil-forming factors.
Compatibility with the Brazilian map accuracy standard
The Cartographic Accuracy Standard for Digital Cartographic Products (Padrão de Exatidão Cartográfica dos Produtos Cartográficos Digitais – PEC-PCD) is the Brazilian standard for the evaluation of the map accuracy published in the version 2.1.3 of the “Especificação Técnica para Aquisição de Dados Geoespaciais Vetoriais – ET-ADGV” (Diretoria de Serviço Geográfico, 2011Diretoria de Serviço Geográfico. Quartel General do Exército. 2011. Technical Specification for Geospatial Vector Data Acquisition (ET-ADGV) = Especificação Técnica para a Aquisição de Dados Geoespaciais Vetoriais (ET-ADGV). Diretoria de Serviço Geográfico, Brasília, DF, Brazil (in Portuguese).). According to this standard, digital products are classified into four classes (“A” – more accurate, “B”, “C” and “D” – less accurate) that indicate acceptable both altimetric and planimetric errors at different cartographic scales; e.g., for the scale 1:10,000 the PEC-PCD planimetric values are: 2.8 m (“A”), 5.0 m (“B”), 8.0 m (“C”) and 10.0 m (“D”). Thus, we infer the compatibility of the studies to the PEC-PCD planimetric by the pixel size and scale used; e.g., if a study used pixel size of 15 m and scale 1:10,000, it was considered incompatible with the PEC-PCD.
The studies were divided into groups of compatible and incompatible with PEC-PCD. In this study, the compatibility with planimetric PEC-PCD only indicates the studies that exhibited compatible scale and pixel size and not the positional precision of variables in relation to field coordinates.
Classifier groups
The studies were grouped according to the type of learning algorithms used. The list of all algorithms used in the studies and the types of classifiers to which they were associated are presented in the results and discussion item.
Statistical methods for comparing the groups
The method of Zuur et al. (2010)Zuur, A.F.; Ieno, E.N.; Elphick, C.S. 2010. A protocol for data exploration to avoid common statistical problems. Methods in Ecology and Evolution 1: 3-14. https://doi.org/10.1111/j.2041-210X.2009.00001.x
https://doi.org/10.1111/j.2041-210X.2009...
was used for exploratory data analysis which includes graphical observations and statistical tests in an R environment.
Overall accuracy data normality was tested by the Shapiro-Wilk and Kolmogorov-Smirnov statistical test, whereas Brown-Forsythe test (modified Levene test) was applied to analyze the homogeneity of variance.
When both normality and homogeneity assumptions were met, parametric tests were applied. The Student's t-test was used to compare the means between two groups.
Where both normality and homogeneity assumptions were not met, non-parametric tests were applied to the non-transformed data; i.e., the original overall accuracy data. The Wilcoxon-Mann-Whitney test was used to determine whether the distributions between two groups were equally located. The Kruskal-Wallis test was applied to verify if there were differences between three or more groups. When an inter-group difference was observed, the Dunn post-hoc test was used in each pair of groups.
Where the overall accuracy data met one of the assumptions (i.e., normality or homogeneity), they were transformed using the Box-Cox method (Box and Cox, 1964Box, G.; Cox, D. 1964. An analysis of transformations: applying the Box-Cox transformation. Journal of the Royal Satistical Society Series B 26: 211-252.). The transformed overall accuracy data were tested by the Shapiro-Wilk and Kolmogorov-Smirnov for test data normality; and the Brown-Forsythe for testing the homogeneity of variance. If both normality and homogeneity assumptions were met, parametric tests were applied to the transformed data; otherwise, non-parametric tests were applied to the non-transformed data.
Results and Discussion
Bibliographic analysis
We included 42 articles that met the requirements (i.e., inclusion and exclusion criteria) for participation in this study (Table 2). These articles contained 334 digital soil class mapping studies. The first digital soil class mapping article in Brazil was produced in the state of Rio Grande do Sul (Giasson et al., 2006Giasson, E.; Clarke, R.T.; Vasconcellos, A.; Junior, I.; Henrique, G.; Tornquist, C.G. 2006. Digital soil mapping using multiple logistic regression on terrain parameters in southern Brazil. Scientia Agricola 63: 262-268. https://doi.org/10.1590/S0103-90162006000300008
https://doi.org/10.1590/S0103-9016200600...
); the authors evaluated logistic regressions to reproduce soil maps from a reference area. More than half of all the articles were conducted in the state of Rio Grande do Sul (24), followed by São Paulo (7), Minas Gerais (6) and the state of Rio de Janeiro (5). In most of the country, no digital soil class mapping articles that meet the requirements for participation in this study have been conducted. An average of three articles per year were published during the study period (2006 to 2019).
Chronological list of selected articles that focus on digital soil class mapping in Brazil (2006-2019).
Descriptive statistics of the data extracted from the studies
The study areas varied from 1.75 km2 (175 ha) (Pelegrino et al., 2016Pelegrino, M.H.P.; Silva, S.H.G.; Menezes, M.D.; Silva, E.; Owens, P.R.; Curi, N. 2016. Mapping soils in two watersheds using legacy data and extrapolation for similar surrounding areas. Ciência e Agrotecnologia 40: 534-546. https://doi.org/10.1590/1413-70542016405011416
https://doi.org/10.1590/1413-70542016405...
) to approximately 120,000 km2, which represents 48 % of the state of São Paulo (Silvero et al., 2019Silvero, N.E.Q.; Siqueira, D.S.; Coelho, R.M.; Costa Ferreira, D.; Marques, J. 2019. Protocol for the use of legacy data and magnetic signature on soil mapping of São Paulo central west, Brazil. Science of The Total Environment 693: 133463. https://doi.org/10.1016/j.scitotenv.2019.07.269
https://doi.org/10.1016/j.scitotenv.2019...
). Approximately 50 % of the studies were conducted in areas up to 120 km2. There is no information about the cartographic scale size in 70 studies. In the 264 studies containing this information, 169 were at a scale 1:50,000. The most detailed cartographic scale was 1:10,000 used in 49 studies (Giasson et al. (2011)Giasson, E.; Sarmento, E.C.; Weber, E.; Flores, C.A.; Hasenack, H. 2011. Decision trees for digital soil mapping on subtropical basaltic steeplands. Scientia Agricola 68: 167-174. https://doi.org/10.1590/S0103-90162011000200006
https://doi.org/10.1590/S0103-9016201100...
; Sarmento et al. (2012)Sarmento, E.C.; Giasson, E.; Weber, E.; Flores, C.A.; Hasenack, H. 2012. Prediction of soil orders with high spatial resolution: Response of different classifiers to sampling density. Pesquisa Agropecuária Brasileira 47: 1395-1403. https://doi.org/10.1590/S0100-204X2012000900025
https://doi.org/10.1590/S0100-204X201200...
; Arruda et al. (2016)Arruda, G.P.; Demattê, J.A.M.; Chagas, C.S.; Fiorio, P.R.; Souza, A.B.; Fongaro, C.T. 2016. Digital soil mapping using reference area and artificial neural networks. Scientia Agricola 73: 266-273. https://doi.org/10.1590/0103-9016-2015-0131
https://doi.org/10.1590/0103-9016-2015-0...
; Pelegrino et al. (2016)Pelegrino, M.H.P.; Silva, S.H.G.; Menezes, M.D.; Silva, E.; Owens, P.R.; Curi, N. 2016. Mapping soils in two watersheds using legacy data and extrapolation for similar surrounding areas. Ciência e Agrotecnologia 40: 534-546. https://doi.org/10.1590/1413-70542016405011416
https://doi.org/10.1590/1413-70542016405...
; Wolski et al. (2017)Wolski, M.S.; Dalmolin, R.S.D.; Flores, C.A.; Moura-Bueno, J.M.; Ten Caten, A.; Kaiser, D.R. 2017. Digital soil mapping and its implications in the extrapolation of soil-landscape relationships in detailed scale. Pesquisa Agropecuária Brasileira 52: 633-642. https://doi.org/10.1590/S0100-204X2017000800009
https://doi.org/10.1590/S0100-204X201700...
). The number of MU varied, using a simplified legend, (Figueiredo et al., 2008Figueiredo, S.R.; Giasson, E.; Tornquist, G.C.; Nascimento, P.C. 2008. Multiple logistic regression applied to soil survey in Rio Grande do Sul state, Brazil. Revista Brasileira de Ciência do Solo 32: 2779-2785 (in Portuguese, with abstract in English).), between 3 and 34 (Vasques et al., 2015Vasques, G.M.; Demattê, J.A.M.; Viscarra Rossel, R.A.; Ramírez López, L.; Terra, F.S.; Rizzo, R.; Souza Filho, C.R. 2015. Integrating geospatial and multi-depth laboratory spectral data for mapping soil classes in a geologically complex area in southeastern Brazil. European Journal of Soil Science 66: 767-779. https://doi.org/10.1111/ejss.12255
https://doi.org/10.1111/ejss.12255...
; Silvero et al., 2019Silvero, N.E.Q.; Siqueira, D.S.; Coelho, R.M.; Costa Ferreira, D.; Marques, J. 2019. Protocol for the use of legacy data and magnetic signature on soil mapping of São Paulo central west, Brazil. Science of The Total Environment 693: 133463. https://doi.org/10.1016/j.scitotenv.2019.07.269
https://doi.org/10.1016/j.scitotenv.2019...
) with an average of 9.5 MU per study. About 75 % of the studies had a ratio of up to approximately 0.4 MU km–2 but one study carried out by Pelegrino et al. (2016)Pelegrino, M.H.P.; Silva, S.H.G.; Menezes, M.D.; Silva, E.; Owens, P.R.; Curi, N. 2016. Mapping soils in two watersheds using legacy data and extrapolation for similar surrounding areas. Ciência e Agrotecnologia 40: 534-546. https://doi.org/10.1590/1413-70542016405011416
https://doi.org/10.1590/1413-70542016405...
stands out for its high ratio of 2.8 MU km–2, with a study area of 1.75 km2 and five soil classes.
The median number of samples was 2,463. The lowest number of samples (74) was found in studies that used field observations for spatial soil class prediction models based on Decision Trees and Logistic Regression algorithms (Silva et al., 2019Silva, B.P.C.; Silva, M.L.N.; Avalos, F.A.P.; de Menezes, M.D.; Curi, N. 2019. Digital soil mapping including additional point sampling in Posses ecosystem services pilot watershed, southeastern Brazil. Scientific Reports 9: 1-12. https://doi.org/10.1038/s41598-019-50376-w
https://doi.org/10.1038/s41598-019-50376...
). Nevertheless, in this article the authors conducted other studies with additional points that improved the prediction performance of each model. The largest number of samples (794,273) was found in a study conducted by Crivelenti et al. (2009)Crivelenti, R.C.; Coelho, R.M.; Adami, S.F.; Oliveira, S.R.M. 2009. Data mining to infer soil-landscape relationships in digital soil mapping. Pesquisa Agropecuária Brasileira 44: 1707-1715 (in Portuguese, with abstract in English). https://doi.org/10.1590/S0100-204X2009001200021
https://doi.org/10.1590/S0100-204X200900...
that used pixels from raster data to spatial soil class prediction models based on Decision Tree models.
The highest number of samples per area was 10,024 per km2, in a study by Pelegrino et al. (2016)Pelegrino, M.H.P.; Silva, S.H.G.; Menezes, M.D.; Silva, E.; Owens, P.R.; Curi, N. 2016. Mapping soils in two watersheds using legacy data and extrapolation for similar surrounding areas. Ciência e Agrotecnologia 40: 534-546. https://doi.org/10.1590/1413-70542016405011416
https://doi.org/10.1590/1413-70542016405...
, when the authors used 17,542 samples in an area of 1.75 km2. Nevertheless, Dias et al. (2016)Dias, L.M.S.; Coelho, R.M.; Valladares, G.S.; Assis, A.C.C.; Ferreira, E.P.; Silva, R.C. 2016. Soil class prediction by data mining in an area of the sedimentary São Francisco basin. Pesquisa Agropecuária Brasileira 51: 1396-1404 (in Portuguese, with abstract in English). https://doi.org/10.1590/s0100-204x2016000900038
https://doi.org/10.1590/s0100-204x201600...
used 1,710 samples in an area of 1,100 km2. In both studies, pixels from raster data were used as samples. The size of the study area and the number of samples are not correlated (Pearson (r = 0.01)) which may reveal the lack of standardization in digital soil mapping (Ten Caten et al., 2012; Minasny and McBratney, 2016Minasny, B.; McBratney, A.B. 2016. Digital soil mapping: a brief history and some lessons. Geoderma 264: 301-311. https://doi.org/10.1016/j.geoderma.2015.07.017
https://doi.org/10.1016/j.geoderma.2015....
; Arrouays et al., 2017Arrouays, D.; Lagacherie, P.; Hartemink, A.E. 2017. Digital soil mapping across the globe. Geoderma Regional 9: 1-4. https://doi.org/10.1016/j.geodrs.2017.03.002
https://doi.org/10.1016/j.geodrs.2017.03...
).
A mean of nine predictor variables were used per study; i.e., the variables selected and used in the predictive models per study. The maximum number of variables used in the same study was 43 (Silva et al., 2019Silva, B.P.C.; Silva, M.L.N.; Avalos, F.A.P.; de Menezes, M.D.; Curi, N. 2019. Digital soil mapping including additional point sampling in Posses ecosystem services pilot watershed, southeastern Brazil. Scientific Reports 9: 1-12. https://doi.org/10.1038/s41598-019-50376-w
https://doi.org/10.1038/s41598-019-50376...
); on the other hand, in one of the studies (Pelegrino et al., 2016Pelegrino, M.H.P.; Silva, S.H.G.; Menezes, M.D.; Silva, E.; Owens, P.R.; Curi, N. 2016. Mapping soils in two watersheds using legacy data and extrapolation for similar surrounding areas. Ciência e Agrotecnologia 40: 534-546. https://doi.org/10.1590/1413-70542016405011416
https://doi.org/10.1590/1413-70542016405...
) only two variables were used (aspect and wetness index) obtaining overall accuracy of 50 %.
Of the 334 studies, 263 presented cartographic scale and spatial resolution (pixel size) information used (Table 3); 38 studies were found incompatible with the planimetric PEC-PCD, since their pixel size is higher than that indicated at the cartographic scale.
Learning algorithms and types of classifiers
The following learning algorithms were used in the selected articles: Bagged AdaBag, BF Tree, C5 Decision Tree, CART, ExtraTree, J48, Logistic Model Trees, Maximum Likelihood, Multinomial Logistic Regression, Multilayer Perceptron, PART, Random Forest, Ranger Random Forest, Rep Tree, Support Vector Machine with Linear Kernel, Support Vector Machine with Polynomial Kernel, Weighted Subspace Random Forest -WSRF and xgBoost.
All learning algorithms were assigned to a type of classifier such as Artificial Neural Network (ANN), Bayes classifiers, Decision Tree (DT), Logistic Regression (LR) and Support Vector Machine (SVM). Approximately 95 % of the studies used DT, ANN and LR classifiers (Table 4).
Digital soil map validation
Overall accuracy and Kappa coefficient
Of the 334 studies, the OA was used in 320 (96 %) while the Kappa was used in 190 (57 %). Although we do know that Kappa is often seen as problematic, if not flawed, because of a past attempt to compare accuracy to a baseline of randomness (Pontius and Millones, 2011Pontius, R.G.; Millones, M. 2011. Death to Kappa: birth of quantity disagreement and allocation disagreement for accuracy assessment. International Journal of Remote Sensing 32: 4407-4429. https://doi.org/10.1080/01431161.2011.552923
https://doi.org/10.1080/01431161.2011.55...
), we analyzed it taking into account its frequent use in studies of digital mapping of soil classes.
The OA and Kappa medians were 62 % and 48 % of agreement respectively. The estimated population confidence interval for the OA median was 59 % to 63 % (CI (95 %) = 59 % - 63 %). The Kappa value remained the same as that found by Ten Caten et al., 2012) when carrying out an evaluation of 11 Brazilian studies of digital mapping of soil classes.
The agreement variation in the Kappa is higher than the OA; the OA agreement probability density is higher than the Kappa as shown by the shape of the plot (Figure 1). The OA outliers are those below 23 %, as identified in articles by Chagas et al. (2010)Chagas, C.S.; Filho, E.I.F.; Vieira, C.A.O.; Schaefer, C.E.G.R.; Carvalho Júnior, W. 2010. Topographic attributes and Landsat7 data in the digital soil mapping using neural networks. Pesquisa Agropecuária Brasileira 45: 497-507 (in Portuguese, with abstract in English). https://doi.org/10.1590/S0100-204X2010000500009
https://doi.org/10.1590/S0100-204X201000...
, Vasques et al. (2015)Vasques, G.M.; Demattê, J.A.M.; Viscarra Rossel, R.A.; Ramírez López, L.; Terra, F.S.; Rizzo, R.; Souza Filho, C.R. 2015. Integrating geospatial and multi-depth laboratory spectral data for mapping soil classes in a geologically complex area in southeastern Brazil. European Journal of Soil Science 66: 767-779. https://doi.org/10.1111/ejss.12255
https://doi.org/10.1111/ejss.12255...
, Pelegrino et al. (2016)Pelegrino, M.H.P.; Silva, S.H.G.; Menezes, M.D.; Silva, E.; Owens, P.R.; Curi, N. 2016. Mapping soils in two watersheds using legacy data and extrapolation for similar surrounding areas. Ciência e Agrotecnologia 40: 534-546. https://doi.org/10.1590/1413-70542016405011416
https://doi.org/10.1590/1413-70542016405...
and Silva et al. (2019)Silva, B.P.C.; Silva, M.L.N.; Avalos, F.A.P.; de Menezes, M.D.; Curi, N. 2019. Digital soil mapping including additional point sampling in Posses ecosystem services pilot watershed, southeastern Brazil. Scientific Reports 9: 1-12. https://doi.org/10.1038/s41598-019-50376-w
https://doi.org/10.1038/s41598-019-50376...
.
Reproducibility and exactness assessment for Overall Accuracy
When conventional maps were used for validation (reproducibility assessment group), the studies showed average values of 63 % for OA; when field samples were used for validation (exactness assessment group), the studies showed average values of 56 %.
Through the Box - Cox transformation of the OA data, it was possible to use parametric testing for the reproduction and accuracy groups. Student's t-test results (t (150.53) = 3.73, p < 0.05)) indicates that the two validation groups are different and with a 95 % confidence interval the difference between estimated population means was 4 % and 12 %.
These findings indicate that the digital soil maps generated tend to have higher agreement in reproducibility than in exactness assessment; i.e., they were more accurate in reproducing legacy maps than representing actual soil distribution. That is understandable because when the legacy maps are used for training prediction models, the soil mapping units already correspond to well-identified landscape units, which makes adding more precise and up-to-date predictor variables useful to producing a better map (Ma et al., 2019Ma, Y.; Minasny, B.; Malone, B.P.; Mcbratney, A.B. 2019. Pedology and digital soil mapping (DSM). European Journal of Soil Science 70: 216-235. https://doi.org/10.1111/ejss.12790
https://doi.org/10.1111/ejss.12790...
).
Furthermore, the conventional maps used for validation are composed of polygons of MU and there is a relationship of “one-to-many”; i.e., one MU to many classified pixels. The validation by field data is usually performed by points and there is a relationship of “one-to-one”; i.e., one point to one classified pixel. In this way, validation by conventional maps increases the chances of random classification hits occurring within an MU. In addition, in the validation by field data any positional inaccuracy both of the points and that of predictor variables can compromise the validation. Therefore, the evaluation of the reproducibility is not enough to evaluate the exactness of predicted maps. For that, field data is necessary.
Factors affecting the overall accuracy
Environmental factors
There is a small correlation between the OA values and the size of the study area (Pearson (r = 0.18)); Spearman (ρ = 0.23). There is no correlation between the OA values and number of MUs (Pearson (r = −0.08); Spearman (ρ = 0.03)). These results suggest a random or practically non-existent association between the OA and the size of the study area and the number of mapping units. These results are different from those found by Brungard et al. (2015)Brungard, C.W.; Boettinger, J.L.; Duniway, M.C.; Wills, S.A.; Edwards, T.C. 2015. Machine learning for predicting soil classes in three semi-arid landscapes. Geoderma 239: 68-83. https://doi.org/10.1016/j.geoderma.2014.09.019
https://doi.org/10.1016/j.geoderma.2014....
i.e., that machine learning models are most accurate when there are just a few soil classes.
To verify the effect of the two variables (the size of the study area and number of MUs) representing the density per km2 (MU km–2), the k-means technique was applied to perform iterative data segmentation. After the tests, the data were partitioned into 15 groups (clusters) (Table 5).
As densities (MU km–2) increase beyond the cluster 9 (lower limit = 0.08; centroid = 0.09; upper limit = 0.12), the OA is lower in most studies (Figure 2). Except for cluster 13, those above 9 showed a median OA below the lower limit of the estimated population confidence interval for the OA median (CI (95 %) = 59 % - 63 %). On the other hand, for clusters below 9, the median OA in the studies are predominantly higher or within the estimated population confidence interval, except for cluster 4, whose median was below the CI (95 %). Approximately 50 % of the studies are in clusters 1 to 9 and 50 % between clusters 9 and 15. The density values (MU km–2) depend on the scale work and relate to the environmental complexity. The results indicate that the higher environmental complexity (with 0.08 MU km–2 or more) has a negative effect on the accuracy of the predicted maps.
Modelling factors
Scale and pixel size
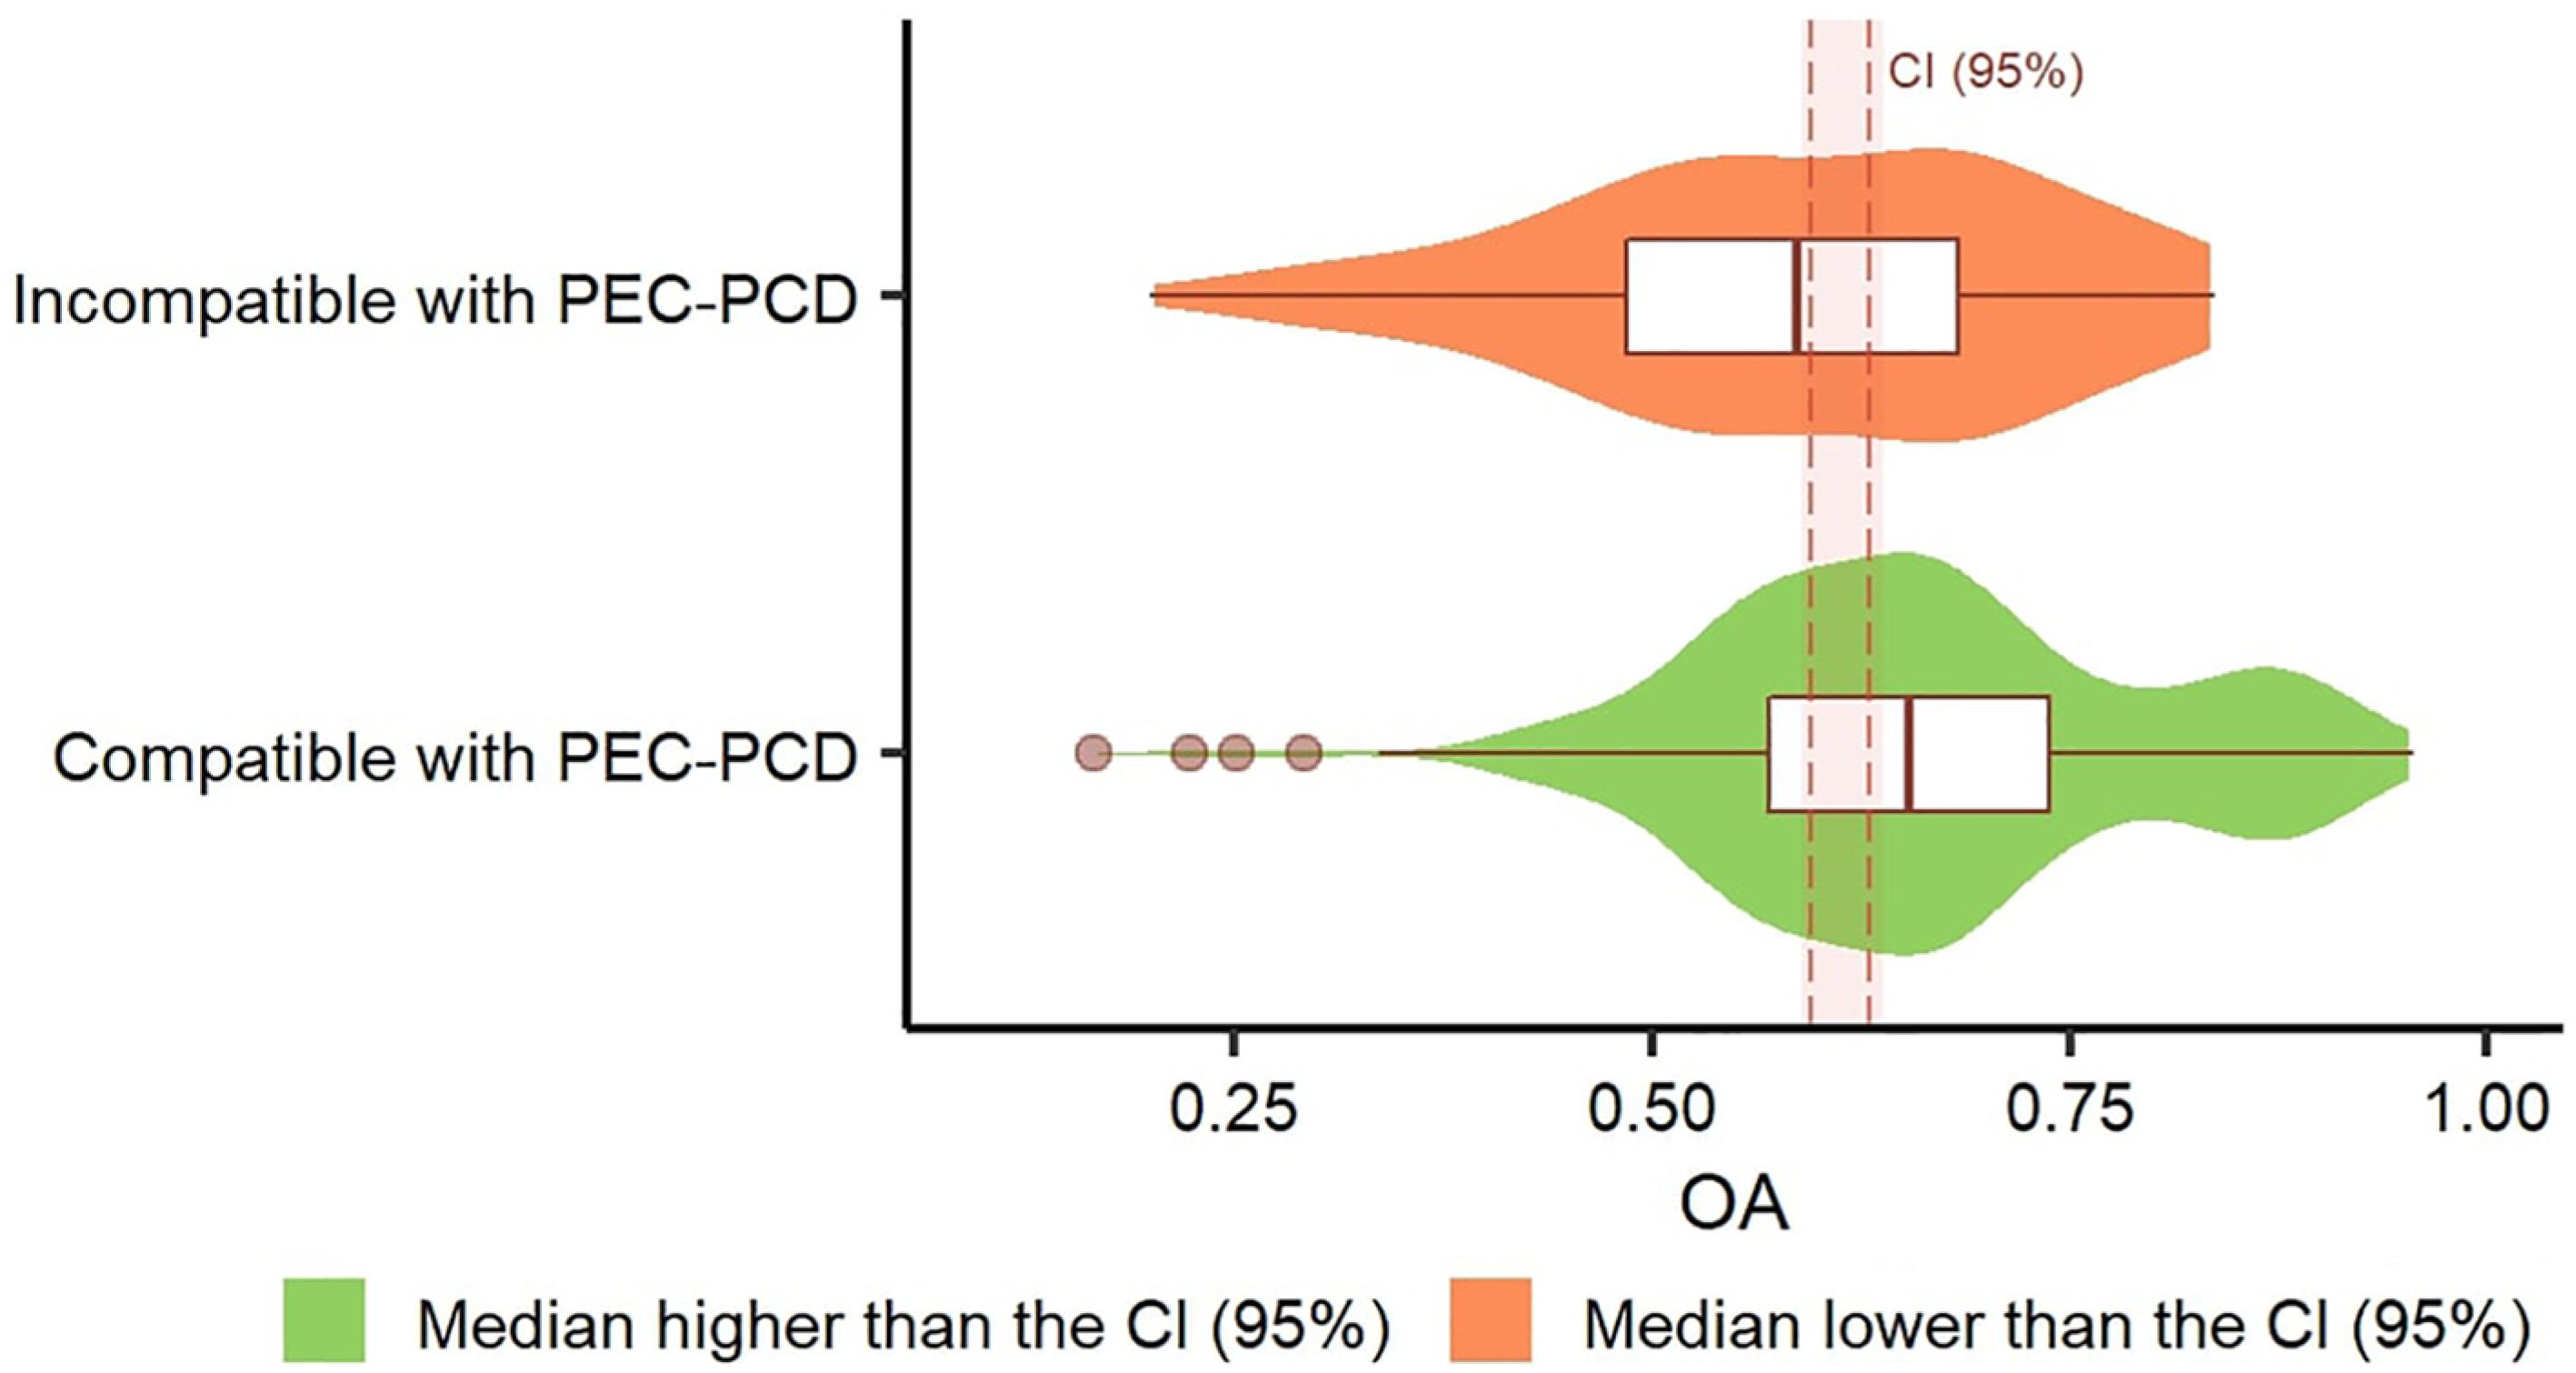
Of the studies with information available on the cartographic scale and pixel size, validated by the OA index, 85 % used spatial resolution compatible and 15 % incompatible with the planimetric PEC-PCD.
The result of the Wilcoxon Mann Whitney test (p < 0.05) suggests that the OA of the population median for the group of studies compatible with the PEC-PCD is higher than that of the incompatible group. The shape of the plot suggests that the OA probability density for the group of studies compatible with the PEC-PCD is higher than the CI (95 %) (Figure 3). The inter-group difference in the estimated population median is between 2 % and 12 % with a 95 % CI.
Relation between the OA results for groups of studies that used spatial resolution compatible and incompatible with PEC-PCD.
Sample size and density
There is no correlation between OA values and the number of samples (r = 0.04). Neither is there between OA values and sample density per km2 (r = −0.08). In a study that aimed to extrapolate the soil map (Grinand et al., 2008Grinand, C.; Arrouays, D.; Laroche, B.; Martin, M.P. 2008. Extrapolating regional soil landscapes from an existing soil map: Sampling intensity, validation procedures, and integration of spatial context. Geoderma 143: 180-190. https://doi.org/10.1016/j.geoderma.2007.11.004
https://doi.org/10.1016/j.geoderma.2007....
) the authors found that the increase in the number of samples improved prediction accuracy, whereas the increase in sample density did not improve accuracy.
It is important to underscore that these results are restricted only to sample number and density and not to sampling method. As such, prediction map agreement is associated with environmental and modelling factors which may include sampling methods.
Number of predictor variables and of soil-forming factor
There is no correlation between OA results and the number of predictor variables used (Spearman (ρ = −0.02); Pearson (r = 0.20)). The association between predictor variables and the respective soil-forming factor (Table 1) results in the number of formation factors used per study: a) only one formation factor (7 % of the studies); b) two factors (49 %); c) three factors (33 %); d) four factors (5 %); and e) no information available (6 %). None of the studies was associated with five soil-forming factors. There is a trend to higher OA results as the number of formation factors and variables increased (Figure 4A and B).
Relation between the OA and number of predictor variables used (A); relation between the OA and number of soil-forming factors used (B).
The result of the Kruskal-Wallis test (H (3) = 28.91, p < 0.05) indicated a difference between the groups of studies in which different numbers of soil-forming factors were used. The results of Dunn's post-hoc test indicated differences between groups with one and two, one and three, one and four, two and four, three and four formation factors (p < 0.05) and equality between those with two and three formation factors (p > 0.05).
The results indicate that the techniques applied in the set of studies analyzed here are sensitive to the conceptual structure given by the paradigm of soil-forming factors adapted to digital soil mapping using the scorpan model (McBratney et al., 2003McBratney, A.B.; Mendonça Santos, M.L.; Minasny, B. 2003. On digital soil mapping. Geoderma 117: 3-52. https://doi.org/10.1016/S0016-7061(03)00223-4
https://doi.org/10.1016/S0016-7061(03)00...
). The more completely the scorpan model is applied, the better the results obtained.
Classifiers
Due to the greater representativeness (95 % of studies), we compared the OA results of the following groups of classifiers: Decision Trees (DT; mean = 62 %; median = 63 %), Artificial Neural Network (ANN; mean = 67 %; median = 68 %) and Logistic Regressions (LR; mean = 45 %; median = 43 %). The results of the Kruskal-Wallis test (H (2) = 62.34, p < 0.05) indicated a difference between the groups analyzed. The results of Dunn's post-hoc test indicated that the OA is different between LR and DT, LR and ANN (p < 0.05) but between DT and ANN (p > 0.05) there is no difference. Figure 5 shows that the group of studies that used ANN had a median OA higher than the estimated populational CI (95 %). However, there is no evidence that ANN models are better than DT models. On the other hand, there is evidence that ANN and DT models are better than LR for predicting soil classes. An evaluation of the prediction models of soil properties (Khaledian and Miller, 2020Khaledian, Y.; Miller, B.A. 2020. Selecting appropriate machine learning methods for digital soil mapping. Applied Mathematical Modelling 81: 401-418. https://doi.org/10.1016/j.apm.2019.12.016
https://doi.org/10.1016/j.apm.2019.12.01...
) concluded that there is no one single correct learning algorithm. However, certain algorithms are more appropriate than others considering the purpose of the mapping. According to the authors, if the sample size is large, ANN would likely produce the best results. When interpretability of the resulting model is important LR and DT are more appropriate than others. Brungard et al. (2015)Brungard, C.W.; Boettinger, J.L.; Duniway, M.C.; Wills, S.A.; Edwards, T.C. 2015. Machine learning for predicting soil classes in three semi-arid landscapes. Geoderma 239: 68-83. https://doi.org/10.1016/j.geoderma.2014.09.019
https://doi.org/10.1016/j.geoderma.2014....
compared 11 learning algorithms and concluded that ANN and SVM were consistently more accurate than LR and DT algorithms.
Relation between the main classifiers used and OA values. LR = Logistic Regression; DT = Decision Tree; ANN = Artificial Neural Network.
Relationship between environmental and modelling factors
The results obtained in the present study demonstrate that the following factors determine higher OA values: a) density up to 0.08 MU km–2; b) spatial resolution and scale compatible with planimetric PEC-PCD; c) use of four or more soil-forming factors associated with predictor variables; and d) use of ANN and DT classifiers.
Among these factors, only the density of MU km–2 is an environmental factor, which cannot be controlled by the user. The other factors are related to the modelling of digital soil class mapping, which are controlled by the user.
Graphical analyses (Figure 6) and statistical tests were used to determine the possibility of bias in establishing the main factors, that is, to confirm if any modelling-related factor obtained a better OA because they were primarily distributed into lower MU km–2 values.
Relation between the density of mapping units per area and compatibility with PEC-PCD, number of soil-forming factors and group of classifiers.
For the group of compatibility with PEC-PCD, there is a greater concentration of studies compatible in higher densities of MU km–2. This indicates that there is no bias and reinforces the importance of using pixel sizes appropriate to the working scale to obtain better OA values.
For the groups of soil-forming factors and of classifiers, visual analysis was not conclusive. As such, a statistical test was necessary to determine whether the groups exhibited similar value variations in MU km–2.
According to the Wilcoxon-Mann-Whitney (p > 0.05), data from the group with four soil-forming factors does not differ from the group with up to three factors in relation to MU km–2, and does not, therefore, exhibit low density concentration bias. Thus, it can be considered an important factor in the improvement in soil prediction map agreement.
According to the Kruskal-Wallis test (H (2) = 18.68, p < 0.05), the classifier groups differ in relation to MU km–2. The results of Dunn's post-hoc test indicated that there is no difference between LR and ANN (p > 0.05). Between DT and LR, DT and ANN there are differences. These findings indicate that the ANN performed better even though they were tested at higher densities of MU per area. In addition, the good results of the DT models may have had bias because most studies occurred in areas with lower environmental complexity.
Conclusions
Based on digital soil class mapping studies in Brazil conducted between 2006 and 2019 and considering that this is a small database, the results of this study may not be definitive, and the following can be concluded:
The mean overall accuracy of the group of studies that used pixel size and cartographic scale compatible with planimetric PEC-PCD is greater than that of the group which did not use spatial resolution compatible with PEC-PCD.
There is no evidence that an increase in the number of samples and predictor variables results in more accurate soil map prediction. On the other hand, there is evidence that the use of more heterogeneous predictor variables in terms of soil-forming factors could result in improved accuracy.
The density of MU per area affects the agreement of prediction maps. From a density of 0.08 MU km–2 and upwards, it was more difficult for studies to obtain better overall accuracy values than their estimated population median counterparts.
There is evidence that ANN classifiers are more efficient than the LR in terms of predicting soil classes. There is no evidence that ANN are more efficient than the DT. However, high precision DT accuracy may have been achieved because the majority of tests were performed in areas of lower MU km–2; i.e., less environmental complexity.
Acknowledgments
This study was financed in part by the Coordination for the Improvement of Higher Level Personnel (CAPES) – Finance Code 001.
References
- Arrouays, D.; Lagacherie, P.; Hartemink, A.E. 2017. Digital soil mapping across the globe. Geoderma Regional 9: 1-4. https://doi.org/10.1016/j.geodrs.2017.03.002
» https://doi.org/10.1016/j.geodrs.2017.03.002 - Arruda, G.P.; Demattê, J.A.M.; Chagas, C.S. 2013. Digital soil mapping by artificial neural networks based on soil-landscape relationships. Revista Brasileira de Ciência do Solo 37: 327-338 (in Portuguese, with abstract in English). https://doi.org/10.1590/S0100-06832013000200004
» https://doi.org/10.1590/S0100-06832013000200004 - Arruda, G.P.; Demattê, J.A.M.; Chagas, C.S.; Fiorio, P.R.; Souza, A.B.; Fongaro, C.T. 2016. Digital soil mapping using reference area and artificial neural networks. Scientia Agricola 73: 266-273. https://doi.org/10.1590/0103-9016-2015-0131
» https://doi.org/10.1590/0103-9016-2015-0131 - Bagatini, T.; Giasson, E.; Teske, R. 2016. Expanding pedological maps to physiographically similar areas with digital soil mapping. Pesquisa Agropecuária Brasileira 51: 1317-1325 (in Portuguese, with abstract in English). https://doi.org/10.1590/S0100-204X2016000900031
» https://doi.org/10.1590/S0100-204X2016000900031 - Bagatini, T.; Giasson, E.; Teske, R. 2015. Selection of sampling density based on data from areas already mapped for training decision tree models in digital soil mapping. Revista Brasileira de Ciência do Solo 39: 960-967 (in Portuguese, with abstract in English). https://doi.org/10.1590/01000683rbcs20140289
» https://doi.org/10.1590/01000683rbcs20140289 - Box, G.; Cox, D. 1964. An analysis of transformations: applying the Box-Cox transformation. Journal of the Royal Satistical Society Series B 26: 211-252.
- Brungard, C.W.; Boettinger, J.L.; Duniway, M.C.; Wills, S.A.; Edwards, T.C. 2015. Machine learning for predicting soil classes in three semi-arid landscapes. Geoderma 239: 68-83. https://doi.org/10.1016/j.geoderma.2014.09.019
» https://doi.org/10.1016/j.geoderma.2014.09.019 - Calderano Filho, B.; Polivanov, H.; Chagas, C.S.; Carvalho Júnior, W.; Barroso, E.V.; Guerra, A.J.T.; Calderano, S.B. 2014. Artificial Neural Networks Applied for Soil Class Prediction in Mountainous Landscape of the Serra Do Mar. Revista Brasileira de Ciência do Solo 38: 1681-1693. http://dx.doi.org/10.1590/S0100-06832014000600003
» http://dx.doi.org/10.1590/S0100-06832014000600003 - Campos, A.R.; Giasson, E.; Costa, J.J.F.; Coelho, F.F. 2019a. Prediction of soil classes with data collected in buffers delimited pixels in georeferenced soil profiles. Revista Brasileira de Ciências Agrarias 14: e5653 (in Portuguese, with abstract in English). https://doi.org/10.5039/agraria.v14i2a5653
» https://doi.org/10.5039/agraria.v14i2a5653 - Campos, A.R.; Giasson, E.; Costa, J.J.F.; Machado, I.R.; Silva, E.B.; Bonfatti, B.R. 2019b. Selection of environmental covariates for classifier training applied in digital soil mapping. Revista Brasileira de Ciência do Solo 42: e0170414. https://doi.org/10.1590/18069657rbcs20170414
» https://doi.org/10.1590/18069657rbcs20170414 - Cancian, L.C.; Dalmolin, R.S.D.; Ten Caten, A. 2018. Bibliometric analysis for pattern exploration in worldwide digital soil mapping publications. Anais da Academia Brasileira de Ciências 90: 3911-3923. https://doi.org/10.1590/0001-3765201820180423
» https://doi.org/10.1590/0001-3765201820180423 - Carvalho Júnior, W.; Chagas, C.S.; Filho, E.I.F.; Vieira, C.A.O.; Schaefer, C.E.G.; Bhering, S.B.; Francelino, M.R. 2011. Digital soilscape mapping of tropical hillslope areas by neural networks. Scientia Agricola 68: 691-696. https://doi.org/10.1590/S0103-90162011000600014
» https://doi.org/10.1590/S0103-90162011000600014 - Chagas, C.S.; Oliveira, C.A.; Fernandes, E.I. 2013. Comparison between artificial neural networks and maximum likelihood classification in digital soil mapping. Revista Brasileira de Ciência do Solo 37: 339-351.
- Chagas, C.S.; Pinheiro, H.S.K.; Carvalho Junior, W.; Anjos, L.H.C.; Pereira, N.R.; Bhering, S.B. 2017. Data mining methods applied to map soil units on tropical hillslopes in Rio de Janeiro, Brazil. Geoderma Regional 9: 47-55. https://doi.org/10.1016/j.geodrs.2017.03.004
» https://doi.org/10.1016/j.geodrs.2017.03.004 - Chagas, C.S.; Carvalho Júnior, W.; Bhering, S.B. 2011. Integration of Quickbird data and terrain attributes for digital soil mapping by artificial neural networks. Revista Brasileira de Ciência do Solo 35: 693-704 (in Portuguese, with abstract in English). https://doi.org/10.1590/S0100-06832011000300004
» https://doi.org/10.1590/S0100-06832011000300004 - Chagas, C.S.; Filho, E.I.F.; Vieira, C.A.O.; Schaefer, C.E.G.R.; Carvalho Júnior, W. 2010. Topographic attributes and Landsat7 data in the digital soil mapping using neural networks. Pesquisa Agropecuária Brasileira 45: 497-507 (in Portuguese, with abstract in English). https://doi.org/10.1590/S0100-204X2010000500009
» https://doi.org/10.1590/S0100-204X2010000500009 - Coelho, F.F.; Giasson, E. 2010. Methods for digital soil mapping using a geographical information system. Ciência Rural 40: 2099-2106 (in Portuguese, with abstract in English). https://doi.org/10.1590/S0103-84782010005000156
» https://doi.org/10.1590/S0103-84782010005000156 - Costa, E.M.; Samuel-Rosa, A.; Anjos, L.H.C. 2018. Digital elevation model quality on digital soil mapping prediction accuracy. Ciência e Agrotecnologia 42: 608-622. https://doi.org/10.1590/1413-70542018426027418
» https://doi.org/10.1590/1413-70542018426027418 - Crivelenti, R.C.; Coelho, R.M.; Adami, S.F.; Oliveira, S.R.M. 2009. Data mining to infer soil-landscape relationships in digital soil mapping. Pesquisa Agropecuária Brasileira 44: 1707-1715 (in Portuguese, with abstract in English). https://doi.org/10.1590/S0100-204X2009001200021
» https://doi.org/10.1590/S0100-204X2009001200021 - Dearden, P.; Kowalski, B.; Lowe, J.; Roland, R.; Surridge, M.; Thomas, S.; Jones, S. 2011. Mendeley Reference Manager. Mendeley Support Team, London, UK.
- Demattê, J.A.M.; Ramirez-Lopez, L.; Rizzo, R.; Nanni, M.R.; Fiorio, P.R.; Fongaro, C.T.; Medeiros Neto, L.; Safanelli, J.L.; Barros, P.P.S. 2016. Remote sensing from ground to space platforms associated with terrain attributes as a hybrid strategy on the development of a pedological map. Remote Sensing 8: 826. https://doi.org/10.3390/rs8100826
» https://doi.org/10.3390/rs8100826 - Dias, L.M.S.; Coelho, R.M.; Valladares, G.S.; Assis, A.C.C.; Ferreira, E.P.; Silva, R.C. 2016. Soil class prediction by data mining in an area of the sedimentary São Francisco basin. Pesquisa Agropecuária Brasileira 51: 1396-1404 (in Portuguese, with abstract in English). https://doi.org/10.1590/s0100-204x2016000900038
» https://doi.org/10.1590/s0100-204x2016000900038 - Diretoria de Serviço Geográfico. Quartel General do Exército. 2011. Technical Specification for Geospatial Vector Data Acquisition (ET-ADGV) = Especificação Técnica para a Aquisição de Dados Geoespaciais Vetoriais (ET-ADGV). Diretoria de Serviço Geográfico, Brasília, DF, Brazil (in Portuguese).
- Figueiredo, S.R.; Giasson, E.; Tornquist, G.C.; Nascimento, P.C. 2008. Multiple logistic regression applied to soil survey in Rio Grande do Sul state, Brazil. Revista Brasileira de Ciência do Solo 32: 2779-2785 (in Portuguese, with abstract in English).
- Giasson, E.; Clarke, R.T.; Vasconcellos, A.; Junior, I.; Henrique, G.; Tornquist, C.G. 2006. Digital soil mapping using multiple logistic regression on terrain parameters in southern Brazil. Scientia Agricola 63: 262-268. https://doi.org/10.1590/S0103-90162006000300008
» https://doi.org/10.1590/S0103-90162006000300008 - Giasson, E.; Hartemink, A.E.; Tornquist, C.G.; Teske, R.; Bagatini, T. 2013. Evaluation of five algorithms of decision trees and three digital elevation models for digital soil mapping at semidetail level at the Lageado Grande Watershed, RS, Brazil. Ciência Rural 43: 1967-1973 (in Portuguese, with abstract in English). https://doi.org/10.1590/S0103-84782013001100008
» https://doi.org/10.1590/S0103-84782013001100008 - Giasson, E.; Sarmento, E.C.; Weber, E.; Flores, C.A.; Hasenack, H. 2011. Decision trees for digital soil mapping on subtropical basaltic steeplands. Scientia Agricola 68: 167-174. https://doi.org/10.1590/S0103-90162011000200006
» https://doi.org/10.1590/S0103-90162011000200006 - Giasson, E.; Ten Caten, A.; Bagatini, T.; Bonfatti, B. 2015. Instance selection in digital soil mapping: a study case in Rio Grande do Sul, Brazil. Ciência Rural 45: 1592-1598. https://doi.org/10.1590/0103-8478cr20140694
» https://doi.org/10.1590/0103-8478cr20140694 - Grinand, C.; Arrouays, D.; Laroche, B.; Martin, M.P. 2008. Extrapolating regional soil landscapes from an existing soil map: Sampling intensity, validation procedures, and integration of spatial context. Geoderma 143: 180-190. https://doi.org/10.1016/j.geoderma.2007.11.004
» https://doi.org/10.1016/j.geoderma.2007.11.004 - Henrique, S.; Silva, G.; Duarte, M.M.; Ray, P.; Curi, N. 2016. Retrieving pedologist's mental model from existing soil map and comparing data mining tools for refining a larger area map under similar environmental conditions in Southeastern Brazil. Geoderma 267: 65-77. https://doi.org/10.1016/j.geoderma.2015.12.025
» https://doi.org/10.1016/j.geoderma.2015.12.025 - Höfig, P.; Giasson, E.; Vendrame, P.R.S. 2014. Digital soil mapping based on map extrapolation between physiographically similar areas. Pesquisa Agropecuária Brasileira 49: 958-966 (in Portuguese, with abstract in English). https://doi.org/10.1590/S0100-204X2014001200006
» https://doi.org/10.1590/S0100-204X2014001200006 - Khaledian, Y.; Miller, B.A. 2020. Selecting appropriate machine learning methods for digital soil mapping. Applied Mathematical Modelling 81: 401-418. https://doi.org/10.1016/j.apm.2019.12.016
» https://doi.org/10.1016/j.apm.2019.12.016 - Ma, Y.; Minasny, B.; Malone, B.P.; Mcbratney, A.B. 2019. Pedology and digital soil mapping (DSM). European Journal of Soil Science 70: 216-235. https://doi.org/10.1111/ejss.12790
» https://doi.org/10.1111/ejss.12790 - McBratney, A.B.; Mendonça Santos, M.L.; Minasny, B. 2003. On digital soil mapping. Geoderma 117: 3-52. https://doi.org/10.1016/S0016-7061(03)00223-4
» https://doi.org/10.1016/S0016-7061(03)00223-4 - Meier, M.; Souza, E.; Francelino, M.R.; Fernandes Filho, E.I.; Schaefer, C.E.G.R. 2018. Digital soil mapping using machine learning algorithms in a tropical mountainous area. Revista Brasileira de Ciência do Solo 42: 1-22. https://doi.org/10.1590/18069657rbcs20170421
» https://doi.org/10.1590/18069657rbcs20170421 - Minasny, B.; McBratney, A.B. 2016. Digital soil mapping: a brief history and some lessons. Geoderma 264: 301-311. https://doi.org/10.1016/j.geoderma.2015.07.017
» https://doi.org/10.1016/j.geoderma.2015.07.017 - Moura-Bueno, J.M.; Dalmolin, R.S.D.; Horst-Heinen, T.Z.; Cancian, L.C.; Schenato, R.B.; Dotto, A.C.; Flores, C.A. 2019. Prediction of soil classes in a complex landscape in southern Brazil. Pesquisa Agropecuária Brasileira 54: 1-13. https://doi.org/10.1590/s1678-3921.pab2019.v54.00420
» https://doi.org/10.1590/s1678-3921.pab2019.v54.00420 - Pelegrino, M.H.P.; Silva, S.H.G.; Menezes, M.D.; Silva, E.; Owens, P.R.; Curi, N. 2016. Mapping soils in two watersheds using legacy data and extrapolation for similar surrounding areas. Ciência e Agrotecnologia 40: 534-546. https://doi.org/10.1590/1413-70542016405011416
» https://doi.org/10.1590/1413-70542016405011416 - Pontius, R.G.; Millones, M. 2011. Death to Kappa: birth of quantity disagreement and allocation disagreement for accuracy assessment. International Journal of Remote Sensing 32: 4407-4429. https://doi.org/10.1080/01431161.2011.552923
» https://doi.org/10.1080/01431161.2011.552923 - Sarmento, E.C.; Giasson, E.; Weber, E.; Flores, C.A.; Hasenack, H. 2012. Prediction of soil orders with high spatial resolution: Response of different classifiers to sampling density. Pesquisa Agropecuária Brasileira 47: 1395-1403. https://doi.org/10.1590/S0100-204X2012000900025
» https://doi.org/10.1590/S0100-204X2012000900025 - Silva, B.P.C.; Silva, M.L.N.; Avalos, F.A.P.; de Menezes, M.D.; Curi, N. 2019. Digital soil mapping including additional point sampling in Posses ecosystem services pilot watershed, southeastern Brazil. Scientific Reports 9: 1-12. https://doi.org/10.1038/s41598-019-50376-w
» https://doi.org/10.1038/s41598-019-50376-w - Silva, C.C.; Coelho, R.M.; Oliveira, S.R.M.; Adami, S.F. 2013. Digital pedological mapping of Botucatu sheet (SF-22-Z-B-VI-3): data training on conventional maps and field validation. Revista Brasileira de Ciência do Solo 37: 846-857 (in Portuguese, with abstract in English). https://doi.org/10.1590/S0100-06832013000400003
» https://doi.org/10.1590/S0100-06832013000400003 - Silvero, N.E.Q.; Siqueira, D.S.; Coelho, R.M.; Costa Ferreira, D.; Marques, J. 2019. Protocol for the use of legacy data and magnetic signature on soil mapping of São Paulo central west, Brazil. Science of The Total Environment 693: 133463. https://doi.org/10.1016/j.scitotenv.2019.07.269
» https://doi.org/10.1016/j.scitotenv.2019.07.269 - Ten Caten, A.; Dalmolin, R.S.D.; Mendonça-Santos, M.L.; Giasson, E. 2012a. Digital soil mapping: characteristics of the brazilian approach. Ciência Rural 42: 1989-1997 (in Portuguese, with abstract in English). https://doi.org/10.1590/S0103-84782012001100013
» https://doi.org/10.1590/S0103-84782012001100013 - Ten Caten, A.; Dalmolin, R.S.D.; Pedron, F.A.; Mendonça-Santos, M.L. 2011a. Multivariate analysis applied to reduce the number of predictors in digital soil mapping. Pesquisa Agropecuária Brasileira 46: 553-561 (in Portuguese, with abstract in English). https://doi.org/10.1590/S0100-204X2011000500014
» https://doi.org/10.1590/S0100-204X2011000500014 - Ten Caten, A.; Dalmolin, R.S.D.; Pedron, F.A.; Mendonça-Santos, M.L. 2011b. Multiple logistic regressions: controlling factors in applications to soil class prediction. Revista Brasileira de Ciência do Solo 35: 53-62 (in Portuguese, with abstract in English). https://doi.org/10.1590/S0100-06832011000100005
» https://doi.org/10.1590/S0100-06832011000100005 - Ten Caten, A.; Dalmolin, R.S.D.; Pedron, F.A.; Santos, M.L.M. 2011c. Principal components as predictor variables in digital mapping of soil classes. Ciência Rural 41: 1170-1176 (in Portuguese, with abstract in English). https://doi.org/10.1590/S0103-84782011000700011
» https://doi.org/10.1590/S0103-84782011000700011 - Ten Caten, A.; Dalmolin, R.S.D.; Pedron, F.A.; Santos, M.L.M. 2011d. Extrapolation of soil-landscaperelationship from a reference area. Ciência Rural 41: 812-816 (in Portuguese, with abstract in English). https://doi.org/10.1590/S0103-84782011000500012
» https://doi.org/10.1590/S0103-84782011000500012 - Ten Caten, A.; Dalmolin, R.S.D.; Ruiz, L.F.C. 2012b. Digital soil mapping: strategy for data pre-processing. Revista Brasileira de Ciência do Solo 36: 1083-1092. https://doi.org/10.1590/S0100-06832012000400003
» https://doi.org/10.1590/S0100-06832012000400003 - Ten Caten, A.; Simão, R.; Dalmolin, D.; Pedron, F.D.A. 2013. An appropriate data set size for digital soil. Revista Brasileira de Ciência do Solo 37: 359-366. https://doi.org/http://dx.doi.org/10.1590/S0100-06832013000200007
» https://doi.org/http://dx.doi.org/10.1590/S0100-06832013000200007 - Teske, R.; Giasson, E.; Bagatini, T. 2015a. Comparison of sampling procedures for training predictive models in digital soil class mapping. Revista Brasileira de Ciência do Solo 39: 14-20 (in Portuguese, with abstract in English). https://doi.org/10.1590/01000683rbcs20150344
» https://doi.org/10.1590/01000683rbcs20150344 - Teske, R.; Giasson, E.; Bagatini, T. 2015b. Production of a soil map associating common digital soil mapping techniques with hand delineation of soil mapping units. Revista Brasileira de Ciência do Solo 39: 950-959 (in Portuguese, with abstract in English). https://doi.org/10.1590/01000683rbcs20140285
» https://doi.org/10.1590/01000683rbcs20140285 - Teske, R.; Giasson, E.; Bagatini, T. 2014. Comparison of the use of digital elevation models in digital mapping of soils of Dois Irmãos, RS, Brazil. Revista Brasileira de Ciência do Solo 38: 1367-1376 (in Portuguese, with abstract in English). https://doi.org/10.1590/S0100-06832014000500002
» https://doi.org/10.1590/S0100-06832014000500002 - Vasques, G.M.; Demattê, J.A.M.; Viscarra Rossel, R.A.; Ramírez López, L.; Terra, F.S.; Rizzo, R.; Souza Filho, C.R. 2015. Integrating geospatial and multi-depth laboratory spectral data for mapping soil classes in a geologically complex area in southeastern Brazil. European Journal of Soil Science 66: 767-779. https://doi.org/10.1111/ejss.12255
» https://doi.org/10.1111/ejss.12255 - Wolski, M.S.; Dalmolin, R.S.D.; Flores, C.A.; Moura-Bueno, J.M.; Ten Caten, A.; Kaiser, D.R. 2017. Digital soil mapping and its implications in the extrapolation of soil-landscape relationships in detailed scale. Pesquisa Agropecuária Brasileira 52: 633-642. https://doi.org/10.1590/S0100-204X2017000800009
» https://doi.org/10.1590/S0100-204X2017000800009 - Zhang, G.-L.; Liu, F.; Song, X.-D. 2017. Recent progress and future prospect of digital soil mapping: a review. Journal of Integrative Agriculture 16: 2871-2885. https://doi.org/10.1016/S2095-3119(17)61762-3
» https://doi.org/10.1016/S2095-3119(17)61762-3 - Zuur, A.F.; Ieno, E.N.; Elphick, C.S. 2010. A protocol for data exploration to avoid common statistical problems. Methods in Ecology and Evolution 1: 3-14. https://doi.org/10.1111/j.2041-210X.2009.00001.x
» https://doi.org/10.1111/j.2041-210X.2009.00001.x
Edited by
Publication Dates
-
Publication in this collection
24 Aug 2020 -
Date of issue
2021
History
-
Received
21 Aug 2019 -
Accepted
17 Apr 2020