
ABSTRACT:
Land use and tillage practices may change soil structure and undermine sustainable agriculture; however, such changes are hardly identified in the short term. In this sense, agroforestry systems have been used to reduce soil degradation and promote sustainable production in coffee plantations. These areas are expected to have well-structured soils and hence improved root distribution. This study aimed to evaluate soil quality by the morphostructural and root distribution analyses comparing open-grown coffee and coffee in agroforestry systems with rubber trees for 19 years, in an Oxisol in northern Paraná State (Brazil). Treatments consisted of open-grown coffee (OG), coffee partially shaded by rubber trees (PSH), and coffee fully shaded by rubber trees (FSH). The mapping of morphostructural features and soil resistance to penetration in “cultural profile” walls identified changes in soil structure resulting from different tillage systems. Root distribution was better in coffee plants grown in PSH and FSH systems. At greater depths, cultural profiles of FSH and PSH showed a larger numbers of roots compared to OG. Among the three systems, PSH provided a better environment for root growth and distribution. This result could be attributed to the high biological activity and interaction between roots and aggregates in that profile. The FSH agroforestry system provided less compact morphological structures and more roots throughout the soil profile. The agroforestry systems presented fewer soil structural changes by tillage operations and lower values of soil penetration resistance. Coffee root distribution was an effective indicator of soil quality and consistent with the morphostructural characterization of cultural profile.
Keywords:
cultural profile; soil physics; compaction; penetrometry; rubber treepoint of zero charge
Introduction
Changes in soil structure by human actions may impact agricultural productivity. Intensive farming and non-conservation tillage practices promote soil degradation ( Kraemer et al., 2017Kraemer, F.B.; Soria, M.A.; Castiglioni, M.G.; Duval, M.; Galantini, J.; Morrás, H. 2017. Morphostructural evaluation of various soils subjected to different use intensity under no-tillage. Soil and Tillage Research 169: 124-137. https://doi.org/10.1016/j.still.2017.01.013
https://doi.org/10.1016/j.still.2017.01....
). In this regard, production systems have been constantly modified to ensure yield gains, natural resource conservation, soil quality, and reductions of cost and environmental impacts ( Lal, 1989Lal, R. 1989. Conservation tillage for sustainable agriculture: tropicus versus temperate environments. Advances in Agronomy 42: 113. https://doi:10.1016/S0065-2113(08)60524-6
https://doi:10.1016/S0065-2113(08)60524-...
).
A sustainable coffee ( Coffea sp.) production depends on increased profitability associated to continuous cultivation ( Krishnan, 2017Krishnan, S. 2017. Sustainable coffee production. p. 1-34. In: Oxford Research Encyclopedia of Environmental Science. Oxford University Press, Oxford, UK. https://doi:10.1093/acrefore/9780199389414.013.224
https://doi:10.1093/acrefore/97801993894...
). Agroforestry (AF) systems combine forest and crops and/or pastures to deal with challenges associated to climatic, edaphic, and biological factors, which affect large-scale monoculture crops ( Ramachandran Nair et al., 2009Ramachandran Nair, P.K.R.; Kumar, B.M.; Nair, V.D. 2009. Agroforestry as a strategy for carbon sequestration. Journal of Plant Nutrition and Soil Science 172: 10-23. https://doi:10.1002/jpln.200800030
https://doi:10.1002/jpln.200800030...
).
An AF system of coffee crop shaded by other trees, like Grevillea robusta and Mimosa scabrella , has great economic potential in humid subtropical climates, such as in Paraná State, Brazil ( Baggio et al., 1997Baggio, A.J.; Caramori, P.H.; Androcioli Filho, A.; Montoya, L. 1997. Productivity of southern Brazilian coffee plantations shaded by different stockings of Grevillea robusta . Agroforestry Systems 37: 111-120. https://dx.doi.org/10.1023/A:1005814907546
https://dx.doi.org/10.1023/A:10058149075...
; Caramori et al., 1996Caramori, P.; Androcioli Filho, A.; Leal, A.C. 1996. Coffee shade with Mimosa scabrella Benth for frost protection in Southern Brazil. Agroforestry Systems 33: 205-214 (in Portuguese, with abstract in English). https://dx.doi.org/10.1007/BF00055423
https://dx.doi.org/10.1007/BF00055423...
). The AF system of coffee and rubber tree ( Hevea brasiliensis ) provides rational exploration of resources, crop longevity, increased natural-rubber production, and higher incomes for coffee growers ( Chen et al., 2019Chen, C.; Liu, W.; Wu, J.; Jiang, X.; Zhu, X. 2019. Can intercropping with the cash crop help improve the soil physico-chemical properties of rubber plantations. Geoderma 335: 149-160. http://dx.doi.org/10.1016/j.geoderma.2018.08.023
http://dx.doi.org/10.1016/j.geoderma.201...
; Partelli et al., 2014Partelli, F.L.; Araújo, A.V.; Vieira, H.D.; Dias, J.R.M.; Menezes, L.F.T.; Ramalho, J.C. 2014. Microclimate and development of ‘Conilon' Coffee intercropped with rubber trees. Pesquisa Agropecuária Brasileira 49: 872-881. https://doi:10.1590/S0100-204X2014001100006
https://doi:10.1590/S0100-204X2014001100...
). Compared to open-grown coffee, AF systems can also improve soil physical conditions ( Zaro et al., 2019Zaro, G.C.; Caramori, P.H.; Yada Junior, G.M.; Sanquetta, C.R.; Androcioli Filho, A.; Nunes, A.L.P.; Prete, C.E.C.; Voroney, P. 2019. Carbon sequestration in an agroforestry system of coffee with rubber trees compared to open-grown coffee in southern Brazil. Agroforestry System. 1: 380-839. https://doi:10.1007/s10457-019-00450-z
https://doi:10.1007/s10457-019-00450-z...
; Guimarães et al., 2014Guimarães, G.P.; Mendonça, E.S.; Passos, R.R.; Andrade, F.V. 2014. Soil aggregation and organic carbon of Oxisols under coffee in agroforestry systems. Revista Brasileira de Ciência do Solo 38: 278-287. https://doi:10.1590/S0100-06832014000100028
https://doi:10.1590/S0100-06832014000100...
).
Soil quality (SQ) results from interactions between physical, chemical, and biological properties, which sustain life, crop yield, and animal production, without compromising natural resource sustainability ( Obade, 2019Obade, V.P. 2019. Integrating management information with soil quality dynamics to monitor agricultural productivity. Science of the Total Environment 651: 2036-2043. https://doi.org/10.1016/j.scitotenv.2018.10.106
https://doi.org/10.1016/j.scitotenv.2018...
; Doran and Parkin, 1994Doran, J.W.; Parkin, T.B. 1994. Defining and assessing soil quality. In: Doran, J.W.; Coleman, D.C.; Bezdicek, D.F.; Stewart, B.A., eds. Defining soil quality for a sustainable environment. SSSA, Madison, WI, USA. ). For instance, soil structure is an indicator of soil sensitive to farming practices ( Rabot et al., 2018Rabot, E.; Wiesmeier, M.; Schlüter, S.; Vogel, H.-J. 2018. Soil structure as an indicator of soil functions: a review. Geoderma 314: 122-137. https://doi:10.1016/j.geoderma.2017.11.009
https://doi:10.1016/j.geoderma.2017.11.0...
) and responds directly and consistently to anthropic activities. In this sense, soil morphostructural characterization of different crop systems is an important way to assess SQ ( Ralisch et al., 2010Ralisch, R.; Almeida, E.; Silva, A.P.; Pereira Neto, O.C.; Guimarães, M.F. 2010. Morphostructural characterization of soil conventionally tilled with mechanized and animal traction with and without cover crop. Revista Brasileira de Ciência do Solo 34: 1795-1802. https://doi:10.1590/S0100-06832010000600003
https://doi:10.1590/S0100-06832010000600...
; Arshad et al., 1996Arshad, M.A.; Lowery, B.; Grossman, B. 1996. Physical tests for monitoring soil quality. p. 123-141. In: Doran, J.W.; Jones, A.J., eds. Methods for assessing soil quality. Soil Science Society of America, Madison, WI, USA. ). Furthermore, root system measurement is an effective way to evaluate land use effects on soil compaction and plant root growth ( Venzke Filho et al., 2004Venzke Filho, S.P.; Feigl, B.J.; Piccolo, M.C.; Fante Jr., L.L.; Siqueira Neto, M.; Cerri, C.C. 2004. Root systems and soil microbial biomass under no-tillage system. Scientia Agricola 61: 529-537. https://doi.org/10.1590/S0103-90162004000500011
https://doi.org/10.1590/S0103-9016200400...
).
Soil structural quality is expected to be improved in coffee AF systems rather than open-grown conditions due to greater root growth. Thus, this study aimed to characterize soil morphostructural conditions and their relationships with coffee root distribution in open-grown coffee and a coffee AF system with rubber tree for 19 years, in an Oxisol of northern Paraná State (Brazil).
Materials and Methods
The study was conducted in an experimental area in Londrina, Paraná State (Brazil) (23°23' S, 50°11' W, altitude of 610 m), in Jan 2016. According to Köppen classification, the local climate is Cfa type, which stands for subtropical humid with hot summers ( Alvares et al., 2013Alvares, C.C.; Stape, J.L.; Sentelhas, P.C.; de Moraes Gonçalves, J.L.; Sparovek, G. 2013. Köppen's climate classification map for Brazil. Meteorologische Zeitschrift 22 (6): 711-728. http://dx.doi.org/10.1127/0941-2948/2013/0507
http://dx.doi.org/10.1127/0941-2948/2013...
). Annual mean temperature and rainfall ranges are 21-22 °C and 1,400-1,600 mm, respectively. Figure 1 shows the historical averages for annual temperature and rainfall over the past 35 years.
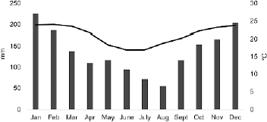
Historical monthly temperature and rainfall records from 1976 to 2015 in Londrina, Paraná state, Brazil. Source: IAPAR.
The local soil is classified as an Oxisol (dystrophic Red Latosol according to the Brazilian classification and Ferralsol according to the WRB classification). Soil particle-size distribution, from 0 to 0.20 m, was: 790.02 g clay, 160.31 g silt, and 49.67 g sand per kg of soil. The experimental area presents uniform topography with no evidence of soil erosion.
The area had been previously grown with coffee in the 1970s. Afterward, it was grown with grains (soybeans, corn, and oats) and then with cassava. Cultivation has always been carried out under a conventional tillage system. In 1997, an AF system was implanted with coffee ( Coffea arabica L.) of cultivar IPR-59 and rubber tree ( Hevea brasiliensis L.) of clone PB-235. Hoeing and application of agricultural inputs were performed to control weeds, pests, and diseases, with the help of a small tractor, and coffee grains were hand-harvested.
Coffee trees were spaced at 2.5 × 0.8 m and rubber trees were planted in double rows (4.0 × 2.5 × 16.0 m). The following treatments were evaluated: open-grown coffee (OG), coffee partially shaded by rubber tree (PSH), and coffee fully shaded by rubber tree (FSH). In the OG, a trench was opened between coffee trees. In the FSH, a trench was dug under rubber-tree canopy projection, encompassing the midpoint of the shaded area. In the PSH, a trench was dug at the edge of the tree canopy projection, between the double rows ( Figure 2 ). The trenches were hand excavated perpendicular to the coffee row direction and were 2.3 m long and 1.0 m deep and encompassed two coffee plants.

Map of trench locations in areas of coffee fully shaded by rubber tree (FSH), coffee partially shaded by rubber tree (PSH), and open-grown coffee (OG), and highlights of the cultural profile analyzed (PP). IAPAR, Londrina, Paraná State, Brazil, Jan 2016.
Cultural profile is a procedure used to evaluate soil structure and interpret changes resulting from tillage practices. Cultural profiles were classified morphostructurally, according to Tavares Filho et al. (1999)Tavares Filho, J.; Ralisch, R.; Guimarães, M.F.; Medina, C.C.; Balbino, L.C.; Neves, C.S.V.J. 1999. Cultural profile methodology for soil physical evaluation under tropical conditions. Revista Brasileira de Ciência do Solo 23: 393-399 (in Portuguese, with abstract in English). https://doi:10.1590/S0100-06831999000200022
https://doi:10.1590/S0100-06831999000200...
. Thereafter, maps were developed on a 1:20 scale, using Autodesk AutoCAD software (2015 version).
Morphologically homogeneous units (MHUs) in the soil profile were organized as: F – cracked soil, C – homogeneous soil, Z – platy-structured soil, tf – surface loose soil, NAM – undisturbed soil. Regarding the internal state of soil clods, the following classification was adopted: μ – non-compact, Δ – compact, Δμ – predominantly compact, μΔ – porous with compaction signs. Concerning size, aggregates were characterized as: small (pt) 1-5 cm Ø, medium (mt) 6-10 cm Ø, and large (gt) > 10 cm Ø.
For chemical characterization ( Table 1 ), deformed soil samples were randomly collected from the profile wall of each trench, at the depth layers of 0.00-0.10, 0.10-0.30, 0.30-0.50, 0.50-0.70 m, and four repetitions each. For gravimetric moisture and bulk density analyses ( Table 2 ), undisturbed soil samples were also collected from the same layers, using an Uhland sampler, in triplicate per layer.
– Soil chemical composition in areas of open-grown coffee (OG), coffee partially shaded by rubber tree (PSH), and coffee fully shaded by rubber tree (FSH). IAPAR, Londrina, Paraná State, Brazil, Jan 2016.
Soil water content and bulk density in areas of open-grown coffee (OG), coffee partially shaded by rubber tree (PSH), and coffee fully shaded by rubber tree (FSH). IAPAR, Londrina, Paraná State, Brazil, Jan 2016.
Coffee root system distribution and soil penetration resistance (PR) were also assessed for the same profiles. Roots were counted using a 2 × 2 cm grid pattern and expressed as mean root number per cm2 at each depth layer (0.10 m) ( Böhm, 1979Böhm, W. 1979. Methods of Studying Root Systems. Springer, Berlin, Germany. ). Soil penetration resistance was measured in 23 points spaced 0.10 m apart horizontally. These measures were taken at every 0.01 m depth throughout the open profile (at the trench edge) up to a 0.65 m depth. The measurements were made by an electronic penetrograph at a constant speed. For graphic representation of PR data, the mean value of each 0.10 m depth (0.05, 0.15, 0.25, 0.35, 0.45, 0.55, and 0.65 m) was taken. Data on root concentration and PR throughout the studied profiles were plotted graphically. Polynomial models were fitted using the least-square method to extrapolate field measurements. The Pearson's correlation coefficients were determined and significance between PR and root number was verified in each layer for each treatment.
Results and Discussion
Open-grown coffee (OG)
In the cultural profile of open-grown coffee (OG) ( Figure 3 ), less biological activity was observed compared to the other profiles. On the soil surface, there was a cracked morphological unit (F), with small, medium, or large clods (3, 6, and 13 cm Ø, respectively), presence of loose soil (tf) with predominance of compact clods (Δ), and clods with some visible porosity, but with compaction signs (μΔ) ( Figure 3 ). In a structure FΔμgt, flattened roots were observed growing horizontally throughout the soil profile, while in an FμΔpttf structure, a high number of branched roots were detected growing inside and between soil aggregates.

Cultural profile of open-grown coffee (OG). Morphologically homogeneous units (MHUs): F = cracked soil, C = homogeneous soil, tf = surface loose soil, NAM = undisturbed soil. Internal state of clods: μ = non-compacted, Δ = compact, Δμ = predominantly compact, μΔ = porous with compaction signs. Clod sizes: small, pt (1-5 cm Ø); medium, mt (6-10 cm Ø); and large, gt (> 10 cm Ø). IAPAR, Londrina, Paraná State, Brazil, Jan 2016.
The soil surface showed a larger volume of CΔ structure, very compact with no visible porosity, and was the most compact structure of all profiles evaluated. This fact could be attributed to lack of ground cover and to the use of machines, as observed in perennial crops by Tavares Filho et al. (1999)Tavares Filho, J.; Ralisch, R.; Guimarães, M.F.; Medina, C.C.; Balbino, L.C.; Neves, C.S.V.J. 1999. Cultural profile methodology for soil physical evaluation under tropical conditions. Revista Brasileira de Ciência do Solo 23: 393-399 (in Portuguese, with abstract in English). https://doi:10.1590/S0100-06831999000200022
https://doi:10.1590/S0100-06831999000200...
. Trenches were opened in the inter-rows of coffee where machinery wheels pass near the lower plagiotropic branches. This zone is characterized by high percentages of active roots ( Gontijo et al., 2008Gontijo, I.; Dias Junior, M.S.; Guimarães, P.T.G.; Araujo-Junior, C.F. 2008. Physical-hydric attributes of an Oxisol from the Cerrado region under coffee plantation as affected by the sampling position. Revista Brasileira de Ciência do Solo 32: 2227-2234 (in Portuguese, with abstract in English). https://doi:10.1590/S0100-06832008000600002
https://doi:10.1590/S0100-06832008000600...
).
Below the cracked layer, a CΔμ structure was observed in the profile (~10 % of the total profile area, Table 3 ), with compact aggregates and predominance of Δ characteristics, such as low porosity, flattened and twisted roots positioned horizontally in the profile ( Figure 3 ). Below 0.20 m in soil profile, a CμΔ structure was observed (~27 %) with large volume of cohesive and homogeneous soil, medium porosity, and branched roots positioned vertically in the profile.
Morphological homogeneous units (MHUs) in the cultural profiles of open-grown coffee (OG), coffee partially shaded by rubber trees (PSH), and coffee fully shaded by rubber trees (FSH). IAPAR, Londrina, Paraná State, Brazil, Jan 2016.
This cultural profile was the most compressed of all due to its more compact structures and compression processes. These factors may reduce water infiltration and its availability, besides increasing runoff and soil erosion ( Dexter, 1988Dexter, A.R. 1988. Advances in characterization of soil structure. Soil & Tillage Research 11: 199-238. https://doi.org/10.1016/0167-1987(88)90002-5
https://doi.org/10.1016/0167-1987(88)900...
; Lal, 1989Lal, R. 1989. Conservation tillage for sustainable agriculture: tropicus versus temperate environments. Advances in Agronomy 42: 113. https://doi:10.1016/S0065-2113(08)60524-6
https://doi:10.1016/S0065-2113(08)60524-...
; Tavares Filho et al., 2014Tavares Filho, J.; Melo, T.R.; Machado, W.; Maciel, B.V. 2014. Structural changes and degradation of Red Latosols under different management systems for 20 years. Revista Brasileira de Ciência do Solo 38: 1293-1303. https://doi:10.1590/S0100-06832014000400025
https://doi:10.1590/S0100-06832014000400...
).
Coffee partly shaded by rubber trees (PSH)
The cultural profile of coffee partially shaded by rubber trees (PSH) showed a morphological unit F on the soil surface, with small and/or medium clods, and surface loose soil with a predominance of internally compact aggregates and low porosity, from Δμ to μΔ ( Figure 4 ). Many galleries with biological activity were observed in the FμΔpttf structure of this profile, with improvements in soil porosity.

Cultural profile of coffee partially shaded by rubber trees (PSH). Morphologically homogeneous units (MHUs): F = cracked soil, C = homogeneous soil, Z = platy-structured soil, tf = surface loose soil, NAM = undisturbed soil. Internal state of clods: μ = non-compacted, Δ = compact, Δμ = predominantly compact, μΔ = porous with compaction signs. Clod sizes: small, pt (1-5 cm Ø); medium, mt (6-10 cm Ø); and large, gt (> 10 cm Ø). IAPAR, Londrina, Paraná State, Brazil, Jan 2016.
This was the only cultural profile to present a platy structure (Z), located in the 0.00-0.05 m depth layer. The structure was characterized by horizontal, tortuous, unbranched, and flattened roots. When cracked, a laminar structure may reflect the positive effects of surface roots on soil structure ( Domingos et al., 2009Domingos, M.M.M.; Gasparetto, N.V.L.; Nakashima, P.; Ralisch, R.; Tavares Filho, J. 2009. Evaluation of the structure of a eutroferric red nitosol under no-tillage, conventional tillage and forest. Revista Brasileira de Ciência do Solo 33: 1517-1524 (in Portuguese, with abstract in English). https://dx.doi.org/10.1590/S0100-06832009000600001
https://dx.doi.org/10.1590/S0100-0683200...
); thus, the MHU FΔμpt of this profile indicates possible structural regeneration. A Z structure can be originated in coffee plantations due to the use agricultural machinery in soil under inappropriate moisture levels, raindrop impact onto soil surface disintegrating it and promoting its surface compaction because of lack of coverage in coffee inter-rows, as observed in this profile.
Just below the platy layer (Z), there was a very compact CΔ structure (~ 3 %), with a small number of flattened roots growing horizontally. This CΔ layer in PSH was thinner than in the OG profile, which may be due to the biological activity found in this system. Further below, there is a layer of structure CΔμ (20 %), with many galleries of biological activity, which justifies the characteristic μ (rounded and porous microaggregates). In addition, two galleries filled with tf were observed in the structure CμΔ (27 %), with diameters of about 0.14 and 0.20 m, resulting from root presence, especially rubber trees.
Presence of galleries in more compact structures could be attributed to the rubber-tree root action, which also improved soil structure. This effect may have influenced the internal state of clods in Δμ, as roots form biopores that degrade and promote aggregation, facilitating soil aeration, water movement, gas diffusion ( Barley, 1954Barley, K.P. 1954. Effect of root growth and decay on the permeability of a synthetic sandy loam. Soil Science 78: 205-210. ), and root penetration. Furthermore, the maintenance of crop residues on soil surface also improves edaphic conditions by increasing total organic carbon (TOC) and macro and microorganism actions ( Gatiboni et al., 2011Gatiboni, L.C.; Coimbra, J.F.M.; Denardin, R.B.N.; Wildner, L.P. 2011. Microbial biomass and soil fauna during the decomposition of cover crops in no-tillage system. Revista Brasileira de Ciência do Solo 35: 1051-1057. https://doi:10.1590/S0100-06832011000400008
https://doi:10.1590/S0100-06832011000400...
). In general, the PSH profile presented higher biological activity compared to the others, especially termites.
Coffee fully shaded by rubber trees (FSH)
The cultural profile of coffee fully shaded by rubber trees (FSH) presented fewer structures and smaller compact soil volume (CΔ ~1.6 %) than the other profiles ( Figure 5 and Table 3 ). This profile presented a larger number of clods with internal state μΔ than those with Δ, which highlights the importance of coffee and rubber tree AF systems. Only in this profile, an FμΔptmttf structure was found on the sides (up to 0.40 m depth). This structure (FμΔptmttf) represents soil with small and medium clods, medium porosity, branched roots, and tf presence, these cracks may be effects of coffee roots that produce a dense system of connected biopores ( Lucas et al., 2019Lucas, M.; Schlüter, S.; Vogel, H.; Vetterlein, D. 2019. Roots compact the surrounding soil depending on the structures they encounter. Scientific Reports 9: 16236. https://doi:10.1038/s41598-019-52665-w
https://doi:10.1038/s41598-019-52665-w...
). Moreover, in this profile, the FμΔmt structure found on the soil surface presented roots growing vertically through the cracks, unlike the FΔμgt structure that has flattened roots and horizontal growth.

Cultural profile of fully shaded coffee by rubber trees (FSH). Morphologically homogeneous units (MHUs): F = cracked soil, C = homogeneous soil, tf = surface loose soil, NAM = undisturbed soil. Internal state of clods: μ = non-compacted, Δ = compact, Δμ = predominantly compact, μΔ = porous with compaction signs. Clod sizes: small, pt (1-5 cm Ø); medium, mt (6-10 cm Ø); and large, gt (> 10 cm Ø). IAPAR, Londrina, Paraná State, Brazil, Jan 2016.
Cracked units were observed from the surface up to 0.20 m depth, possibly because of the soil surface thermal spectrum. Cracking between and inside aggregates could be favored by soil moistening and drying cycles. In each cycle, aggregate boundaries are defined by hydration pressure, thereby determining their characteristics ( Dexter, 1988Dexter, A.R. 1988. Advances in characterization of soil structure. Soil & Tillage Research 11: 199-238. https://doi.org/10.1016/0167-1987(88)90002-5
https://doi.org/10.1016/0167-1987(88)900...
). The same author also stated that these structures could reduce total soil volume explored by roots. Both clod structures CΔ and CΔμ were observed on the FSH profile surface. Below the CΔμ layer, a CμΔ structure (~20 %) was found in a smaller volume compared to the other two profiles. Moreover, soil structural recovery by tillage operations are influenced by wetting and drying cycles and soil resilience, as reported in Rhodic Hapludox (dystrophic Red Latosol) ( Silva et al., 2012Silva, S.G.C.; Silva, A.P.; Giarola, N.F.B.; Tormena, C.A.; Sá, J.C.M. 2012. Temporary effect of chiseling on the compaction of a Rhodic Hapludox under no-tillage. Revista Brasileira de Ciência do Solo 36: 547-555. https://doi:10.1590/S0100-06832012000200024
https://doi:10.1590/S0100-06832012000200...
).
The largest and smallest volumes of compact soil were detected in the profiles OG (12 %) and FSH (1.6 %), respectively ( Table 3 ). Tillage practices had greater effects on OG and PSH profiles, up to 0.85 m in PSH. These profiles could be considered the most complex among the profiles evaluated, due to their heterogeneity and number of structures found.
The FSH profile had a low volume of disturbed soil by tillage practices (~0.40 m depth) with therefore a larger NAM structure (~54 %), which corresponds to the Bw microaggregate structure of Latosols (Oxisols). NAM structure represented 43 and 33 % of the total volume of OG and PSH profiles, respectively. The high proportion of cracked structures in FSH and PSH profiles improved coffee tree rooting, corroborating the findings of Tavares Filho et al. (1999)Tavares Filho, J.; Ralisch, R.; Guimarães, M.F.; Medina, C.C.; Balbino, L.C.; Neves, C.S.V.J. 1999. Cultural profile methodology for soil physical evaluation under tropical conditions. Revista Brasileira de Ciência do Solo 23: 393-399 (in Portuguese, with abstract in English). https://doi:10.1590/S0100-06831999000200022
https://doi:10.1590/S0100-06831999000200...
.
Soil penetration resistance (PR)
Penetration resistance was measured to evaluate soil physical conditions, root development, and soil compaction (indirectly), as well as monitoring structural changes. All treatments presented PR values of plant growth up to 0.4 m depth, mentioned as critical in other studies. Canarache (1990)Canarache, A. 1990. PENETR: a generalized semi-empirical model estimating soil resistance to penetration. Soil & Tillage Research 16: 51-70. https://doi.org/10.1016/0167-1987(90)90021-5
https://doi.org/10.1016/0167-1987(90)900...
states that PR should be lower than 2.5 MPa, while Taylor et al. (1966)Taylor, H.M.; Robertson, G.M.; Parker, J.J. 1966. Soil strength root penetration relations for medium to coarse textured soil materials. Soil Science 102: 18-22. reports the value 2.0 MPa. However, Moraes et al. (2014)Moraes, M.T.; Debiasi, H.; Carlesso, R.; Franchini, J.C.; Silva, V.R. 2014. Critical limits of soil penetration resistance in a Rhodic Eutrudox. Revista Brasileira de Ciência do Solo 38: 288-298. https://doi:10.1590/S0100-06832014000100029
https://doi:10.1590/S0100-06832014000100...
sustain that PR values up to 3.5 MPa are tolerable in soils not tilled annually.
Higher PR values were recorded in the 0.10-0.30 m layer of FSH and PSH profiles, reaching 4.65 MPa at 0.30 m depth in FSH and 4.75 MPa at 0.20 m in PSH ( Figures 7 and 8 ). These results are in accordance with higher bulk density values ( Table 2 ). In the OG profile, the highest PR values were observed from 0.10 to 0.40 m depth, reaching 5.35 MPa at 0.30 m depth ( Figure 6 ); however, the same trend was not verified for bulk density values. Likewise, Guimarães et al. (2014)Guimarães, G.P.; Mendonça, E.S.; Passos, R.R.; Andrade, F.V. 2014. Soil aggregation and organic carbon of Oxisols under coffee in agroforestry systems. Revista Brasileira de Ciência do Solo 38: 278-287. https://doi:10.1590/S0100-06832014000100028
https://doi:10.1590/S0100-06832014000100...
observed higher PR in open-grown coffee than in shaded coffee areas. Our findings agree with Watanabe et al. (2018)Watanabe, R.; Tormena, C.A.; Guimarães, M.F.; Tavares Filho, J.; Ralisch, R.; Franchini, J.; Debiasi, H. 2018. Is structural quality as assessed by the “Profil Cultural” method related to quantitative indicators of soil physical quality? Revista Brasileira de Ciência do Solo 42: e0160393. https://doi.org/10.1590/18069657rbcs20160393
https://doi.org/10.1590/18069657rbcs2016...
and Tavares Filho et al. (2012)Tavares Filho, J.; Feltran, C.T.M.; Oliveira, J.F.; Almeida, E. 2012. Modelling of soil penetration resistance for an Oxisol under no-tillage. Revista Brasileira de Ciência do Solo 36: 89-95. https://doi:10.1590/S0100-06832012000100010
https://doi:10.1590/S0100-06832012000100...
in the same soil type and under a no-till system, in Londrina, Paraná State (Brazil).
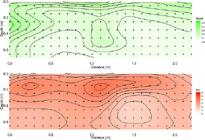
Number of roots per cm2 and soil penetration resistance (PR), in MPa, in the profile of open-grown coffee (OG), IAPAR, Londrina, Paraná State, Brazil, Jan 2016.
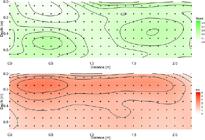
Number of roots per cm2 and soil penetration resistance (PR), in MPa, in the profile of coffee partially shaded by rubber trees (PSH), IAPAR, Londrina, Paraná State, Brazil, Jan 2016.
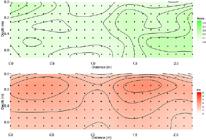
– Number of roots per cm2 and soil penetration resistance (PR), in the profile of coffee fully shaded by rubber trees (FSH). IAPAR, Londrina, Paraná State, Brazil, Jan 2016.
In the PSH profile, PR values did not reach 5 MPa ( Figure 7 ). There was a large area with PR values between 3.0 and 5.0 MPa throughout the profile, mainly in the 0.10-0.30 m layer and below 0.40 m depth. Different PR values have been reported as critical for plant growth and development in the literature. Taylor et al. (1966)Taylor, H.M.; Robertson, G.M.; Parker, J.J. 1966. Soil strength root penetration relations for medium to coarse textured soil materials. Soil Science 102: 18-22. noted that plant growth was severely limited at a PR 2.0 MPa. This threshold has been used by many other researchers. Similarly, Canarache (1990)Canarache, A. 1990. PENETR: a generalized semi-empirical model estimating soil resistance to penetration. Soil & Tillage Research 16: 51-70. https://doi.org/10.1016/0167-1987(90)90021-5
https://doi.org/10.1016/0167-1987(90)900...
stated that soil PR must be lower than 2.5 MPa. However, critical PR values may vary depending on soil structural conditions, tillage system, and soil moisture and texture ( Pias et al., 2018Pias, O.H.C.; Cherubin, M.R.; Basso, C.J.; Santi, A.L.; Molin, J.P.; Bayer, C. 2018. Soil penetration resistance mapping quality: effect of the number of subsamples. Acta Scientiarum. Agronomy 40: e34989. https://doi:10.4025/actasciagron.v40i1.34989
https://doi:10.4025/actasciagron.v40i1.3...
). Conversely, Seidel et al. (2018)Seidel, E.P.; Schneider, A.P.H.; Sustakowski, M.C.; Matté, L.M.; Mottin, M.C.; Silva, J.H. 2018. Soybean yield, soil porosity and soil penetration resistance under mechanical scarification in No-Tillage System. Journal of Agricultural Science 10: 268-277. https://doi:10.5539/jas.v10n4p268
https://doi:10.5539/jas.v10n4p268...
stated that, in a system without annual plowing, PR values up to 3.0 MPa are tolerable and do not reduce soybean yield. According to Tormena et al. (2017)Tormena, C.A.; Karlen, D.; Logsdon, S.D.; Cherubin, M.R. 2017. Corn stover harvest and tillage impacts on nearsurface soil physical quality. Soil & Tillage Research 166: 122-130. https://doi.org/10.1016/j.still.2016.09.015
https://doi.org/10.1016/j.still.2016.09....
, no-tillage soils present permanence and continuity of pores derived from bioporosity, which improves soil physical quality.
The lowest PR values were observed in the FSH profile surface (~0.5-1 MPa), as it was for bulk density values ( Table 2 ). Penetration resistance reached a maximum of 3.8 MPa in more compact areas ( Figure 8 ). The same conditions were reported by Guimarães et al. (2014)Guimarães, G.P.; Mendonça, E.S.; Passos, R.R.; Andrade, F.V. 2014. Soil aggregation and organic carbon of Oxisols under coffee in agroforestry systems. Revista Brasileira de Ciência do Solo 38: 278-287. https://doi:10.1590/S0100-06832014000100028
https://doi:10.1590/S0100-06832014000100...
for shaded coffee areas. Penetration resistance tended to decrease from 0.40 m depth down, which was also observed by Burg et al. (2012)Burg, P.; Zemánek, P.; Turan, J.; Findura, P. 2012. The penetration resistance as a soil degradation indicator in the viticulture. Acta Universitatis Agriculturae et Silviculturae Mendelianae Brunensis 60: 29-36. http://dx.doi.org/10.11118/actaun201260080029
http://dx.doi.org/10.11118/actaun2012600...
. The comparison of cultural profile and PR maps shows that the tillage system influences soil quality after 19 years.
Coffee root distribution
At 0.10 m depth, the number of roots per cm2 in the OG profile was two and three times higher than in the PSH and FSH profiles, respectively. This high concentration of roots in soil surface may have been due to the presence of very small pores, which led to the growth of thin lateral roots in compacted layers, as stated by Atwell (1993)Atwell, B.J. 1993. Response of roots to mechanical impedance. Environmental and Experimental Botany 33: 27-40. https://doi.org/10.1016/0098-8472(93)90053-I
https://doi.org/10.1016/0098-8472(93)900...
. Soil compaction could be identified by the cultural profile analysis and by the higher volume of soil compacted structure (CΔ) in the OG profile surface. Tracy et al. (2012)Tracy, S.R.; Black, C.R.; Roberts, J.A.; Sturrock, C.; Mairhofer, S.; Craigon, J.; Mooney, S.J. 2012. Quantifying the impact of soil compaction on root system architecture in tomato (Solanum lycopersicum) by X-ray micro-computed tomography. Annals of Botany 110: 511-519. https://doi.org/10.1093/aob/mcs031
https://doi.org/10.1093/aob/mcs031...
stated that, in compacted layers, root growth occurs preferentially in areas of lower resistance, that is, cracks and biological pores, characterizing crooked root growth.
In the OG profile, 70 % of roots were concentrated down to a depth 0.40 m ( Table 5 ), where there was a layer with higher PR values. This could also be verified by the correlation between PR and number of roots in Table 4 . Our results corroborate Effgen et al. (2012)Effgen, T.A.M.; Passos, R.R.; Andrade, F.V.; Lima, J.S.S.; Reis, E.F.; Borges; E.N. 2012. Physical soil properties as a function of management in crops of conilon coffee. Revista Ceres 59: 414-421 (in Portuguese, with abstract in English). http://dx.doi.org/10.1590/S0034-737X2012000300018
http://dx.doi.org/10.1590/S0034-737X2012...
, who demonstrated that PR values higher than 5.0 MPa may restrict coffee root growth and stated that high PR could be associated to soil tillage systems.
The Pearson's correlation coefficient between soil penetration resistance (PR) and root number in the cultural profiles of open-grown coffee (OG), coffee partially shaded by rubber trees (PSH), and coffee fully shaded by rubber trees (FSH). IAPAR, Londrina, Paraná State, Brazil, Jan 2016.
Percentage of roots per depth range in relation to total number of roots in all evaluated depth layers (0-0.80 m) in open-grown coffee (OG), coffee partially shaded by rubber trees (PSH), and coffee fully shaded by rubber trees (FSH), IAPAR, Londrina, Paraná State, Brazil, Jan 2016.
Low meso- and macrofauna levels were found in the OG profile. Moreover, this profile shower higher H + Al levels (59 % higher) and lower Ca2+ contents (64 % lower) compared to those in the PSH profile, which may restrict root growth ( Table 1 ). Low pH and high Al3+ saturation decrease root system growth ( Ritchey et al., 1980Ritchey, K.D.; Souza, M.G.; Lobato, E.; Correa, O. 1980. Calcium leaching to increase rooting depth in a Brazilian Savannah Oxisol. Agronomy Journal 72: 40-44. https://doi:10.2134/agronj1980.00021962007200010009
https://doi:10.2134/agronj1980.000219620...
; Bose et al., 2010Bose, J.; Babourina, O.; Shabala, S.; Rengel, Z. 2010. Aluminum-dependent dynamics of ion transport in Arabidopsis: specificity of low pH and aluminum responses. Physiologia Plantarum 139: 401-412. http://dx.doi.org/10.1111/j.1399-3054.2010.01377.x
http://dx.doi.org/10.1111/j.1399-3054.20...
). Moreover, shortage of essential minerals (N, P, K, and Ca) may limit coffee root development ( Melke and Ittana, 2015Melke, A.; Ittana, F. 2015. Nutritional requirement and management of arabica coffee (Coffea arabica L.) in Ethiopia: national and global perspectives. American Journal of Experimental Agriculture 5: 400-418. https://doi:10.9734/AJEA/2015/12510
https://doi:10.9734/AJEA/2015/12510...
).
Roots in the PSH profile were found at greater depths when compared to those in the OG profile ( Table 5 ). Despite the low pH, the PSH profile showed better chemical conditions, such as higher TOC, lower H + Al, and higher Ca2+, which explains the improved root growth. However, the number of roots decreased in compacted layers and Al3+-saturated layers (24 %), both on the soil surface and in the 0.30-0.50 m depth layer ( Table 1 and Figure 7 ).
The use of farm machinery and large-scale cultivation increase soil structural degradation in coffee plantations ( Martins et al., 2012Martins, P.C.C.; Dias Junior, M.S.; Andrade, M.L.C.; Guimarães, P.T.G. 2012. Compaction caused by mechanized operations in a Red- Yellow Latosol cultivated with coffee over time. Ciência e Agrotecnologia 36: 391-398. https://doi:10.1590/S1413-70542012000400002
https://doi:10.1590/S1413-70542012000400...
). Even using small machinery in all treatments, structural changes, such as compaction and surface loose soil (tf), may be traffic-related, as well as low litter on soil surface of the treatments. Degradation resulting from these factors was identified by tf presence in the PSH and OG, mainly in the latter. In the FSH profile, tf was not found, emphasizing the importance of AF systems.
Macrofauna component species, especially termites, earthworms, and ants, were more frequent in the PSH profile, in which higher TOC was also verified. According to Ramachandran Nair et al. (2009)Ramachandran Nair, P.K.R.; Kumar, B.M.; Nair, V.D. 2009. Agroforestry as a strategy for carbon sequestration. Journal of Plant Nutrition and Soil Science 172: 10-23. https://doi:10.1002/jpln.200800030
https://doi:10.1002/jpln.200800030...
, AF systems contribute to an increase in soil fertility and to a reduction in erosion processes, providing foundations for productive agroecosystems in addition to promoting environmental sustainability ( FAO, 2013Food and Agriculture Organization [FAO]. 2013. Climate-Smart Agriculture Sourcebook. FAO, Rome, Italy. ).
Soil morphostructural characterization is essential to assess SQ since changes in properties, such as aggregate size, type, and development, affect soil permeability, aeration as well as root growth and microorganism development ( Boizard et al., 2017Boizard, H.; Peigné, J.; Sasal, M.C.; Guimarães, M.F.; Pirone, D.; Tomis, V.; Vian, J.; Cadoux, S.; Ralisch, R.; Tavares Filho, J.; Heddadj, D.; Battista, J.; Duparque, A.; Franchini, J.C.; Roger-Estrade, J. 2017. Developments in the “profil cultural” method for an improved assessment of soil structure under no-till. Soil and Tillage Research 173: 92-103. http://dx.doi.org/10.1016/j.still.2016.07.007
http://dx.doi.org/10.1016/j.still.2016.0...
; Silva et al., 2014Silva, A.P.; Babujia, L.C.; Franchini, J.C.; Ralisch, R.; Hungria, M.; Guimarães, M.F. 2014. Soil structure and its influence on microbial biomass in different soil and crop management systems. Soil & Tillage Research 142: 42-53. https://doi:10.1016/j.still.2014.04.006
https://doi:10.1016/j.still.2014.04.006...
). Thus, the cultural profile method to identify soil structural changes resulting from agricultural practices and evaluate the effects on soil conservation and quality ( Silva et al., 2014Silva, A.P.; Babujia, L.C.; Franchini, J.C.; Ralisch, R.; Hungria, M.; Guimarães, M.F. 2014. Soil structure and its influence on microbial biomass in different soil and crop management systems. Soil & Tillage Research 142: 42-53. https://doi:10.1016/j.still.2014.04.006
https://doi:10.1016/j.still.2014.04.006...
) are of great importance, as in the intercropped areas evaluated in this study.
The FSH profile presented the smallest number of roots in the soil surface layer. Roots in this profile concentrated within the depth of 0.20-0.40 m, but in a smaller proportion compared with those in the PSH profile ( Table 5 ). Deeper layers of the PSH and FSH profiles showed less anthropogenic influence, which improved distribution and increased the number of coffee roots. Ritchey et al. (1980)Ritchey, K.D.; Souza, M.G.; Lobato, E.; Correa, O. 1980. Calcium leaching to increase rooting depth in a Brazilian Savannah Oxisol. Agronomy Journal 72: 40-44. https://doi:10.2134/agronj1980.00021962007200010009
https://doi:10.2134/agronj1980.000219620...
observed the same in subsurface layers of an Oxisol (Brazilian Latosol). Furthermore, roots in both AF systems were better distributed if compared to those in the OG profile, revealing their better soil structure. This is mainly due to presence of biopores and their connectivity and continuity that are greater than in structural pores ( Souza et al., 2017Souza, G.S.; Alves, D.I.; Dan, M.L.; Lima, J.S.S.; Fonseca, A.L.C.C.; Araújo, J.B.S.; Guimarães, L.A.O.P. 2017. Soil physico-hydraulic properties under organic conilon coffee intercropped with tree and fruit species. Pesquisa Agropecuária Brasileira 52: 539-547. https://doi:10.1590/s0100-204x2017000700008
https://doi:10.1590/s0100-204x2017000700...
), as well as by presence of roots.
When comparing PR and root number in the plots, there was a pattern of smaller root numbers where higher PR values were found. The contrast of the root number and the cultural profile analysis showed another pattern throughout the profile. Overall, more compact structures presented smaller root numbers and higher PR values ( Andrade et al., 2018Andrade, A.D.; Faria, R.O.; Alonso, D.J.C.; Ferraz, G.A.S.; Herrera, M.A.D.; Silva, F.M. 2018. Spatial variability of soil penetration resistance in coffee growing. Coffee Science 13: 341-348. http://dx.doi.org/10.25186/cs.v13i3.1456
http://dx.doi.org/10.25186/cs.v13i3.1456...
; Unger and Kaspar, 1994Unger, P.N.; Kaspar, J.C. 1994. Soil compaction and root growth: a review. Agronomy Journal 86: 759-766. https://doi.org/10.2134/agronj1994.00021962008600050004x
https://doi.org/10.2134/agronj1994.00021...
), as root growth was reduced or nonexistent in compacted areas.
Our findings showed that AF systems improved the environment for root growth and distribution in the PSH profile, even at depth. This was possibly due to high meso- and macrofauna activity, which improved the soil structure, as stated by Guimarães et al. (2014)Guimarães, G.P.; Mendonça, E.S.; Passos, R.R.; Andrade, F.V. 2014. Soil aggregation and organic carbon of Oxisols under coffee in agroforestry systems. Revista Brasileira de Ciência do Solo 38: 278-287. https://doi:10.1590/S0100-06832014000100028
https://doi:10.1590/S0100-06832014000100...
and Lal (1989)Lal, R. 1989. Conservation tillage for sustainable agriculture: tropicus versus temperate environments. Advances in Agronomy 42: 113. https://doi:10.1016/S0065-2113(08)60524-6
https://doi:10.1016/S0065-2113(08)60524-...
. In this profile (PSH), except for the cracks, roots preferably occupied macropores and biopores. In the FSH profile, the F structure was preferably occupied by roots rather than C structures, due to its lower PR ( Tavares Filho et al., 1999Tavares Filho, J.; Ralisch, R.; Guimarães, M.F.; Medina, C.C.; Balbino, L.C.; Neves, C.S.V.J. 1999. Cultural profile methodology for soil physical evaluation under tropical conditions. Revista Brasileira de Ciência do Solo 23: 393-399 (in Portuguese, with abstract in English). https://doi:10.1590/S0100-06831999000200022
https://doi:10.1590/S0100-06831999000200...
). The AF systems showed no evidence of soil degradation, corroborating Jiang et al. (2017)Jiang, X.J.; Liu, W.; Wu, J.; Wang, P.; Liu, C.; Yuan, Z. 2017. Land degradation controlled and mitigated by rubber-based agroforestry systems through optimizing soil physical conditions and water supply mechanisms: a case study in Xishuangbanna, China. Land Degradation & Development 28: 2277-2289. https://doi.org/10.1002/ldr.2757
https://doi.org/10.1002/ldr.2757...
. Lin (2007)Lin, B.B. 2007. Agroforestry management as an adaptive strategy against potential microclimate extremes in coffee agriculture. Agricultural and Forest Meteorology 144: 85-94. https://doi:10.1016/j.agrformet.2006.12.009
https://doi:10.1016/j.agrformet.2006.12....
stated that shaded AF systems have lower thermal variation than less shaded coffee plantations; thus, AF systems provide more favorable mechanisms to deal with climate changes. Guimarães et al. (2014)Guimarães, G.P.; Mendonça, E.S.; Passos, R.R.; Andrade, F.V. 2014. Soil aggregation and organic carbon of Oxisols under coffee in agroforestry systems. Revista Brasileira de Ciência do Solo 38: 278-287. https://doi:10.1590/S0100-06832014000100028
https://doi:10.1590/S0100-06832014000100...
observed higher soil aggregation levels and TOC contents in partially shaded coffee and noted that AF systems are viable alternatives for farmers. Therefore, in our study, the PSH and FSH profiles presented advantages over the OG coffee, because they provided more suitable soil structure, as well as better root growth and distribution. Adequate procedures of chemical fertility and machinery traffic are also essential to maintain these benefits.
Conclusions
Coffee plants shaded by Hevea brasiliensis decreased the proportion of compact morphological structures.
Agroforestry of coffee and rubber trees increased root distribution throughout the profile, mainly below 0.40 m depth.
Coffee plants shaded by Hevea brasiliensis showed less anthropic effects and lower soil penetration resistance values than the open-grown coffee.
Coffee root distribution was an effective indicator of soil quality, consistent with morphostructural characterization of the cultural profiles.
Acknowledgements
We thank the Coordination for the Improvement of Higher Education Personnel (CAPES) for doctoral and research scholarships, and the Agronomic Institute of Paraná (IAPAR).
References
- Alvares, C.C.; Stape, J.L.; Sentelhas, P.C.; de Moraes Gonçalves, J.L.; Sparovek, G. 2013. Köppen's climate classification map for Brazil. Meteorologische Zeitschrift 22 (6): 711-728. http://dx.doi.org/10.1127/0941-2948/2013/0507
» http://dx.doi.org/10.1127/0941-2948/2013/0507 - Andrade, A.D.; Faria, R.O.; Alonso, D.J.C.; Ferraz, G.A.S.; Herrera, M.A.D.; Silva, F.M. 2018. Spatial variability of soil penetration resistance in coffee growing. Coffee Science 13: 341-348. http://dx.doi.org/10.25186/cs.v13i3.1456
» http://dx.doi.org/10.25186/cs.v13i3.1456 - Arshad, M.A.; Lowery, B.; Grossman, B. 1996. Physical tests for monitoring soil quality. p. 123-141. In: Doran, J.W.; Jones, A.J., eds. Methods for assessing soil quality. Soil Science Society of America, Madison, WI, USA.
- Atwell, B.J. 1993. Response of roots to mechanical impedance. Environmental and Experimental Botany 33: 27-40. https://doi.org/10.1016/0098-8472(93)90053-I
» https://doi.org/10.1016/0098-8472(93)90053-I - Baggio, A.J.; Caramori, P.H.; Androcioli Filho, A.; Montoya, L. 1997. Productivity of southern Brazilian coffee plantations shaded by different stockings of Grevillea robusta . Agroforestry Systems 37: 111-120. https://dx.doi.org/10.1023/A:1005814907546
» https://dx.doi.org/10.1023/A:1005814907546 - Barley, K.P. 1954. Effect of root growth and decay on the permeability of a synthetic sandy loam. Soil Science 78: 205-210.
- Böhm, W. 1979. Methods of Studying Root Systems. Springer, Berlin, Germany.
- Boizard, H.; Peigné, J.; Sasal, M.C.; Guimarães, M.F.; Pirone, D.; Tomis, V.; Vian, J.; Cadoux, S.; Ralisch, R.; Tavares Filho, J.; Heddadj, D.; Battista, J.; Duparque, A.; Franchini, J.C.; Roger-Estrade, J. 2017. Developments in the “profil cultural” method for an improved assessment of soil structure under no-till. Soil and Tillage Research 173: 92-103. http://dx.doi.org/10.1016/j.still.2016.07.007
» http://dx.doi.org/10.1016/j.still.2016.07.007 - Bose, J.; Babourina, O.; Shabala, S.; Rengel, Z. 2010. Aluminum-dependent dynamics of ion transport in Arabidopsis: specificity of low pH and aluminum responses. Physiologia Plantarum 139: 401-412. http://dx.doi.org/10.1111/j.1399-3054.2010.01377.x
» http://dx.doi.org/10.1111/j.1399-3054.2010.01377.x - Burg, P.; Zemánek, P.; Turan, J.; Findura, P. 2012. The penetration resistance as a soil degradation indicator in the viticulture. Acta Universitatis Agriculturae et Silviculturae Mendelianae Brunensis 60: 29-36. http://dx.doi.org/10.11118/actaun201260080029
» http://dx.doi.org/10.11118/actaun201260080029 - Canarache, A. 1990. PENETR: a generalized semi-empirical model estimating soil resistance to penetration. Soil & Tillage Research 16: 51-70. https://doi.org/10.1016/0167-1987(90)90021-5
» https://doi.org/10.1016/0167-1987(90)90021-5 - Caramori, P.; Androcioli Filho, A.; Leal, A.C. 1996. Coffee shade with Mimosa scabrella Benth for frost protection in Southern Brazil. Agroforestry Systems 33: 205-214 (in Portuguese, with abstract in English). https://dx.doi.org/10.1007/BF00055423
» https://dx.doi.org/10.1007/BF00055423 - Chen, C.; Liu, W.; Wu, J.; Jiang, X.; Zhu, X. 2019. Can intercropping with the cash crop help improve the soil physico-chemical properties of rubber plantations. Geoderma 335: 149-160. http://dx.doi.org/10.1016/j.geoderma.2018.08.023
» http://dx.doi.org/10.1016/j.geoderma.2018.08.023 - Dexter, A.R. 1988. Advances in characterization of soil structure. Soil & Tillage Research 11: 199-238. https://doi.org/10.1016/0167-1987(88)90002-5
» https://doi.org/10.1016/0167-1987(88)90002-5 - Effgen, T.A.M.; Passos, R.R.; Andrade, F.V.; Lima, J.S.S.; Reis, E.F.; Borges; E.N. 2012. Physical soil properties as a function of management in crops of conilon coffee. Revista Ceres 59: 414-421 (in Portuguese, with abstract in English). http://dx.doi.org/10.1590/S0034-737X2012000300018
» http://dx.doi.org/10.1590/S0034-737X2012000300018 - Domingos, M.M.M.; Gasparetto, N.V.L.; Nakashima, P.; Ralisch, R.; Tavares Filho, J. 2009. Evaluation of the structure of a eutroferric red nitosol under no-tillage, conventional tillage and forest. Revista Brasileira de Ciência do Solo 33: 1517-1524 (in Portuguese, with abstract in English). https://dx.doi.org/10.1590/S0100-06832009000600001
» https://dx.doi.org/10.1590/S0100-06832009000600001 - Doran, J.W.; Parkin, T.B. 1994. Defining and assessing soil quality. In: Doran, J.W.; Coleman, D.C.; Bezdicek, D.F.; Stewart, B.A., eds. Defining soil quality for a sustainable environment. SSSA, Madison, WI, USA.
- Food and Agriculture Organization [FAO]. 2013. Climate-Smart Agriculture Sourcebook. FAO, Rome, Italy.
- Gatiboni, L.C.; Coimbra, J.F.M.; Denardin, R.B.N.; Wildner, L.P. 2011. Microbial biomass and soil fauna during the decomposition of cover crops in no-tillage system. Revista Brasileira de Ciência do Solo 35: 1051-1057. https://doi:10.1590/S0100-06832011000400008
» https://doi:10.1590/S0100-06832011000400008 - Gontijo, I.; Dias Junior, M.S.; Guimarães, P.T.G.; Araujo-Junior, C.F. 2008. Physical-hydric attributes of an Oxisol from the Cerrado region under coffee plantation as affected by the sampling position. Revista Brasileira de Ciência do Solo 32: 2227-2234 (in Portuguese, with abstract in English). https://doi:10.1590/S0100-06832008000600002
» https://doi:10.1590/S0100-06832008000600002 - Guimarães, G.P.; Mendonça, E.S.; Passos, R.R.; Andrade, F.V. 2014. Soil aggregation and organic carbon of Oxisols under coffee in agroforestry systems. Revista Brasileira de Ciência do Solo 38: 278-287. https://doi:10.1590/S0100-06832014000100028
» https://doi:10.1590/S0100-06832014000100028 - Jiang, X.J.; Liu, W.; Wu, J.; Wang, P.; Liu, C.; Yuan, Z. 2017. Land degradation controlled and mitigated by rubber-based agroforestry systems through optimizing soil physical conditions and water supply mechanisms: a case study in Xishuangbanna, China. Land Degradation & Development 28: 2277-2289. https://doi.org/10.1002/ldr.2757
» https://doi.org/10.1002/ldr.2757 - Kraemer, F.B.; Soria, M.A.; Castiglioni, M.G.; Duval, M.; Galantini, J.; Morrás, H. 2017. Morphostructural evaluation of various soils subjected to different use intensity under no-tillage. Soil and Tillage Research 169: 124-137. https://doi.org/10.1016/j.still.2017.01.013
» https://doi.org/10.1016/j.still.2017.01.013 - Krishnan, S. 2017. Sustainable coffee production. p. 1-34. In: Oxford Research Encyclopedia of Environmental Science. Oxford University Press, Oxford, UK. https://doi:10.1093/acrefore/9780199389414.013.224
» https://doi:10.1093/acrefore/9780199389414.013.224 - Lal, R. 1989. Conservation tillage for sustainable agriculture: tropicus versus temperate environments. Advances in Agronomy 42: 113. https://doi:10.1016/S0065-2113(08)60524-6
» https://doi:10.1016/S0065-2113(08)60524-6 - Lin, B.B. 2007. Agroforestry management as an adaptive strategy against potential microclimate extremes in coffee agriculture. Agricultural and Forest Meteorology 144: 85-94. https://doi:10.1016/j.agrformet.2006.12.009
» https://doi:10.1016/j.agrformet.2006.12.009 - Lucas, M.; Schlüter, S.; Vogel, H.; Vetterlein, D. 2019. Roots compact the surrounding soil depending on the structures they encounter. Scientific Reports 9: 16236. https://doi:10.1038/s41598-019-52665-w
» https://doi:10.1038/s41598-019-52665-w - Martins, P.C.C.; Dias Junior, M.S.; Andrade, M.L.C.; Guimarães, P.T.G. 2012. Compaction caused by mechanized operations in a Red- Yellow Latosol cultivated with coffee over time. Ciência e Agrotecnologia 36: 391-398. https://doi:10.1590/S1413-70542012000400002
» https://doi:10.1590/S1413-70542012000400002 - Melke, A.; Ittana, F. 2015. Nutritional requirement and management of arabica coffee (Coffea arabica L.) in Ethiopia: national and global perspectives. American Journal of Experimental Agriculture 5: 400-418. https://doi:10.9734/AJEA/2015/12510
» https://doi:10.9734/AJEA/2015/12510 - Moraes, M.T.; Debiasi, H.; Carlesso, R.; Franchini, J.C.; Silva, V.R. 2014. Critical limits of soil penetration resistance in a Rhodic Eutrudox. Revista Brasileira de Ciência do Solo 38: 288-298. https://doi:10.1590/S0100-06832014000100029
» https://doi:10.1590/S0100-06832014000100029 - Obade, V.P. 2019. Integrating management information with soil quality dynamics to monitor agricultural productivity. Science of the Total Environment 651: 2036-2043. https://doi.org/10.1016/j.scitotenv.2018.10.106
» https://doi.org/10.1016/j.scitotenv.2018.10.106 - Partelli, F.L.; Araújo, A.V.; Vieira, H.D.; Dias, J.R.M.; Menezes, L.F.T.; Ramalho, J.C. 2014. Microclimate and development of ‘Conilon' Coffee intercropped with rubber trees. Pesquisa Agropecuária Brasileira 49: 872-881. https://doi:10.1590/S0100-204X2014001100006
» https://doi:10.1590/S0100-204X2014001100006 - Pias, O.H.C.; Cherubin, M.R.; Basso, C.J.; Santi, A.L.; Molin, J.P.; Bayer, C. 2018. Soil penetration resistance mapping quality: effect of the number of subsamples. Acta Scientiarum. Agronomy 40: e34989. https://doi:10.4025/actasciagron.v40i1.34989
» https://doi:10.4025/actasciagron.v40i1.34989 - Rabot, E.; Wiesmeier, M.; Schlüter, S.; Vogel, H.-J. 2018. Soil structure as an indicator of soil functions: a review. Geoderma 314: 122-137. https://doi:10.1016/j.geoderma.2017.11.009
» https://doi:10.1016/j.geoderma.2017.11.009 - Ralisch, R.; Almeida, E.; Silva, A.P.; Pereira Neto, O.C.; Guimarães, M.F. 2010. Morphostructural characterization of soil conventionally tilled with mechanized and animal traction with and without cover crop. Revista Brasileira de Ciência do Solo 34: 1795-1802. https://doi:10.1590/S0100-06832010000600003
» https://doi:10.1590/S0100-06832010000600003 - Ramachandran Nair, P.K.R.; Kumar, B.M.; Nair, V.D. 2009. Agroforestry as a strategy for carbon sequestration. Journal of Plant Nutrition and Soil Science 172: 10-23. https://doi:10.1002/jpln.200800030
» https://doi:10.1002/jpln.200800030 - Ritchey, K.D.; Souza, M.G.; Lobato, E.; Correa, O. 1980. Calcium leaching to increase rooting depth in a Brazilian Savannah Oxisol. Agronomy Journal 72: 40-44. https://doi:10.2134/agronj1980.00021962007200010009
» https://doi:10.2134/agronj1980.00021962007200010009 - Seidel, E.P.; Schneider, A.P.H.; Sustakowski, M.C.; Matté, L.M.; Mottin, M.C.; Silva, J.H. 2018. Soybean yield, soil porosity and soil penetration resistance under mechanical scarification in No-Tillage System. Journal of Agricultural Science 10: 268-277. https://doi:10.5539/jas.v10n4p268
» https://doi:10.5539/jas.v10n4p268 - Silva, A.P.; Babujia, L.C.; Franchini, J.C.; Ralisch, R.; Hungria, M.; Guimarães, M.F. 2014. Soil structure and its influence on microbial biomass in different soil and crop management systems. Soil & Tillage Research 142: 42-53. https://doi:10.1016/j.still.2014.04.006
» https://doi:10.1016/j.still.2014.04.006 - Silva, S.G.C.; Silva, A.P.; Giarola, N.F.B.; Tormena, C.A.; Sá, J.C.M. 2012. Temporary effect of chiseling on the compaction of a Rhodic Hapludox under no-tillage. Revista Brasileira de Ciência do Solo 36: 547-555. https://doi:10.1590/S0100-06832012000200024
» https://doi:10.1590/S0100-06832012000200024 - Souza, G.S.; Alves, D.I.; Dan, M.L.; Lima, J.S.S.; Fonseca, A.L.C.C.; Araújo, J.B.S.; Guimarães, L.A.O.P. 2017. Soil physico-hydraulic properties under organic conilon coffee intercropped with tree and fruit species. Pesquisa Agropecuária Brasileira 52: 539-547. https://doi:10.1590/s0100-204x2017000700008
» https://doi:10.1590/s0100-204x2017000700008 - Tavares Filho, J.; Feltran, C.T.M.; Oliveira, J.F.; Almeida, E. 2012. Modelling of soil penetration resistance for an Oxisol under no-tillage. Revista Brasileira de Ciência do Solo 36: 89-95. https://doi:10.1590/S0100-06832012000100010
» https://doi:10.1590/S0100-06832012000100010 - Tavares Filho, J.; Ralisch, R.; Guimarães, M.F.; Medina, C.C.; Balbino, L.C.; Neves, C.S.V.J. 1999. Cultural profile methodology for soil physical evaluation under tropical conditions. Revista Brasileira de Ciência do Solo 23: 393-399 (in Portuguese, with abstract in English). https://doi:10.1590/S0100-06831999000200022
» https://doi:10.1590/S0100-06831999000200022 - Tavares Filho, J.; Melo, T.R.; Machado, W.; Maciel, B.V. 2014. Structural changes and degradation of Red Latosols under different management systems for 20 years. Revista Brasileira de Ciência do Solo 38: 1293-1303. https://doi:10.1590/S0100-06832014000400025
» https://doi:10.1590/S0100-06832014000400025 - Taylor, H.M.; Robertson, G.M.; Parker, J.J. 1966. Soil strength root penetration relations for medium to coarse textured soil materials. Soil Science 102: 18-22.
- Tormena, C.A.; Karlen, D.; Logsdon, S.D.; Cherubin, M.R. 2017. Corn stover harvest and tillage impacts on nearsurface soil physical quality. Soil & Tillage Research 166: 122-130. https://doi.org/10.1016/j.still.2016.09.015
» https://doi.org/10.1016/j.still.2016.09.015 - Tracy, S.R.; Black, C.R.; Roberts, J.A.; Sturrock, C.; Mairhofer, S.; Craigon, J.; Mooney, S.J. 2012. Quantifying the impact of soil compaction on root system architecture in tomato (Solanum lycopersicum) by X-ray micro-computed tomography. Annals of Botany 110: 511-519. https://doi.org/10.1093/aob/mcs031
» https://doi.org/10.1093/aob/mcs031 - Unger, P.N.; Kaspar, J.C. 1994. Soil compaction and root growth: a review. Agronomy Journal 86: 759-766. https://doi.org/10.2134/agronj1994.00021962008600050004x
» https://doi.org/10.2134/agronj1994.00021962008600050004x - Venzke Filho, S.P.; Feigl, B.J.; Piccolo, M.C.; Fante Jr., L.L.; Siqueira Neto, M.; Cerri, C.C. 2004. Root systems and soil microbial biomass under no-tillage system. Scientia Agricola 61: 529-537. https://doi.org/10.1590/S0103-90162004000500011
» https://doi.org/10.1590/S0103-90162004000500011 - Watanabe, R.; Tormena, C.A.; Guimarães, M.F.; Tavares Filho, J.; Ralisch, R.; Franchini, J.; Debiasi, H. 2018. Is structural quality as assessed by the “Profil Cultural” method related to quantitative indicators of soil physical quality? Revista Brasileira de Ciência do Solo 42: e0160393. https://doi.org/10.1590/18069657rbcs20160393
» https://doi.org/10.1590/18069657rbcs20160393 - Zaro, G.C.; Caramori, P.H.; Yada Junior, G.M.; Sanquetta, C.R.; Androcioli Filho, A.; Nunes, A.L.P.; Prete, C.E.C.; Voroney, P. 2019. Carbon sequestration in an agroforestry system of coffee with rubber trees compared to open-grown coffee in southern Brazil. Agroforestry System. 1: 380-839. https://doi:10.1007/s10457-019-00450-z
» https://doi:10.1007/s10457-019-00450-z
Edited by
Publication Dates
-
Publication in this collection
16 Oct 2020 -
Date of issue
2021
History
-
Received
05 June 2020 -
Accepted
17 Apr 2020


