Abstract
AFM has been recognized as one of the most powerful tools for the analysis of surface morphologies because it creates three-dimensional images at angstrom and nano scale. This technique has been exhaustively used in the analyses of dispersion of nanometric components in nanocomposites and in polymer blends, because of the easiness of sample preparation and lower equipment maintenance costs compared to electron microscopy. In this review, contributions using AFM are described, with emphasis on the dispersion of nanofillers in polymeric matrices. It is aimed to show the importance of technical analysis for nanocomposites and polymer blends based on elastomers.
AFM; nanocomposites; elastomers; polymer blends; dispersion; morphology
SEÇÃO TÉCNICA
REVIEWS
The use of atomic force microscopy as an important technique to analyze the dispersion of nanometric fillers and morphology in nanocomposites and polymer blends based on elastomers
Fabiula Danielli Bastos de Sousa; Carlos Henrique Scuracchio
Centro de Engenharia, Modelagem e Ciências Sociais Aplicadas - CECS, Universidade Federal do ABC - UFABC
Corresponding author Corresponding author: Fabiula Danielli Bastos de Sousa, Centro de Engenharia, Modelagem e Ciências Sociais Aplicadas - CECS, Universidade Federal do ABC - UFABC, Avenida dos Estados, 5001, Bairro Bangu, CEP 09210-580, Santo André, SP, Brasil, e-mail: fabiuladesousa@gmail.com
ABSTRACT
AFM has been recognized as one of the most powerful tools for the analysis of surface morphologies because it creates three-dimensional images at angstrom and nano scale. This technique has been exhaustively used in the analyses of dispersion of nanometric components in nanocomposites and in polymer blends, because of the easiness of sample preparation and lower equipment maintenance costs compared to electron microscopy. In this review, contributions using AFM are described, with emphasis on the dispersion of nanofillers in polymeric matrices. It is aimed to show the importance of technical analysis for nanocomposites and polymer blends based on elastomers.
Keywords: AFM, nanocomposites, elastomers, polymer blends, dispersion, morphology.
Introduction
Atomic Force Microscopy (AFM) is a mechanic-optical instrument able to detect forces of the order to piconewtons (1012 N). Like all other Scanning Probe Microscopes (SPM), AFM works by scanning the sample with a tip (or more general a probe) through the contact or non-contact with the sample surface, according to scanning mode. It operates by measuring attractive or repulsive forces between the tip and the sample in constant height or constant force mode[1].
According to Flores and Toca-Herrera[2], that well compared the AFM technique to the behavior of a blind person, "The atomic force microscope certainly resembles the human analog as a blind microscope that can sense micro and nano-objects. Indeed, the instrument provides the probing stick, a micro sized cantilever with a tip at its free end; a piezodriven device to move the probe over the sample (or vice versa) in three dimensions with nanometric precision; a means to get the tip position during its movement and a feedback mechanism to control how strongly the tip slides or taps over the sample surface. In this way, AFM has become an invaluable technique to explore the morphology of the nanoworld. Moreover, since the cantilever is a force transducer, it has been exhaustively used to study surface and molecular interactions". Also according to the same authors[2], "By blindly inspecting an object just underneath, we systematically move our body and stick right and left; and up and down. We can either slide or tap our stick over the surface. Our brain controls the movement and the force we exert on the surface through our hand and stick. AFM resembles the analog with a cantilever as an elastic stick, a piezoscanner that moves it along three dimensions, a laser, and a position detector that registers its position. The ways the tip can scan the surface are more numerous than we humans have, however, on most occasions the tip is either made to slide over the surface, impinging a defined force (contact mode imaging) or to tap the sample more or less gently (intermittent contact imaging)".
An AFM is composed of a cantilever, a piezoscanner, a laser and a detector. A sharp tip at the free end of a flexible cantilever can be brought into contact or non-contact with the sample. A piezoelectric element is fixed in the support to drive the cantilever on its frequency of resonance and then is connected to the piezoscanner. The light from the laser beam is reflected by the mirror to a split photo detector with four quadrants. The difference between the intensity measured by the two upper and the two lower segments gives the cantilever deflection signal; whereas the difference between the intensity measured by the two right and the two left segments gives the cantilever torsion signal[3].
For surface imaging, the tip deflection will change the direction of the reflected laser beam, changing the intensity difference between the top and bottom sets of photo detectors (AFM signal)[4-6].
The modes of obtaining the images, also called scanning modes, refer fundamentally to the distance kept between the probe (tip) and the sample during scanning, the ways the tip moves on the surface of the sample and the forces between the sample and tip[6,7]. Three different modes are possible: non-contact, contact and tapping mode. In the non-contact mode, the tip does not touch the sample surface, but oscillates above the adsorbed fluid layer on the surface during scanning; in the contact mode, the tip remains in constant contact with the sample surface; and in the tapping mode, the tip oscillates and can be in contact with the sample surface intermittently. The tapping mode of operation combines qualities of both the contact and non-contact modes by collecting sample data and oscillating the cantilever tip at or near its natural resonance frequency while allowing the cantilever tip to impact the target sample for a minimal amount of time[8]. AFM tapping mode has been used for polymeric surfaces information with nanoscale resolution[9-11]. High-resolution surface results are obtained through this mode of analysis, since the images provide height (relief surface) and phase (combination of sample and AFM-probe characteristics)[12,13].
AFM has been widely used for the study of polymers as the cost of equipment maintenance is substantially lower than the electron microscopes[7]. Polymeric surfaces present in-homogeneities in microscopic scale, which can affect their properties of adhesion, wettability, abrasion and degradation in the environment. Therefore, the identification of in-homogeneities and its mapping have great importance in science and technology[9]. Some advantages are that it is not necessary the use of vacuum during analysis or conductive covering on the sample; the possibility of direct measures of height and roughness, obtaining images with atomic resolution[7]. As AFM relies on attractive and repulsive interactions between the tip and surface, another advantage is that it can be applied to any material[14]. In addition, the AFM technique does not demand prior complex treatment of the sample for the characterization of the morphology, microstructure and crystallinity of different polymer films[15].
AFM has been proved to be an important tool to characterize the micro phase separated structure. This technique allows simultaneous detection of phase image and height, which provides insights on the variations in topography and local stiffness[15,16] due to the directly relation to the material density and elastic modulus[17]. The topographic images are generated, which keeps the oscillation amplitude constant through a feedback loop that controls the distance between the tip and the sample. The second image can be formed simultaneously, whose contrast is determined by the lagged signal. This image can reveal several types of heterogeneities through the dissipation of mechanical energy of the material surface in general including polymeric materials[18]. The main factors of mechanical energy dissipation of the tip and consequent phase change are the viscoelastic, adhesive and topographical properties of the region being examined. In addition, it allows to obtain new information about the polymers surface such as tribological data[3], local contaminants[6], morphology[17,19-40], distribution of phases in blends and composites[41-47], compatibility between the phases of polymer blends and interaction between nanocomposites phases[48-54], polymeric chains conformation[7,38], cross-link density[55-57], dispersion of fillers in the polymeric matrix[10,12,16,48,49,58-69], among other applications.
When the tip passes through a sample, the oscillation phase can change according to the different interaction conditions between the tip and the sample, resulting in phase image contrast[70], and it is commonly used to distinguish different domains or different blend components[18]. According to Bokobza et al.[71], phase imaging provides variation of surface stiffness arising from differences in moduli between the components of a given system. This difference in the viscoelastic properties of a material frequently happens in polymeric blends (especially in the rubber/thermoplastic blends, and in the polymeric blends or polymers containing nanofillers). In these cases, when the tip passes through softer regions in the sample, the tip can penetrate slightly on the surface. However, while it passes through a region of stiffer material, the tip cannot penetrate in the surface, suffering a larger deflection. Monitoring the probe deflection amplitude, it is possible directly associate regions of small amplitude with soft regions, and similarly regions of large amplitudes with hard regions in the surface sample.
Out of three modes of AFM, tapping mode is the most suitable for soft rubber samples. In this mode, short intermittent tip/sample contact reduces lateral forces, which minimizes sample damage during scanning[64]. The cantilever tip is vertically oscillated at the first resonant frequency of the cantilever and brought into periodic contact with the sample surface. Hence, the tapping mode significantly reduces the frictional force exerting from the cantilever tip to the sample during the faster scanning of the sample[72], which reduces the risk of defects in the sample.
From now on, some works in which the AFM was used for the verification of nanofillers dispersion will be presented. Some of them used the technique for the morphology observation of polymer blends, which demonstrates its potential in the study of multiphase polymeric materials and nanomaterials. The great majority of the cited works used the AFM tapping mode. The works which use a different scanning mode will be mentioned.
Nanocomposites Based on Elastomers
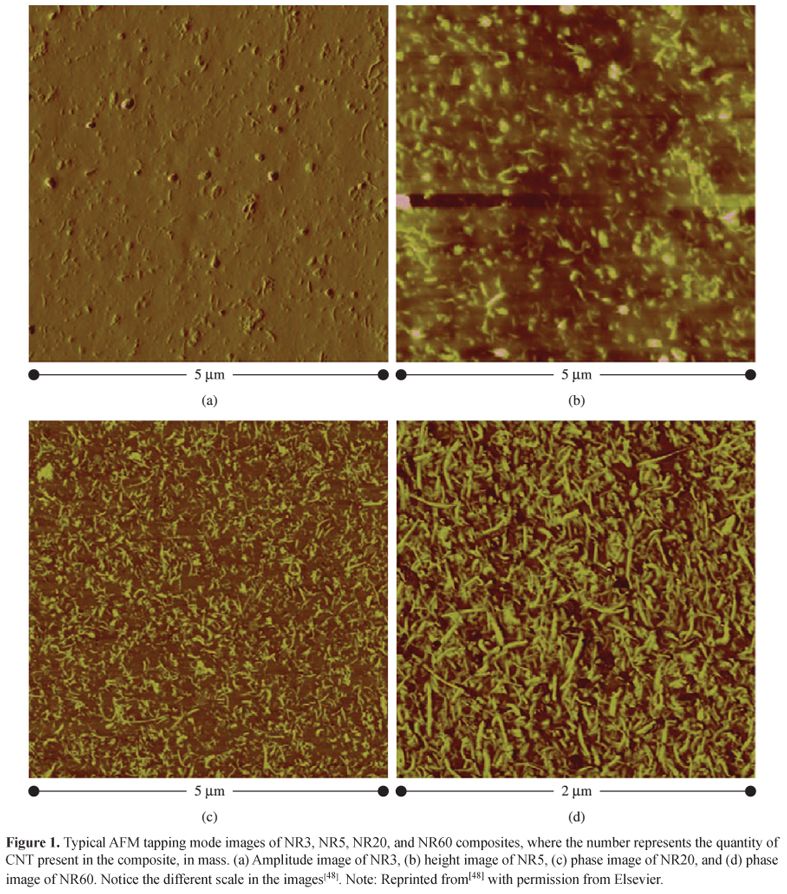
Wang et al.[48] produced well-dispersed Carbon Nanotubes (CNTs)/Natural Rubber (NR) composites in an open two roll mill mixer with high shear stresses. By using an AFM nanomechanical mapping technique (Figure 1), the authors investigated the topography, modulus, and adhesive energy distribution maps of the composites in terms of CNT loading. Those maps were successfully used to identify and characterize heterogeneity of such composites. The mechanical interfacial regions formed around CNTs together with CNTs divided elastomer matrix into small "cells" in which the elastomer matrix was occluded. Therefore, the enhanced mechanical properties were considered to have arisen from the three-dimensional structure formed by CNTs and the mechanical interfacial regions bound to them.
The same authors[49] studied the topography, elastic modulus, and adhesive energy maps of nanocomposites NR containing 5 phr (parts per hundred of rubber) of CNTs. According to the authors, such maps allow the characterization of different regions (CNTs and NR) through different properties of the materials. The intermediate modulus region formed around CNTs was quantitatively evaluated in real space and demonstrated the existence of interaction between CNTs and NR matrix.
Different authors also studied the dispersion of CNTs in rubber matrices by AFM[41,42,59,63,65,71]. AFM observation of CNTs/Styrene Butadiene Rubber (SBR) was carried out in order to observe the behavior of filler aggregates upon application of a macroscopic strain and also after suppression of the strain and second stretching[42]. According to them, the orientation of the filler aggregated in the matrix is the result of the uniaxial deformation of the sample. At the highest elongation, the bundles can be seen broken up into long straight structures. When the sample is in the unstressed state, its morphology is quite different from those stressed. In the relaxed sample, the data suggest a rotation of domains and an orientation of the bundles perpendicular to the stress direction. A large degree of permanent deformation is shown after the second stretching and releasing. The AFM images of the experiments under strain showed the gradual increase in stiffness with strain. Russo et al.[63] also observed, according to AFM images, the increase in the stiffness of the matrix Thermoplastic Polyurethane (TPU) filled with different concentrations of CNT due to the increase in the matrix crystallinity. Increase in the stiffness and strength of the matrix NR filled with graphene oxide was also achieved by Stanier et al.[73] what, according to them, indicates an increase in the transference of stress through the material. Homogeneous specimens containing a regular distribution of oxidized nanoparticles of single layer thickness could be observed by AFM images.
The same way, Le et al.[65] analyzed the dispersion of nanofillers (nanoclay and CNT) in carboxylated Nitrile Butadiene Rubber (carboxylated NBR) matrix by using ionic liquid and ethanol as dispersing agent for effective mixing of nanofillers. They analyzed the morphology and the localization of the dispersing agent in the nanocomposites by optical microscopy, Transmission Electron Microscopy (TEM) and AFM. According to the authors, the dispersing agents used show very good effect on the filler dispersion.
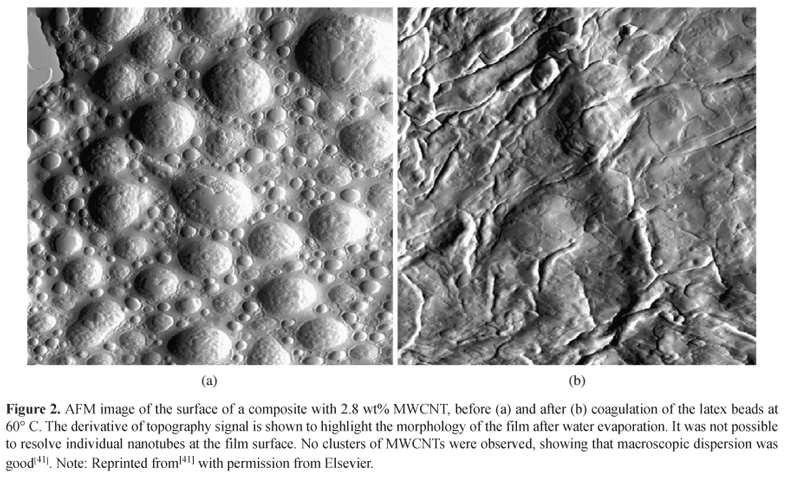
Bokobza et al.[71] investigated the influence of the addition of carbon black (CB) to Multiwalled Carbon Nanotubes (MWCNT) dispersion in SBR matrix. AFM and TEM were used to analyze the dispersion of the fillers in the matrix and, according to the both techniques, CNTs interact with CB aggregates resulting in improvement in the mechanical and electrical conductivity due to lower percolation threshold than that obtained with samples only filled with CNTs. Similarly, Bhattacharyya et al.[41] studied the modifications of the NR properties with the addition of Carboxylated Multiwalled Carbon Nanotubes (c-MWCNT). According to the authors, reinforcement of NR was achieved by using c-MWCNT dispersed with sodium dodecyl sulfate. AFM images before and after heat treatment (Figures 2a and b) confirms that CNTs are highly embedded in the films and do not impede latex spheres coagulation.
Khalid et al.[59] investigated the effect of radiation dose and CNT on the mechanical properties of Standard Malaysian Rubber (SMR). SMR nanocomposites containing 1-7 phr of CNTs were prepared by using solvent casting and the nanocomposites were radiated at doses of 50-200 kGy. According to the authors, results of tensile properties and hardness of the SMR/CNT nanocomposites revealed reinforcing effect of CNT nanoparticles in SMR matrix; and the morphology studies (TEM and AFM) confirmed that enhancement in the mechanical properties is attributed to uniform dispersion of CNT. There was a good agreement between TEM and AFM results.
Silica filled Polysulfone nanocomposites were produced by Olmos et al.[69] with different loadings. The morphological characterization by Scanning Electron Microscopy (SEM) and AFM showed a uniform distribution of silica nanoparticles in the matrix. Another work using silica is the one by Chakrabarty et al.[32], that studied a processing method by using high speed mixing developed for nanocomposites comprised of α,ω-dihydroxy-polydimethylsiloxane (PDMS) with different amounts of polydiethoxysiloxane as the cross-linker and untreated fumed silica nanoparticles (UFSN). The authors used AFM technique to observe the presence of the particles near the surface due to changes in its local stiffness. The amount of the cross-linker agent influenced the detection of the particles near the surface.
An interesting work is the one by Chen et al.[19], where polyester polyol/nanosilica composite resins were prepared by both in situ polymerization and blending methods; and they were analyzed by AFM non-contact tapping mode. Regarding the AFM analysis, this work shows the importance of sample preparation in the reliability of the results. Films were produced by casting the polyurethane in a tinned iron substrate, removed from the metallic plate and both faces, the one which was in contact with the metal (named interface) and the opposite surface (named surface) were observed. It was possible to observe and take conclusions about the size of the particles only by the observation of the interface. This suggests that the particles, in the case of the surface, are deeper than in the interface, and inaccessible to the AFM tip.
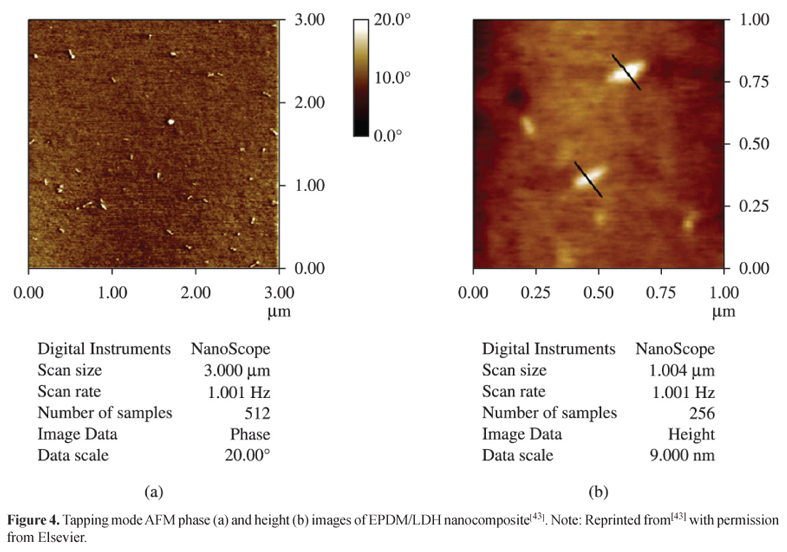
AFM is widely used by researchers in the study of clays dispersion in polymeric matrices, like some examples as follow. Acharya et al.[43] studied the dispersion of the Mg-Al Layered Double Hydroxide (LDH) in Ethylene Propylene Diene Terpolymer (EPDM) matrix by X-ray Diffraction (XRD), TEM, SEM and AFM. Clay lamellaes presented partial exfoliation in the rubber matrix, according to the results of all the techniques used in the work. According to the authors, the AFM images of the hybrids exhibited the sufficient intrinsic contrast between the inorganic LDH particles and the EPDM matrix. As a result, the technique can be used for the verification of lamellaes dispersion in polymeric matrices with confidence, given the evidence of their results by other techniques (Figures 3 and 4).
Ali et al.[44] used AFM images to determine the dispersion of organoclay Nanofil® in nanocomposites with matrix Hydrogenated Nitrile Rubber (HNBR) produced in an internal mixer. The images showed that in 25 minutes of mixing, the clay was fully exfoliated; while in the sample produced with only 3 minutes of mixing there were tactoids in the image due to the poor dispersion level of clay in comparison to nanocomposite produced with greater mixing time. Likewise, Basak et al.[50] analyzed the influence of unmodified Montmorillonite (MMT) clay on the cured adhesion of EPDM rubber. According to them, AFM images showed marginal enhancement of micro-roughness of the modified surfaces in comparison to unmodified EPDM cured, and as a result there was an improvement of the mechanical properties.
Maiti and Bhowmick[64] utilized AFM as an investigating tool to observe the morphology of the fluoroelastomer-clay nanocomposites, the dispersion of the clays in the rubber matrix, interface thickness, and interaction forces. According to the authors, the polymer/filler interaction was stronger in the case of unmodified clay filled sample. According to TEM results, the unmodified clay particles have thickness of about 1 nm and the modified clay in the filled samples has about 5 nm thick platelets. AFM study gives a higher particle thickness which may be due to the tip broadening effect. In a similar work, Sae-Oui et al.[58] prepared nanocomposites NR/acrylate rubber powder (ACMP) in an internal mixer, and studied the dispersion of the filler in the rubber matrix by AFM. A high level of ACMP dispersion was achieved in concentrations until 5 phr. As the ACMP loading increased until 5 phr, it was also observed an improvement in the tensile strength and, at a higher amount, there was an agglomeration of clay verified by AFM. The authors came to the conclusion using only the AFM, which shows the strength and importance of this technique, as also concluded by other researchers[17,69].
Samadi and Kashani[60] prepared nanocomposites of Butyl Rubber with 5 different organically modified Montmorillonite clay (OMMT) and analyzed the dispersion and distribution of the nanocomposites by SEM and AFM. The results of the both techniques confirmed the intercalated and possible partially exfoliated structure of the OMMT Cloisite® 10A in the butyl based rubber compound. The nanocomposites containing this clay obtained the best levels of clay dispersion.
Maji et al.[62] studied the helium gas permeation through Polyurethanes (PU) having microstructures derived from different polyols (varying from linear to hyperbranched) in the presence and absence of modified and unmodified clays. According to the results, the permeation rate of 8 wt% clay filled PU decreases by about 76% in comparison to the unfilled PU. The well dispersed modified clays contribute to the improvement of the barrier properties to a great extent when compared with the aggregated unmodified ones. It has been established a good correlation between dispersion of clays in the PU matrix, as characterized by high resolution TEM and AFM, and barrier resistance. Figure 5 presents a comparison between AFM image (a) and TEM image (b) and, according to the authors, it is clear that at 8 wt% clay loading, both the images depict the same trend of dispersion of clay in the PU matrix.
Rooj et al.[51] analyzed the influence of the addition of OMMT on the microstructure and fatigue crack growth behavior of CB filled NR composites. The microstructure was verified by TEM and AFM. According to TEM results, it was observed the presence of "nano-blocks" due to intermolecular interactions between clay and CB. The same behavior was observed by AFM, where rigid CB aggregates and clay tactoids dissociate into smaller particles during deformation. The "nano-blocks" act as a barrier to the growth of the crack, deviating and branching the crack tip. Mishra et al.[68] investigated the influence of OMMT on the photodegradation of silicone rubber. In this article, AFM was useful to show that the degradation induced by UV irradiation promoted a separation of the OMMT platelets from the polymer chains. This result was also observed by SEM.
Thomas et al.[61] analyzed the properties of NBR nanocomposites reinforced with fillers such as layered silicate (LS), calcium phosphate (CP) and titanium dioxide (TO). According to the authors, TEM and AFM images revealed the presence of well-dispersed silicate layers in the NBR matrix in comparison to CP and TO fillers indicating, further, that the silicate layers had a more pronounced reinforcement effect on NBR compared to CP and TO fillers.
Chen et al.[20] prepared Thermo-Sensitive Polyurethane (TSPU) solution containing different amounts of in situ-generated TiO2 nanoparticles via an organic/inorganic hybrid technique. The final nanocomposite membranes were prepared via solution casting. According to the results, depending on the temperature of the casting, completely opposite gas transport behaviors were observed. When the casting temperature was lower than the melting temperature of the soft segment, rigid TSPU chain could not pack efficiently around the TiO2 nanoparticles as the solvent evaporated, thereby resulting in higher free volume at the interface relative to the bulk polymer regions. This morphology did not have great influence on solubility, but increased free volume, allowing faster diffusion, which consequently contributed to the overall increasing in gas permeability coefficients of TSPU nanocomposite. The dispersion of TiO2 nanoparticles in the matrix could be clearly seen by AFM images.
In a recent work, Shimpi et al.[67] synthesized Al(OH)3 nanoparticles and added small amounts (0.5-2.0 wt%) in Millable Polyurethane (MPU), achieving enhanced mechanical, thermal and physical properties. TEM and AFM results showed nanofillers uniformly dispersed in the matrix with amounts until 2.0 wt%, and agglomeration with 2.5 wt%. Both results are also in good agreement.
Also with the purpose of studying the interaction between the elastomeric matrix (SBR) and nanofiller (silica), Kummali et al.[74] used a novel AFM method: nano-dielectric spectroscopy. In this technique, the interface between matrix and filler is analyzed by measuring its local dielectric behavior. The authors concluded that the interacting polymer layer share the same segmental relaxation dynamics with the bulk rubber due to the presence of a flexible chain between the matrix and the nanoparticles. Igarashi et al.[11] also used another novel AFM method for nanometer-scale mapping of the frequency dependence of viscoelastic properties of rubbers. It was used an additional piezoelectric actuator placed between the specimen and AFM scanner. The properties values obtained by AFM were almost identical to those obtained by macroscopic measurements, like the ones by Dynamical Mechanical Analysis (DMA). According to the authors, the mapping method can visualize the distribution of the frequency-dependent viscoelastic properties of rubber blend specimen on the nanometer scale. Another method to measure the Young's modulus of viscoelastic samples is the creep compliance mapping by AFM[75]. According to the authors, "In this method, the local creep compliance is evaluated by measuring the time-dependent sample indentation induced by force steps". This is another mode to use AFM that shows the versatility of the technique.
The AFM technique can be used in different investigations, beyond the study of nanocomposites. An interesting work is the study of the surface morphology of NR latex[37]. The authors used both the techniques of Confocal Fluorescence Microscopy and AFM for elucidating the nanostructured surface layer of NR latex particles, which are composed by a core-shell structure of the NR latex particle made up of a hydrophobic core of NR molecules surrounded by a mixed layer of proteins and phospholipids with 20 nm thick. There are other interesting examples in the literature that reinforce the versatility of the AFM technique, but they are out of the scope of this work.
In addition to the works already mentioned, some other authors also found good agreement between TEM and AFM techniques[23,51,61,62,65,66,71,76,77].
In the same way, some other authors found good agreement between SEM and AFM techniques[28,39,43,57,60,67-69,78], or even between TEM, SEM and AFM[54].
Polymer Blends Nanocomposites Based on Elastomers
Baghaei et al.[52] studied blends with Low Density Polyethylene (LDPE) as matrix and dispersed phase Ethylene-Octene rubber (POE), with addition of OMMT. AFM images of the composite material containing 71.25% of LDPE, 23.75% of POE and 5% of OMMT (in mass) show that the clay, which acts as a compatibilizer agent between the polymer phases, tends to be located in the interface between the phases, increasing the barrier effect of the blend and decreasing the coalescence between the rubber particles, with result in size reduction and greater irregularities in the shape of the particles. Tiwari and Paul[26] prepared Polypropylene (PP)/PP-g-MA/MMT/elastomer nanocomposites in a twin screw extruder at fixed 30 wt% elastomer and 0-7 wt% MMT content. According to the AFM images, the higher matrix viscosity in the presence of MMT significantly reduced the elastomer particles size. Similarly, Mirmohseni and Zavareh[39] investigated the morphology of the Epoxy/acrylonitrile-butadiene-styrene copolymer (ABS)/Cloisite® 30B clay ternary nanocomposite by AFM, SEM and Wide Angle X-ray Diffraction (WAXD) and observed a dispersion of the exfoliated clay platelets and nano-size ABS particles in epoxy matrix. Lim and Chow[29] produced nanocomposites Poly(Ethylene terephthalate) (PET)/OMMT by using twin screw extruder followed by injection molding. Maleic anhydride grafted styrene-ethylene/butylene-styrene (SEBS-g-MAH), a functionalized rubber, was used in order to improve the impact properties of the PET/OMMT nanocomposites. According to the AFM results (operated in dynamic force mode), the introduction of SEBS-g-MAH into PET/OMMT nanocomposites clearly changed the blend morphology. It could be observed a high adhesion between the phases due to the absence of darker colored gap surrounding the domains, where presumably the SEBS-g-MAH should embedded OMMT.
Ali et al.[21] used the method of Online Measurement Electrical Conductance (OMEC) for the morphology characterization development and kinetics of clay distribution in rubber blends during the mixing process. The method took into account results of different structural investigations like AFM. The authors used HNBR and NR as the polymer blend, and the organoclay Nanofil 9® as filler. They studied the dispersion of the lamellaes in each neat rubber and the dispersion in the blend to the study of the morphology evolution of the blend. The AFM images of the morphology evolution along the mixing time are showed in the Figure 6.
After 2, min a number of clay agglomerates (black dots) with a size of approx. 500 nm is visible in the NR phase (light area) and no clay in the HNBR phase (grey area). Increasing the mixing time, more clay is located in the HNBR phase. The AFM images of samples taken out at 25 and 40 min, presented at high magnification (Figure 7), clearly reveal a dominant localization of the clay tactoids in the HNBR domains. The morphology of the blend changed with mixing time.
According to the authors, both NR and HNBR molecules can intercalate into the clay galleries. The bi-intercaleted clay tactoids act as compatibilizer agent like a block copolymer. Therefore, the refinement of the blend morphology is caused by the compatibilizing effect of clay.
Lee et al.[22] analyzed the differences caused in the morphology of PP/Ethylene-Octene based elastomer blend with the addition of the MMT clay by AFM. Summarizing, the authors proposed a schematic illustration (Figure 8) to show the modifications in the elastomer particles with the addition of the MMT in the blend. Rheological and the "barrier" effects of the clay particles on the coalescence of rubber particles are the responsible for the modifications in shape and size of the elastomer particles.
Lee et al.[23], by using the same materials used in the previous work, analyzed in-depth the morphology of the PP/elastomer nanocomposites by TEM and AFM, including the quantitative investigation of the particle dispersion of phases along (FD) and transverse (TD) flow directions in the injection molded part. The results revealed that both clay and elastomer particles have anisotropic shapes, i.e. different effective length along the FD and TD directions. The increase of MMT and elastomer content enhanced the anisotropy of the particles. Additionally, particle analyses revealed that the dimensions of both clay and elastomer particles are highly dependent on the MMT concentration in the nanocomposite.
Even not being the aim of this work, but to reinforce the range of AFM technique, some authors use it for the study of morphology of blends type Elastomer Thermoplastic (TPE) and Thermoplastic Dynamic Vulcanizate (TPV)[17,24]. Shahbikian et al.[24] made a comparative study on the morphology development and the viscoelastic properties of uncross-linked and cross-linked EPDM/PP-based TPEs. The blends were prepared by using an internal mixer and a co-rotating twin screw extruder. According to AFM images, the presence of the plasticizer and the different processing equipment used affected the morphology of these blends. In uncross-linked blends (TPOs), the presence of the plasticizer and its probable elastic diffusion into the elastomeric phase resulted in a swollen and coalesced EPDM phase and therefore a coarser TPO morphology.
Gheno et al.[17] prepared blends type TPV and non-vulcanized Poly (vinyl chloride) PVC/NBR in an internal mixer and observed the differences between the morphologies by AFM. TPV blends presented well dispersed and elongated elastomeric particles in the PVC matrix, what improved the mechanical properties of these blends.
Siengchin and Karger-Kocsis[25] produced TPVs PP/EPDM filled with synthetic Boehmite Alumina (BA) via watermediated (WM) and direct melt compounding (DM) techniques. According to the authors, WM resulted in a finer dispersion of BA than DM, and the BA particles were mostly located in the matrix PP phase of the TPV.
Barick and Trupathy[53] prepared nanocomposites TPU/Carbon Nanofibers (CNFs) by melt intercalation technique followed by compression molding, and analyzed the dispersion of the CNFs in the matrix by different techniques, including AFM. According to the AFM images, CNFs presented a high level of dispersion via either covalent or ionic bonds between CNF and TPU. The nanofibers are preferentially associated with the soft segment of the TPU matrix, that developed sufficient wetting and interphase adhesion of the CNF with TPU. Due to the CNFs presence, the mechanical reinforcement of the TPU matrix was obtained.
Chen et al.[28] prepared peroxide dynamically vulcanized thermoplastic olefin (TPV) based on PP/EPDM loaded with zinc dimethacrylate (ZDMA). PP and EPDM phases were firstly removed by boiling xylene before the morphology analysis. In the SEM images of the blends containing ZDMA, large rubber aggregates could be observed, consisting of small rubber particles; what can be confirmed in the AFM images. Results of both techniques are similar.
Qi et al.[30] produced blends epoxy resin/carboxylic/acrylonitrile/butadiene rubber nanoparticle (CNBR-NP) and epoxy resin/acrylonitrile/butadiene rubber nanoparticle (NBR-NP). The authors used AFM to study the mechanism responsible for the simultaneous improvement in heat resistance and toughness of rubber-modified epoxies. According to the AFM images, the brown spheres corresponding to soft components (rubber nanoparticles), and around every CNBR-NP always exists a brighter ring (interfaces). The hard interfaces acted as in situ formed shells covering rubber nanoparticles and the shell was harder than epoxy matrix; these shells connected the rubber particles and epoxy matrix through covalent bonds. According to the authors, the formation of the hard shells should play the key role in increasing heat resistance of the CNBR-NP modified epoxy resins.
Spírková et al.[31] synthesized aliphatic polycarbonate-based Polyurethane (PC-PU) elastomers, as well as PC-PU filled with organically modified clays. AFM was used to study the size and shape of hard domains in the polyurethanes. According to the authors, hard domains in neat matrices, which are formed by hard segments and are also difficult to characterize (by X-ray or TEM), were detected and visualized by AFM on break surfaces.
Stelescu et al.[38] produced blends High Density Polyethylene (HDPE)/EPDM cured and non-cured, containing or not compatibilizer agent and analyzed different properties like mechanical and thermal. In the AFM images, it could be observed the crystalline regions supported by the phase contrast images of the samples. According to the authors, the vulcanized blend containing compatibilizer agent presented high crystallites orientation, which lead to the increase of the tensile strength and decrease in the elongation at break. The high crystallinity degree of the HDPE phase was also confirmed by the DSC results. Similar results were also obtained by Lewicki et al.[79], which observed the reduction in the crystallinity with the addition of polyhedral oligomeric silsequioxanes (POSS) in the methylene di-isocyanate-butanediol-poly (tetramethylene glycol) (MDI-BDO-PTMG) segmented PU elastomer.
Rams et al.[15] proposed a method for the quantification of the relative amount of crystallinity based on the roughness of the PE films, whereas Oderkerk et al.[36] analyzed TPV blends EPDM/Nylon-6 under stress by AFM as a way to collect information about the deformation and recovery behavior of the rubber and the matrix phase in TPVs during uniaxial stretching and subsequent stress relaxation. Summarizing, all these works show the versatility of the technique.
In a very recent work, Le et al.[66] analyzed the structure and morphology of CNTs filled ternary SBR/NBR/NR blends by TEM and AFM. CNTs mainly reside in the polar NBR and non-polar NR, but not in the weak polar SBR due to the presence of phospholipids in NR. According to the authors' words, "Phospholipid can act as coupling agent bonding the α-terminal of NR with the CNT surface through cation-π interactions, which make NR be competitive with NBR with respect to CNT hosting. AFM and TEM results are in good agreement. By using the same nanofiller, Xu et al.[40] investigated the rolling friction and wear of the compounds of peroxide-cured HNBR and fluororubber (FKM) with and without MWCNT against steel in an orbital rolling ball (steel)-on-plate (rubber) test rig. TEM and AFM were usefully used in the morphology study. Like in the previous work, both techniques evidenced that the CNTs were preferentially embedded in the HNBR matrix, whereas FKM formed the dispersed phase. The results also showed that the CNTs were not well dispersed in the matrix and even so its presence increased the friction and enhanced the wear resistance of the compounds.
Summary and Conclusion
Various works about characterization of nanofillers dispersion by using AFM technique have been presented. The dispersion level in polymer nanocomposites and polymer blends nanocomposites, both based on elastomers, has been extensively studied by using AFM successfully.
AFM analysis of the nanocomposites can be a good alternative to electron microscopy, without some limitations regarding contrast and resolution. In comparison to the conventional electron microscopy, AFM does not require a conductive coating or, in most times, staining. Hence, AFM can also measure fundamental properties of sample surfaces, like local adhesive or elastic properties in the nanometric scale[64].
In addition, the technique has been proven to be effective to distinguish between amorphous and crystalline phases within the same polymer and between different phases. The great advantage of AFM is that it allows access to the morphology of polymeric materials without the need for sample preparation which could alter it[15].
Additionally, the results obtained with AFM nanomechanical mapping indicate that this technique is very valuable in evaluation of the mechanical properties of polymer materials at a micro or nanoscale and to visualize the distribution of mechanical properties, which are not available by other conventional characterization methods[46].
Acknowledgements
The authors would like to thank FAPESP (process number 2010/15799-6) and CNPq (process number 201891/2011-5) for the financial support.
Received: Dec. 12, 2013
Revised: May 05, 2014
Accepted: June 11, 2014
- 1. Kaupp, P. - "Atomic Force Microscopy, Scanning Nearfield Optical Microscopy an Nanoscratching", Springer, Germany (2006).
- 2. Flores, S. M. & Toca-Herrera, J. L. - Nanoscale, 1, p.40 (2009). http://dx.doi.org/10.1039/b9nr00156e PMid:20644859
- 3. Passeri, D.; Rossi, M.; Tamburri, E. & Terranova, M. L. - Anal. Bioanal. Chem., 405, p.1463 (2013). http://dx.doi.org/10.1007/s00216-012-6419-3 PMid:23052864
- 4. Palacio, M. L. B. & Bhushan, B. - Crit. Rev. Solid State Mater. Sci., 35, p.73 (2010). http://dx.doi.org/10.1080/10408430903546691
- 5. Mannheimer, W. A. - "Microscopia dos materiais", E-Papers Serviços Editoriais, Rio de Janeiro (2002).
- 6. Sawyer, L. C.; Grubb, D. T. & Meyers, G. F. - "Polymer Microscopy", Springer, New York (2008).
- 7. Canevarolo Jr, S. V. - "Técnicas de Caracterização de Polímeros", Artliber, São Paulo (2003).
- 8. Jalili, N. & Laxminarayana, K. - Mechatronics., 14, p.907 (2004). http://dx.doi.org/10.1016/j.mechatronics.2004.04.005
- 9. Costa, C. A. R.; Rippel, M. M. & Galembeck, F. - Ciência e Tecnologia., 12, p.188 (2002).
- 10. Rueda, L.; Saralegui, A.; Fernández d'Arlas, B.; Zhou, Q.; Berglund, L. A.; Corcuera, M. A.; Mondragon, I. & Eceiza, A. - Carbohydr. Polym., 92, p.751 (2013). http://dx.doi.org/10.1016/j.carbpol.2012.09.093 PMid:23218363
- 11. Igarashi, T.; Fujinami, S.; Nishi, T.; Asao, N. & Nakajima, K. - Macromolecules., 46, p.1916 (2013). http://dx.doi.org/10.1021/ma302616a
- 12. Morozov, I. A. - Polym. Compos., 34, p.433 (2013). http://dx.doi.org/10.1002/pc.22430
- 13. Paul, D. R. & Bucknall, C. B. - "Polymer Blends: Formulation", Wiley-Interscience, United States (2000).
- 14. Raigoza, A. F.; Dugger, J. W. & Webb, L. J. - ACS Appl. Mater. Interfaces., 5, p.9249 (2013). http://dx.doi.org/10.1021/am4018048 PMid:23848270
- 15. Rams, J.; Lopez, A. J.; Sanchez, M.; Urena, A.; Leal, V.; Sanchez-Mariscal, B. & Lafuente, R. - Polym. Test., 31, p.136 (2012). http://dx.doi.org/10.1016/j.polymertesting.2011.09.010
- 16. Song, M.; Xia, H. S.; Yao, K. J. & Hourston, D. J. - Eur. Polym. J., 41, p.259 (2005). http://dx.doi.org/10.1016/j.eurpolymj.2004.09.012
- 17. Gheno, S. M.; Passador, F. R. & Pessan, L. A. - J. Appl. Polym. Sci., 117, p.3211 (2010).
- 18. Kiracofe, D.; Raman, A. & Yablon, D. - Beilstein J Nanotechnol., 4, p.385 (2013). http://dx.doi.org/10.3762/bjnano.4.45 PMid:23844344
- 19. Chen, Y.; Zhou, S.; Yang, H.; Gu, G. & Wu, L. - J. Colloid Interface Sci., 279, p.370 (2004). http://dx.doi.org/10.1016/j.jcis.2004.06.074 PMid:15464801
- 20. Chen, Y.; Wang, R.; Zhou, J.; Fan, H. & Shi, B. - Polymer., 52, p.1856 (2011). http://dx.doi.org/10.1016/j.polymer.2011.02.021
- 21. Ali, Z.; Le, H. H.; Ilisch, S.; Thurn-Albrecht, T. & Radusch, H.-J. - Polymer., 51, p.4580 (2010). http://dx.doi.org/10.1016/j.polymer.2010.08.002
- 22. Lee, H. S.; Fasulo, P. D.; Rodgers, W. R. & Paul, D. R. - Polymer., 46, p.11673 (2005). http://dx.doi.org/10.1016/j.polymer.2005.09.068
- 23. Lee, H. S.; Fasulo, P. D.; Rodgers, W. R. & Paul, D. R. - Polymer., 47, p.3528 (2006). http://dx.doi.org/10.1016/j.polymer.2006.03.016
- 24. Shahbikian, S.; Carreau, P. J.; Heuzey, M. C.; Ellul, M. D.; Cheng, J.; Shirodkar, P. & Nadella, H. P. - Polym. Eng. Sci., 52, p.309 (2012). http://dx.doi.org/10.1002/pen.22084
- 25. Siengchin, S. & Karger-Kocsis, J. - Compos Part A-Appl S., 41, p.768 (2010).
- 26. Tiwari, R. R. & Paul, D. R. - Polymer., 52, p.4955 (2011). http://dx.doi.org/10.1016/j.polymer.2011.08.019
- 27. Tiwari, R. R. & Paul, D. R. - Polymer., 52, p.5595 (2011). http://dx.doi.org/10.1016/j.polymer.2011.10.002
- 28. Chen, Y. K.; Xu, C.; Cao, L. & Wang, Y. - Polym. Compos., 33, p.1206 (2012). http://dx.doi.org/10.1002/pc.22250
- 29. Lim, S. R. & Chow, W. S. - J. Appl. Polym. Sci., 123, p.3173 (2012). http://dx.doi.org/10.1002/app.34980
- 30. Qi, G. C.; Zhang, X.; Li, B.; Song, Z. & Qiao, J. - Polymer Chemistry., 2, p.1271 (2011). http://dx.doi.org/10.1039/c0py00413h
- 31. Spirkova, M.; Pavlicevic, J.; Strachota, A.; Poreba, R.; Bera, O.; Kapralkova, L.; Baldrian, J.; Slouf, M.; Lazic, N. & Budinski-Simendic, J. - Eur. Polym. J., 47, p.959 (2011). http://dx.doi.org/10.1016/j.eurpolymj.2011.01.001
- 32. Chakrabarty, S.; Zhang, X.; Bharti, P.; Chujo, Y.; Miyake, J.; Wynne, K. J. & Yadavalli, V. K. - Polymer., 51, p.5756 (2010). http://dx.doi.org/10.1016/j.polymer.2010.09.053
- 33. Matejka, L.; Dukh, O.; Kamiová, H.; Hlavatá, D.; pírková, M. & Brus, J. - Polymer., 45, p.3267 (2004). http://dx.doi.org/10.1016/j.polymer.2004.03.033
- 34. Thunga, M.; Das, A.; Häußler, L.; Weidisch, R. & Heinrich, G. - Compos. Sci. Technol., 70, p.215 (2010). http://dx.doi.org/10.1016/j.compscitech.2009.09.014
- 35. Kalkornsurapranee, E.; Nakason, C.; Kummerlowe, C. & Vennemann, N. - J. Appl. Polym. Sci., 128, p.2358 (2013). http://dx.doi.org/10.1002/app.38201
- 36. Oderkerk, J.; de Schaetzen, G.; Goderis, B.; Hellemans, L. & Groeninckx, G. - Macromolecules., 35, p.6623 (2002). http://dx.doi.org/10.1021/ma0113475
- 37. Nawamawat, K.; Sakdapipanich, J. T.; Ho, C. C.; Ma, Y. J.; Song, J. & Vancso, J. G. - Colloid Surface A., 390, p.157 (2011).
- 38. Stelescu, D. M.; Airinei, A.; Homocianu, M.; Fifere, N.; Timpu, D. & Aflori, M. - Polym. Test., 32, p.187 (2013). http://dx.doi.org/10.1016/j.polymertesting.2012.10.010
- 39. Mirmohseni, A. & Zavareh, S. - J. Polym. Res., 17, p.191 (2010). http://dx.doi.org/10.1007/s10965-009-9305-8
- 40. Xu, D.; Karger-Kocsis, J.; Major, Z. & Thomann, R. - J. Appl. Polym. Sci., 112, p.1461 (2009). http://dx.doi.org/10.1002/app.29513
- 41. Bhattacharyya, S.; Sinturel, C.; Bahloul, O.; Saboungi, M.-L.; Thomas, S. & Salvetat, J.-P. - Carbon., 46, p.1037 (2008). http://dx.doi.org/10.1016/j.carbon.2008.03.011
- 42. Bokobza, L. - Polymer., 48, p.4907 (2007). http://dx.doi.org/10.1016/j.polymer.2007.06.046
- 43. Acharya, H.; Srivastava, S. K. & Bhowmick, A. K. - Compos. Sci. Technol., 67, p.2807 (2007). http://dx.doi.org/10.1016/j.compscitech.2007.01.030
- 44. Ali, Z.; Le, H. H.; Ilisch, S. & Radusch, H. J. - J. Mater. Sci., 44, p.6427 (2009). http://dx.doi.org/10.1007/s10853-009-3892-y
- 45. Zhang, H. L.; Jia, X. J.; Yu, J. Y. & Xue, L. H. - Construct. Build. Mater., 40, p.224 (2013). http://dx.doi.org/10.1016/j.conbuildmat.2012.09.103
- 46. Wang, D.; Nakajima, K.; Fujinami, S.; Shibasaki, Y.; Wang, J.-Q. & Nishi, T. - Polymer., 53, p.1960 (2012). http://dx.doi.org/10.1016/j.polymer.2012.02.046
- 47. Pangon, A.; Dillon, G. P. & Runt, J. - Polymer., 55, p.1837 (2014). http://dx.doi.org/10.1016/j.polymer.2014.02.009
- 48. Wang, D.; Fujinami, S.; Nakajima, K.; Niihara, K.-; Inukai, S.; Ueki, H.; Magario, A.; Noguchi, T.; Endo, M. & Nishi, T. - Carbon., 48, p.3708 (2010). http://dx.doi.org/10.1016/j.carbon.2010.06.014
- 49. Wang, D.; Fujinami, S.; Nakajima, K.; Inukai, S.; Ueki, H.; Magario, A.; Noguchi, T.; Endo, M. & Nishi, T. - Polymer., 51, p.2455 (2010). http://dx.doi.org/10.1016/j.polymer.2010.03.052
- 50. Basak, G. C.; Bandyopadhyay, A. & Bhowmick, A. K. - Int. J. Adhes. Adhes., 31, p.209 (2011). http://dx.doi.org/10.1016/j.ijadhadh.2011.02.001
- 51. Rooj, S.; Das, A.; Morozov, I. A.; Stockelhuber, K. W.; Stocek, R. & Heinrich, G. - Compos. Sci. Technol., 76, p.61 (2013). http://dx.doi.org/10.1016/j.compscitech.2012.12.020
- 52. Baghaei, B.; Jafari, S. H.; Khonakdar, H. A.; Rezaeian, I.; As'habi, L. & Ahmadian, S. - Polym. Bull., 62, p.255 (2009). http://dx.doi.org/10.1007/s00289-008-0010-2
- 53. Barick, A. K. & Tripathy, D. K. - J. Appl. Polym. Sci., 124, p.765 (2012). http://dx.doi.org/10.1002/app.35066
- 54. Odent, J.; Leclere, P.; Raquez, J. M. & Dubois, P. - Eur. Polym. J., 49, p.914 (2013). http://dx.doi.org/10.1016/j.eurpolymj.2012.12.006
- 55. Ellul, M. D.; Tsou, A. H. & Hu, W. - Polymer., 45, p.3351 (2004). http://dx.doi.org/10.1016/j.polymer.2004.03.029
- 56. Mertz, G.; Hassouna, F.; Leclere, P.; Dahoun, A.; Toniazzo, V. & Ruch, D. - Polym. Degrad. Stabil., 97, p.2195 (2012). http://dx.doi.org/10.1016/j.polymdegradstab.2012.08.008
- 57. Cao, Z. Q.; Wang, D. G.; Cong, C. B.; Wang, Y. F. & Zhou, Q. - Tribol. Int., 69, p.141 (2014). http://dx.doi.org/10.1016/j.triboint.2013.09.011
- 58. Sae-Oui, P.; Sirisinha, C. & Hatthapanit, K. - J Elastom Plast., 42, p.139 (2010). http://dx.doi.org/10.1177/0095244310362733
- 59. Khalid, M.; Ismail, A. F.; Ratnam, C. T.; Faridah, Y.; Rashmi, W. & Al Khatib, M. F. - Radiat. Phys. Chem., 79, p.1279 (2010). http://dx.doi.org/10.1016/j.radphyschem.2010.07.002
- 60. Samadi, A. & Kashani, M. - J. Appl. Polym. Sci., 116, p.2101 (2010).
- 61. Thomas, P. C.; Thomas, S. P.; George, G.; Thomas, S. & Kuruvilla, J. - J. Polym. Res., 18, p.2367 (2011). http://dx.doi.org/10.1007/s10965-011-9651-1
- 62. Maji, P. K.; Das, N. K. & Bhowmick, A. K. - Polymer., 51, p.1100 (2010). http://dx.doi.org/10.1016/j.polymer.2009.12.040
- 63. Russo, P.; Acierno, D.; Marletta, G. & Destri, G. L. - Eur. Polym. J., 49, p.3155 (2013). http://dx.doi.org/10.1016/j.eurpolymj.2013.07.021
- 64. Maiti, M. & Bhowmick, A. K. - Polymer., 47, p.6156 (2006). http://dx.doi.org/10.1016/j.polymer.2006.06.032
- 65. Le, H. H.; Oßwald, K.; Wießner, S.; Das, A.; Stöckelhuber, K.-W.; Boldt, R.; Gupta, G.; Heinrich, G. & Radusch, H.-J. Polymer., 54, p.7009 (2013). http://dx.doi.org/10.1016/j.polymer.2013.10.038
- 66. Le, H. H.; Sriharish, M. N.; Henning, S.; Klehm, J.; Menzel, M.; Frank, W.; Wiessner, S.; Das, A.; Stockelhuber, K. W.; Heinrich, G. & Radusch, H. J. - Compos. Sci. Technol., 90, p.180 (2014).
- 67. Shimpi, N. G.; Sonawane, H. A.; Mali, A. D. & Mishra, S. - Polym. Bull., 71, p.515 (2014). http://dx.doi.org/10.1007/s00289-013-1074-1
- 68. Mishra, S.; Shimpi, N. G. & Mali, A. D. - Macromol Res., 21, p.466 (2013). http://dx.doi.org/10.1007/s13233-013-1035-4
- 69. Olmos, D.; Prolongo, S. G. & González-Benito, J. - Compos., Part B Eng., 61, p.307 (2014). http://dx.doi.org/10.1016/j.compositesb.2014.01.054
- 70. Neves, B. R. A.; Vilela, J. M. C. & Andrade, M. S. - Ceramica., 44, p.212 (1998). http://dx.doi.org/10.1590/S0366-69131998000600002
- 71. Bokobza, L.; Rahmani, M.; Belin, C.; Bruneel, J. L. & El Bounia, N. E. - J. Polym. Sci., B, Polym. Phys., 46, p.1939 (2008). http://dx.doi.org/10.1002/polb.21529
- 72. Ando, T. - Nanotechnology., 23, p.1 (2012). http://dx.doi.org/10.1088/0957-4484/23/6/062001
- 73. Stanier, D. C.; Patil, A. J.; Sriwong, C.; Rahatekar, S. S. & Ciambella, J. - Compos. Sci. Technol., 95, p.59 (2014). http://dx.doi.org/10.1016/j.compscitech.2014.02.007
- 74. Kummali, M. M.; Miccio, L. A.; Schwartz, G. A.; Alegría, A.; Colmenero, J.; Otegui, J.; Petzold, A. & Westermann, S. - Polymer., 54, p.4980 (2013). http://dx.doi.org/10.1016/j.polymer.2013.07.032
- 75. Braunsmann, C.; Proksch, R.; Revenko, I. & Schäffer, T. E. Polymer.., 55, p.219 (2014). http://dx.doi.org/10.1016/j.polymer.2013.11.029
- 76. Radovanovic, E.; Carone, E. Jr & Goncalves, M. C. - Polym. Test., 23, p.231 (2004). http://dx.doi.org/10.1016/S0142-9418(03)00099-0
- 77. Ma, R.; Liu, Z.; Takada, K.; Iyi, N.; Bando, Y. & Sasaki, T. - J. Am. Chem. Soc., 129, p.5257 (2007). http://dx.doi.org/10.1021/ja0693035 PMid:17394321
- 78. Porfyrakis, K.; Assender, H. E. & Robinson, I. M. - Polymer., 43, p.4769 (2002). http://dx.doi.org/10.1016/S0032-3861(02)00286-0
- 79. Lewicki, J. P.; Harley, S. J.; Loui, A.; Pielichowski, K.; Mayer, B. P.; Janowski, B. & Maxwell, R. S. - Silicon., 5, p.205 (2013). http://dx.doi.org/10.1007/s12633-013-9147-1
Corresponding author:
Publication Dates
-
Publication in this collection
19 Jan 2015 -
Date of issue
Dec 2014
History
-
Accepted
11 June 2014 -
Reviewed
05 May 2014 -
Received
12 Dec 2013