Abstract
Polyphenolic resol resins were obtained from an ethanolic extraction of green plantain peels (Musa paradisiaca) grown in Colombia. A synthesis was then performed by polycondensation in an alkaline pH solution in order to perform research on phenolic resin production with high mechanical performance. The polymers were characterized by DSC and TGA analyses and the resins showed a melting point of 94 °C and the typical properties of resol resins. Moreover, the synthesis was controlled using the infrared technique (FTIR) where different organic functional groups present in the polymers obtained are observed. The obtained resins were used as heavy metal adsorbents in which the content of those toxic agents is measured by Atomic Absorption Analysis (AA) indicating that these resins have a high retention affinity to Pb+2, Ni+2 and Cr+3 (79.01%, 98.48%, 94.14%, respectively) as determined by Freundlich isotherms.
Keywords:
resol resins; differential scanning calorimetry; infrared spectroscopy; thermogravimetry; freundlich isotherms; toxic heavy metal adsorbents
1 Introduction
Nowadays, the majority of us see the contamination of water streams and the dumping of industrial, agricultural and domestic wastewater into natural resources as an increasingly growing global problem, which will continue to affect life on the planet. For this reason, it is necessary to implement methods and cleaning techniques to treat disposable waste and water supplies that affect our health. Different studies show that some materials that adsorb heavy metals have been investigated and prepared at low costs to replace the materials that have been used in a conventional way such as activated carbon and zeolites[11 Bailey, S. E., Olin, T. J., Bricka, R., & Adrian, D. (1999). A Review of Potentially Low-Cost Sorbents for Heavy Metals. Water Research, 33(11), 2469-2479. http://dx.doi.org/10.1016/S0043-1354(98)00475-8.
http://dx.doi.org/10.1016/S0043-1354(98)...
]. Besides, the different biosorption mechanisms that retain the heavy metals introduced into the environment as contaminants have been examined by analysis of adsorption isotherms. Meanwhile, agricultural waste material shows many advantages when used within the adsorption processes; for instance, low cost, high efficiency, chemical and biological residual reduction, easy regeneration of the adsorbents and a high selectivity towards selected cations[22 Sud, D., Mahajan, G., & Kaur, M. P. (2008). Agricultural waste material as potential adsorbent for sequestering heavy metal ions from aqueous solutions - a review. Bioresource Technology, 99(14), 6017-6027. http://dx.doi.org/10.1016/j.biortech.2007.11.064. PMid:18280151.
http://dx.doi.org/10.1016/j.biortech.200...
]. The purpose of the present study is to provide enough thermal information about the different aspects of heavy metal adsorbents from green plantain peel (Musa paradisiaca) ethanolic extract to be used in the purification of wastewater, taking into account the high retention capacity and selectivity to heavy metals of these cheap materials according to isotherm analyses.
2 Experimental
2.1 Adsorbent resin synthesis
The Bakelite adsorbents of resol types, supported on hydrolyzed Raw Ethanolic Extracts (REE) of green plantain peels, were prepared by polycondensation in alkaline media, with formaldehyde addition in variable amounts as polymerization catalyst.
2.2 Thermal analysis by Differential Scanning Calorimetry (DSC)
The thermal behavior of the samples was studied by means of DSC using 2920 MODULATED TA INSTRUMENTS equipment. The obtained samples from the different syntheses of the resol resins were scanned between -50 °C ≤ T ≤ 250 °C at a heating rate of 10 °C min-1 with a nitrogen flow rate of 50 mL min-1. Analyzed samples had weights between 2.5 mg and 4.86 mg.
2.3 Thermal analysis by Thermogravimetry (TGA)
The TGA analyses are important because they determine the sample weight loss as a function of temperature, and were conducted using a TGA 2050 TA INSTRUMENT THERMOGRAVIMETRIC ANALYZER. Samples were heated at 10 °C min-1 under a nitrogen flow rate of 50mL min-1 from room temperature to 400 °C. Weights between 3.41 mg and 4.86 mg of each sample were analyzed.
2.4 Resol resins for heavy metal adsorption
For the adsorption of toxic metals of interest, different criteria were considered regarding the homogenization method with the purpose of getting compatible results between them by the use of different statistic analyses and to establish an experimental procedure for the determination of the amount of cations retained by the resins. To do this, several heavy metal solutions were prepared to represent an initial concentration ([]0) from 12 ppm to 20 ppm, diluted from the standards of Pb+2, Ni+2 and Cr+3 for atomic absorption with nitric acid at 1%. These solutions were used as the column feed (glass columns with 30 cm in length and a diameter of 1 cm), which consisted of a stationary phase of the resol resin where 6 g of this wet resin were introduced into the column. The eluent collected represented the final retained concentration ([]f). An acid digestion was made to the liquid obtained from the retention. Samples were diluted with 10 mL of distilled water and nitric acid at 1%. Finally, the solutions with []0 and []f were analyzed by means of Atomic Absorption (AA) in order to determine the actual composition and determine each column concentration gradient with the toxic cations determined.
2.5 Fourier-Transform Infrared Spectroscopy (FTIR) studies
A Bruker FT-IR Spectrophotometer was used for recording the FT-IR spectrum in the region from 500 - 4000 cm-1 in order to observe the different organic functional groups present in the extracts and in the polymers obtained. Film samples were cut into small pieces (10 mm - 10 mm) and dehydrated in a desiccator containing silica gel for 3 weeks.
3 Results and Discussion
3.1 Thermal analysis of phenolic resins by Differential Scanning Calorimetry (DSC)
The thermal event characterization of the resol resins was performed between -50 °C and 250 °C; different behaviors could be observed, which allow us, at the same time, to identify the different physical changes that occur in the polymer structure[33 Alonso, M., Oliet, M., Pérez, J., Rodríguez, F., & Echeverría, J. (2004). Determination of curing kinetic parameters of lignin-phenolformaldehyde resol resins by several dynamic diferential scanning calorimetry methods. Thermochimica Acta, 419(1-2), 161-167. http://dx.doi.org/10.1016/j.tca.2004.02.004.
http://dx.doi.org/10.1016/j.tca.2004.02....
]. We have to remember that the resol resins are classified within thermo stable polymers which are degraded at high temperature at the melting point, since there is a polymorphic arrangement inside its crystalline structure, normal for a polymer belonging to a biological system, showing them a non uniform configuration[44 Tejado, A., Peña, C., Labidi, J., Echeverria, J. M., & Mondragon, I. (2007). Physico-chemical characterization of lignins from different sources for use in phenol-formaldehyde resin synthesis. Bioresource Technology, 98(8), 1655-1663. http://dx.doi.org/10.1016/j.biortech.2006.05.042. PMid:16843657.
http://dx.doi.org/10.1016/j.biortech.200...
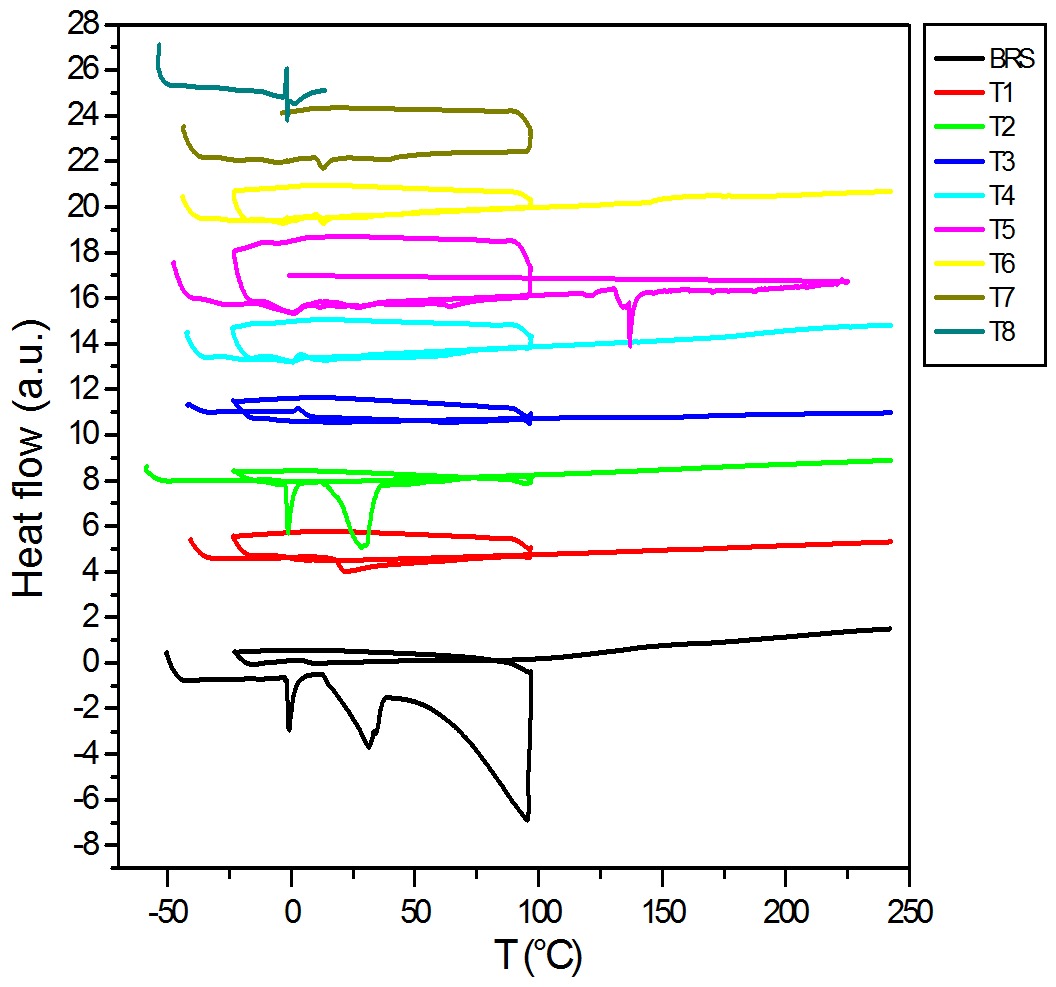
]. This can be visualized in the thermogram (Figure 1) of the Bakelite Resol Standard (BRS) resin and the tannin resol resin (T2) synthesized from plantain peels with the other resol resins using different catalyst concentrations (T1-T8), making it possible to compare all the thermal transitions.

DSC thermogram of resol phenolic resins synthesized from extracts at different catalyst concentrations.
First, for the BRS, there was a perfectly defined jellification phase at -0.71 °C, very similar to that shown in the T2 thermogram at -1.07 °C, where the crystals could adopt a uniform shape. This transition was followed by a polymeric calorific capacity rise due to glass point transition (Tg) within a temperature range from 6 °C to 12 °C in BRS and from 10 °C to 12 °C for to T2. When both polymers crystallized, the corresponding exothermal crystallization transition (Tc) could be visualized above the Tg, at 31.44 °C for both resins, where the two crystals have adopted defined crystalline structures. These depress shows that the polymer is probably able to crystallize[55 Domínguez, J., Alonso, M., Oliet, M., Rojo, E., & Rodríguez, F. (2010). Chemorheological study of the curing kinetics of a phenolic resol resin gelled. European Polymer Journal, 46(6), 1237-1243. ]. If the heating of our polymer is raised above its Tc, we arrive to the final thermal transition, the melting point (Tm), that was defined above 94 °C. When such a temperature was reached, the resin crystals started to separate from one another and the chains left their arrangements leading to free movement. The melting point is a first order transition, which means that when the melting point is reached, the polymer temperature will not increase until all the crystals have melted. To summarize, we observed that the BRS and T2 resins showed very similar behaviors. The rest of the resins showed a typical amorphous structural behavior, because they did not exhibit the transitions of a hard plastic (typical of Bakelite) with its characteristic Tc and Tm, as was the case with the T1 resin. Even so, the other resins exhibited a thermo-plastic behavior since they did not show any degradation when reaching the melting point (Tm) and continued showing, when the isotherm was applied, the same transitions with different intensities (Table 1). This is possibly due to incomplete polymerization and, perhaps, due to intermolecular forces and steric effects inside the polymer being reduced[33 Alonso, M., Oliet, M., Pérez, J., Rodríguez, F., & Echeverría, J. (2004). Determination of curing kinetic parameters of lignin-phenolformaldehyde resol resins by several dynamic diferential scanning calorimetry methods. Thermochimica Acta, 419(1-2), 161-167. http://dx.doi.org/10.1016/j.tca.2004.02.004.
http://dx.doi.org/10.1016/j.tca.2004.02....
].
3.2 Thermogravimetrical analysis (TGA)
The weight losses of the different synthesized resins were analyzed by thermogravimetry[66 Wang, M., Leitch, M., & Charles, C. (2009). Synthesis of phenol-formaldehyde resol resins using organosolv pine lignins. European Polymer Journal, 45(12), 3380-3388. http://dx.doi.org/10.1016/j.eurpolymj.2009.10.003.
http://dx.doi.org/10.1016/j.eurpolymj.20...
]. This suggests, as a typical property of the phenolic resins, that the aforementioned polymers had a high stability when exposed to different heat scanning. Figure 2 shows the different thermal stability profiles of the obtained phenolic resins.

For the T2 resin, free water loss was observed at 60 °C since such a polymer, as well as the other resins, has a biological origin and, therefore, large free water amounts[77 Chen, Y., Chen, Z., Xiao, S., & Liu, H. (2008). A novel thermal degradation mechanism of phenol–formaldehyde type resins. Thermochimica Acta, 476(1-2), 39-43. http://dx.doi.org/10.1016/j.tca.2008.04.013.
http://dx.doi.org/10.1016/j.tca.2008.04....
]. Besides, it is important to take into account that the majority of these structures exhibited a weight loss above 150 °C since it was pointed out before; these structures are possibly degraded if they are heated above the melting point temperature[88 Pérez, J., & Fernández, A. (2011). Thermal stability and pyrolysis kinetics of lignin-phenol-formaldehyde resins. Journal of Applied Polymer Science, 123(5), 3036-3045. http://dx.doi.org/10.1002/app.34817.
http://dx.doi.org/10.1002/app.34817...
]. The BRS showed a particular behavior since water loss started at the beginning of the analysis, but weight remained relatively constant above 200 °C[88 Pérez, J., & Fernández, A. (2011). Thermal stability and pyrolysis kinetics of lignin-phenol-formaldehyde resins. Journal of Applied Polymer Science, 123(5), 3036-3045. http://dx.doi.org/10.1002/app.34817.
http://dx.doi.org/10.1002/app.34817...
]. This may be due to the formation of a great quantity of water molecules during the condensation synthesis of the polymer and a high grade of polymerization and to the drying processes, which give the hard plastic a great thermal stability due to the formation of a great molecular network when having phenolic groups with reactive carbons towards substitution by formaldehyde[66 Wang, M., Leitch, M., & Charles, C. (2009). Synthesis of phenol-formaldehyde resol resins using organosolv pine lignins. European Polymer Journal, 45(12), 3380-3388. http://dx.doi.org/10.1016/j.eurpolymj.2009.10.003.
http://dx.doi.org/10.1016/j.eurpolymj.20...
]. It is most likely that this phenomenon does not occur in T2 since the monomer (polyphenolic metabolites) possesses high quantities of aromatic carbons substituted from their starting level which possibly limit the polymerization. The T1 resin showed greater stability due to the high grade of crystallinity that the amorphous polymers have. Despite the low grade of polymerization of the other resins, they could present an additional curing process due to extended heating[99 Zhao, Y., Yan, N., & Feng, M. (2013). Thermal degradation characteristics of phenol–formaldehyde resins derived from beetle infested pine barks. Thermochimica Acta, 555, 46-52. http://dx.doi.org/10.1016/j.tca.2012.12.002.
http://dx.doi.org/10.1016/j.tca.2012.12....
].
3.3 Heavy metal adsorption determination
In order to measure the adsorption, the cation quantity retained by the resol resins was determined by the atomic absorption technique. This technique proved that it could be used for this type of study[1010 Silva, E. L., & Roldan, P. S. (2009). Simultaneous flow injection preconcentration of lead and cadmium using cloud point extraction and determination by atomic absorption spectrometry. Journal of Hazardous Materials, 161(1), 142-147. http://dx.doi.org/10.1016/j.jhazmat.2008.03.100. PMid:18456398.
http://dx.doi.org/10.1016/j.jhazmat.2008...
]. The results are shown in the Table 2.
Thus, we obtained a retention percentage from the Polyphenolic Resin (PR) of 79.01% for the Pb+2, 98.48% for Ni+2 and 94.14% for Cr+3, these high percentage retention is possibly due by the different organic group present in the resin (amines, carbonyls, ethers, etc) while in Bakelite Resol Standard (BRS) only has hydroxyl groups for the metal retention. The determination of the Freundlich adsorption isotherms (Figure 3) was adapted to the experimental conditions in which a physical process was made. This process did not show changes in the molecular configuration when the cations had been adsorbed[1111 Coles, C., & Yong, N. (2005). Use of equilibrium and initial metal concentrations in determining freundlich isotherms for soils and sediments. Engineering Geology, 85(1-2), 19-25. http://dx.doi.org/10.1016/j.enggeo.2005.09.023.
http://dx.doi.org/10.1016/j.enggeo.2005....
]. Freundlich's model assumes that the sorbent surface is heterogeneous and the sorption positions have different affinities; where, the major affinity positions are filled at the beginning, and then the other spaces are periodically filled[1111 Coles, C., & Yong, N. (2005). Use of equilibrium and initial metal concentrations in determining freundlich isotherms for soils and sediments. Engineering Geology, 85(1-2), 19-25. http://dx.doi.org/10.1016/j.enggeo.2005.09.023.
http://dx.doi.org/10.1016/j.enggeo.2005....
].

In the graphics of this mathematic model (Equation 1) the sorption of low metal concentration was illustrated since this profile does not assume saturation phenomena[1212 Mohan, D., & Pittman, C. U., Jr (2006). Activated carbons and low cost adsorbents for remediation of tri- and hexavalent chromium from water. Journal of Hazardous Materials, 137(2), 762-811. http://dx.doi.org/10.1016/j.jhazmat.2006.06.060. PMid:16904258.
http://dx.doi.org/10.1016/j.jhazmat.2006...
]. We took into account (Equation 2) of logarithmic linearity, which allowed us to calculate the K value that represents a constant of equilibrium that defined the capacity in terms of mg of adsorbed metals/g of adsorbent, and the 1=n value which is a constant referred to the affinity or adsorption energy between the adsorbent and the adsorbate[1313 Chubar, N., Carvalho, J., & Correia, M. (2004). Heavy metals biosorption on cork biomass: effect of the pre-treatment. Colloids and Surfaces. A, Physicochemical and Engineering Aspects, 238(1-3), 51-58. http://dx.doi.org/10.1016/j.colsurfa.2004.01.039.
http://dx.doi.org/10.1016/j.colsurfa.200...
].
According to previous results, the metals were adsorbed by the T2 phenolic resin, showing a high capacity to perform this work. However, it was observed that the T2 column had a high capacity to retain both Ni+2 and Cr+3 with maximums of 71.43 and 64.32, respectively (Table 3). The Pb+2 retention values were low since this heavy metal needs to be adsorbed in acidic conditions[1414 Kadirvelu, K., Thamaraiselvi, K., & Namasivayam, C. (2001). Removal of heavy metals from industrial wastewaters by adsorption onto activated carbon prepared from an agricultural solid waste. Bioresource Technology, 76(1), 63-65.. http://dx.doi.org/10.1016/S0960-8524(00)00072-9. PMid:11315812.
http://dx.doi.org/10.1016/S0960-8524(00)...
].
We could also observe that at high grades of polymerization, there are major amounts of hydroxyl, carbonyls and ether groups that have a possible, direct responsibility for this adsorption (Figure 3).
3.4 Fourier-Transform Infrared Spectroscopy (FTIR) analysis
The FTIR spectra were very useful to determine functional groups present in the extracts and samples obtained. Figure 4 shows the different structural changes that raw materials suffered after being isolated from their vegetable matrixes or during the treatment as starting material for the phenolic resin synthesis.

As was observed, for the Raw Ethanolic Extract (REE), the corresponding signals at 3417 cm-1, 2927 cm-1 and 2854 cm-1 are typical of the carboxylic acid vibration due to its high content of gallic acid and to other similar structures like carbohydrates and coumarins with phenolic groups. At the same time, it was possible to confirm this evidence by the peak of symmetrical enlargement observed at 1731 cm-1, characteristic of the aromatic carboxylic acids possibly substituted by a methoxy or an acetate group or lactone groups. Also, the existence of polysubstituted aromatic groups was detected due to enlargement signals between 1400 cm-1 and 1600 cm-1 with medium intensity[1515 Zhao, Y., Yan, N., & Feng, M.(2013). Biobased phenol formaldehyde resins derived from beetle-infested pine barks: structure and composition. ACS Sustenable Chemistry and Engineering, 1(1), 91-101.]. This is why we probably could find aromatic amides in the extracts, evidenced by the low intensity signals between 1000 cm-1 and 1200 cm-1 due to the probable absorption of a few groups at this frequency[1616 Pelissari, F., Andrade-Mahecha, M., Do Amaral Sobral, P., & Menegalli, F. (2013). Comparative study on the properties of flour and starch films of plantain bananas (. Musa paradisiaca)Food Hydrocolloids, 30(2), 681-690. http://dx.doi.org/10.1016/j.foodhyd.2012.08.007.
http://dx.doi.org/10.1016/j.foodhyd.2012...
].
As mentioned above, there is a great variety of signals in the REE that can be attributed to many functional groups; at the same time, they can be present or absent after synthesis or fractionation steps. This is the case for T2 and BRS which were obtained by condensation with formaldehyde under alkaline pH, showing a similar profile. An important absorption can be visualized at 3417 cm-1 accompanied by a very tenuous signal at 2927 cm-1which indicates the presence of hydroxyl aromatic groups typical of carboxyl acid. In the same way, a deformation of the plane was observed at 1454 cm-1 that could indicate the presence of methylene groups (R-CH2-R), substituted by aromatic groups[1717 Huang, C. B., Jeng, R., Sain, M., Saville, B. A., & Hubbes, M. (2006). Production, characterization, and mechanical properties of starch modified by . Ophiostoma sppBioResources, 1(2), 257-269.]. Surely, the signal at 1600 cm-1 corresponds to the polysubstituted aromatic rings. We can observe that if the resins are submitted to a curing process, the excess of formaldehyde would be reduced as the carbonyl group signal does not appear. However, we can observe some absorption at 1100 cm-1 which could be attributed to the presence of compounds produced by the ether condensation process. As a result, we can deduce that, possibly, phenolic resins with tannic and other similar monomers can be designed.
When the crystal called PFE (Polyphenols Fractionated Extract) were isolated using Liquid Chromatography (LC), the corresponding spectral analysis led to these results: An intense signal in the 3400 cm-1 region, which indicates the presence of a benzoic acid structure[1818 Kizil, R., Irudayaraj, J., & Seetharaman, K. (2002). Characterization of irradiated starches by using FT-Raman and FTIR spectroscopy. Journal of Agricultural and Food Chemistry, 50(14), 3912-3918. http://dx.doi.org/10.1021/jf011652p. PMid:12083858.
http://dx.doi.org/10.1021/jf011652p...
,1919 Krishnan, R., & Maru, G. (2006). Isolation and analyses of polymeric polyphenol fractions from black tea. Food Chemistry, 94(3), 331-340. http://dx.doi.org/10.1016/j.foodchem.2004.11.039.
http://dx.doi.org/10.1016/j.foodchem.200...
]. This signal is accompanied by another weak signal around 2900cm-1. In the same way as the other spectra, we could observe that the band at 1600 cm-1 may belong to the same substituted aromatic rings, where double bonds of 6 members have enlargement frequencies and annular tension at this wave number. The aromatic compounds have a fingerprint region, including the absorptions from 1000 cm-1 to 1200 cm-1[2020 Poljanšek, I., & Krajnc, M. (2005). Characterization of phenol-formaldehyde prepolymer resins by in line FT-IR spectroscopy. Acta Chimica Slovenica, 52(3), 238-244.]. These results confirm the pholyphenolic structures of the gallic acid type in the PFE.
4 Conclusions
According to the DSC and TGA analyses, the phenolic resins have a great thermal stability. Nevertheless, the resin that had a similar profile as BRS was the T2 resin with polymorphic crystalline structure. It was evidenced when we observed that some polymers did not have a rigidity comparable with the other control resin (BRS) according to the profiles showed in the DSC and TGA thermograms. Freundlich's isotherms were utilized to determine the adsorption capacity coefficient of the resin, and the affinity adsorption efficiency was high for Cr+3 and Ni+2, while a medium efficiency was obtained for Pb+2. FTIR spectra revealed that our polymer was composed of polyphenols.
5. Acknowledgements
The authors wish to thank Dr. Julian Andres Caballero Narvaez and Dr. Joaquin Angel Rodriguez for assistance with the manuscript. The development of the thermal analysis by Dr. Ruben Antonio Vargas Zapata and Dr. Jesus Roberto Castillo Chamorro for helpful discussions. This work was supported by the University of Quindío and the University of Valley (Colombia).
6. References
-
1Bailey, S. E., Olin, T. J., Bricka, R., & Adrian, D. (1999). A Review of Potentially Low-Cost Sorbents for Heavy Metals. Water Research, 33(11), 2469-2479. http://dx.doi.org/10.1016/S0043-1354(98)00475-8.
» http://dx.doi.org/10.1016/S0043-1354(98)00475-8 -
2Sud, D., Mahajan, G., & Kaur, M. P. (2008). Agricultural waste material as potential adsorbent for sequestering heavy metal ions from aqueous solutions - a review. Bioresource Technology, 99(14), 6017-6027. http://dx.doi.org/10.1016/j.biortech.2007.11.064. PMid:18280151.
» http://dx.doi.org/10.1016/j.biortech.2007.11.064 -
3Alonso, M., Oliet, M., Pérez, J., Rodríguez, F., & Echeverría, J. (2004). Determination of curing kinetic parameters of lignin-phenolformaldehyde resol resins by several dynamic diferential scanning calorimetry methods. Thermochimica Acta, 419(1-2), 161-167. http://dx.doi.org/10.1016/j.tca.2004.02.004.
» http://dx.doi.org/10.1016/j.tca.2004.02.004 -
4Tejado, A., Peña, C., Labidi, J., Echeverria, J. M., & Mondragon, I. (2007). Physico-chemical characterization of lignins from different sources for use in phenol-formaldehyde resin synthesis. Bioresource Technology, 98(8), 1655-1663. http://dx.doi.org/10.1016/j.biortech.2006.05.042. PMid:16843657.
» http://dx.doi.org/10.1016/j.biortech.2006.05.042 -
5Domínguez, J., Alonso, M., Oliet, M., Rojo, E., & Rodríguez, F. (2010). Chemorheological study of the curing kinetics of a phenolic resol resin gelled. European Polymer Journal, 46(6), 1237-1243.
-
6Wang, M., Leitch, M., & Charles, C. (2009). Synthesis of phenol-formaldehyde resol resins using organosolv pine lignins. European Polymer Journal, 45(12), 3380-3388. http://dx.doi.org/10.1016/j.eurpolymj.2009.10.003.
» http://dx.doi.org/10.1016/j.eurpolymj.2009.10.003 -
7Chen, Y., Chen, Z., Xiao, S., & Liu, H. (2008). A novel thermal degradation mechanism of phenol–formaldehyde type resins. Thermochimica Acta, 476(1-2), 39-43. http://dx.doi.org/10.1016/j.tca.2008.04.013.
» http://dx.doi.org/10.1016/j.tca.2008.04.013 -
8Pérez, J., & Fernández, A. (2011). Thermal stability and pyrolysis kinetics of lignin-phenol-formaldehyde resins. Journal of Applied Polymer Science, 123(5), 3036-3045. http://dx.doi.org/10.1002/app.34817.
» http://dx.doi.org/10.1002/app.34817 -
9Zhao, Y., Yan, N., & Feng, M. (2013). Thermal degradation characteristics of phenol–formaldehyde resins derived from beetle infested pine barks. Thermochimica Acta, 555, 46-52. http://dx.doi.org/10.1016/j.tca.2012.12.002.
» http://dx.doi.org/10.1016/j.tca.2012.12.002 -
10Silva, E. L., & Roldan, P. S. (2009). Simultaneous flow injection preconcentration of lead and cadmium using cloud point extraction and determination by atomic absorption spectrometry. Journal of Hazardous Materials, 161(1), 142-147. http://dx.doi.org/10.1016/j.jhazmat.2008.03.100. PMid:18456398.
» http://dx.doi.org/10.1016/j.jhazmat.2008.03.100 -
11Coles, C., & Yong, N. (2005). Use of equilibrium and initial metal concentrations in determining freundlich isotherms for soils and sediments. Engineering Geology, 85(1-2), 19-25. http://dx.doi.org/10.1016/j.enggeo.2005.09.023.
» http://dx.doi.org/10.1016/j.enggeo.2005.09.023 -
12Mohan, D., & Pittman, C. U., Jr (2006). Activated carbons and low cost adsorbents for remediation of tri- and hexavalent chromium from water. Journal of Hazardous Materials, 137(2), 762-811. http://dx.doi.org/10.1016/j.jhazmat.2006.06.060. PMid:16904258.
» http://dx.doi.org/10.1016/j.jhazmat.2006.06.060 -
13Chubar, N., Carvalho, J., & Correia, M. (2004). Heavy metals biosorption on cork biomass: effect of the pre-treatment. Colloids and Surfaces. A, Physicochemical and Engineering Aspects, 238(1-3), 51-58. http://dx.doi.org/10.1016/j.colsurfa.2004.01.039.
» http://dx.doi.org/10.1016/j.colsurfa.2004.01.039 -
14Kadirvelu, K., Thamaraiselvi, K., & Namasivayam, C. (2001). Removal of heavy metals from industrial wastewaters by adsorption onto activated carbon prepared from an agricultural solid waste. Bioresource Technology, 76(1), 63-65.. http://dx.doi.org/10.1016/S0960-8524(00)00072-9. PMid:11315812.
» http://dx.doi.org/10.1016/S0960-8524(00)00072-9 -
15Zhao, Y., Yan, N., & Feng, M.(2013). Biobased phenol formaldehyde resins derived from beetle-infested pine barks: structure and composition. ACS Sustenable Chemistry and Engineering, 1(1), 91-101.
-
16Pelissari, F., Andrade-Mahecha, M., Do Amaral Sobral, P., & Menegalli, F. (2013). Comparative study on the properties of flour and starch films of plantain bananas (. Musa paradisiaca)Food Hydrocolloids, 30(2), 681-690. http://dx.doi.org/10.1016/j.foodhyd.2012.08.007.
» http://dx.doi.org/10.1016/j.foodhyd.2012.08.007 -
17Huang, C. B., Jeng, R., Sain, M., Saville, B. A., & Hubbes, M. (2006). Production, characterization, and mechanical properties of starch modified by . Ophiostoma sppBioResources, 1(2), 257-269.
-
18Kizil, R., Irudayaraj, J., & Seetharaman, K. (2002). Characterization of irradiated starches by using FT-Raman and FTIR spectroscopy. Journal of Agricultural and Food Chemistry, 50(14), 3912-3918. http://dx.doi.org/10.1021/jf011652p. PMid:12083858.
» http://dx.doi.org/10.1021/jf011652p -
19Krishnan, R., & Maru, G. (2006). Isolation and analyses of polymeric polyphenol fractions from black tea. Food Chemistry, 94(3), 331-340. http://dx.doi.org/10.1016/j.foodchem.2004.11.039.
» http://dx.doi.org/10.1016/j.foodchem.2004.11.039 -
20Poljanšek, I., & Krajnc, M. (2005). Characterization of phenol-formaldehyde prepolymer resins by in line FT-IR spectroscopy. Acta Chimica Slovenica, 52(3), 238-244.
Publication Dates
-
Publication in this collection
Jul-Aug 2015
History
-
Received
04 Sept 2013 -
Reviewed
17 Oct 2014 -
Accepted
09 Feb 2015