
Abstract
This paper presents a research on rating scales in response to different situations. It aims to improve the significance and accuracy of ordinal scales, transforming them into interval scales. To reach this objective, the presented scales combine quantitative and qualitative perspectives, joining the ease of the Likert scale and the Thurstone’s procedure. In this research, a sample of subjects was asked to indicate the numerical value of adverbs, in reference to a numerical scale. The results were subjected to statistical analysis, to assess their validity. Combining the qualitative dimension with a quantitative evaluation, this procedure can meet the biopsychosocial specificities of subjects, as required by the complexity paradigm. The results of this study seem to be an affirmative response to the questions about validity and reliability, and about the practicality of this procedure.
Questionnaire; Behavioral assessment; Value of adverbs; Evaluation tool
Resumo
O artigo apresenta uma pesquisa sobre escalas de avaliação, com o objetivo de melhorar o significado e a precisão de escalas ordinais. O estudo visou identificar o significado numérico atribuído aos advérbios, que combinam a dimensão qualitativa (significado) e a quantitativa (quantidade). Solicitou-se a uma amostra de sujeitos que indicassem o valor numérico dos advérbios, em referência a uma escala numérica. Os resultados foram tratados estatisticamente, para avaliar sua validade e fiabilidade. Combinando a dimensão qualitativa e quantitativa na avaliação, vai-se ao encontro da especificidade biopsicossocial dos sujeitos, como pede o paradigma da complexidade. Acredita-se que os objetivos do estudo foram alcançados e que ele poderá ser útil a outros cientistas que estudam os comportamentos na área das políticas e práticas educativas e suas metodologias de avaliação.
Questionário; Comportamentos de avaliação; Valor numérico de advérbios; Instrumento de avaliação
Resumen
El trabajo presenta una investigación sobre escalas, con el objetivo de mejorar el significado y exactitud de las escalas ordinales. Está centrado en el valor numérico de los adverbios que combinan la dimensión cualitativa (significado) con la cuantitativa subyacente. Se solicitó a una muestra de sujetos indicar el valor de los adverbios, sometiendo los resultados a análisis estadístico, para mejorar su validez y fiabilidad. Integrando las dimensiones cualitativa y cuantitativa, se busca la especificidad biopsicosocial del sujeto, como lo pide el paradigma de la complejidad. Se alcanzaron los objetivos del estudio, y los resultados pueden ser útiles a otros científicos en el ámbito de las políticas y prácticas educativas y de sus metodologías de evaluación.
Cuestionario; Evaluación de la conducta; Valor numérico de adverbios; Herramienta de evaluación
1 Introduction
Studies on scales measuring attitudes and behavior have a relatively long history, since Thurstone in 1928 proposed a theory on the measurement of attitudes based on psychophysics models (THURSTONE; CHAVE, 1928THURSTONE, L.L.; CHAVE E. J. The measurement of Attitudes. Chicago: University of Chicago Press, 1928.). Thurstone’s approach to psychophysics is understandable, since in scientific thinking any observation must be translated into a quantitative result to be considered precise and measurable (BUNGE, 2000BUNGE, M. La Investigacin científica. Barcelona: Siglo XXI, 2000.). In fact, the classical scientific concept of measurement is to assign numerical values to objects and events, according to defined rules (KERLINGER; LEE, 2002KERLINGER, F. N.; LEE, H. B. Foundations of behavioral research. 4a ed. Forth Worth: Harcourt College, 2000.).
It is generally accepted, however, that psychological objects have specificities that must be taken into account, when you want to assign numerical values to its specific expression, the human behavior. Every psychic phenomenon – self, consciousness, expectation, attitude, motivation, etc. – comes from interaction with the biological context of the human individual; but this interaction varies along life: it is not the same in childhood, in adolescence, in adulthood or in old age. No doubt this diversity is a condition that enhances complexity; yet there are other dimensions that must be taken into account, that is, social, cultural, educational and economic conditions (SULBARAN, 2009SULBARAN, D. Medición de actitudes. Caracas: Escuela de Psicologia, Universidad Central de Venezuela, 2009.). Any attempt to explain – and predict – this behavior must combine all these, and perhaps, other dimensions. So it is not possible to confine the measurement of behavior to the simple classical paradigm: interestingly, the explanation of behavior must rely on the paradigm of complexity (MORIN; LE MOIGNE, 1999MORIN, E. ; LE MOIGNE, L. L’Intelligence de la complexité. Paris: L’Harmattan, 1999.) and must try to combine these different dimensions, namely: the qualitative and quantitative dimensions of behavior. The paradigm of complexity leads us to understand the subject as a living system whose structures, processes and behavior, occur at an established level of complexity. This level of complexity is determined by the system’s position on four factors:
-
Level of thought and information processed in the system: The higher the level of thought and information in the human system, the greater its complexity (LE MOIGNE, 2011LE MOIGNE, J. L. L’exercice de la pense complexe permet lintelligence des systèmes complexes: interview by Jacques Perrault, Stephanie Proutheau, Edouard Kleinpeter and Alfredo Pena Vega). Hermès, n. 60, p. 157-163, 2011-2012.).
-
Internal variety of the system: The more diverse the experiences and fields of reality constructed and cognitively interpreted by the human system, the greater its complexity (SIMON, 1987SIMON, H.A. CMU as an anti-entropic organization. Focus, v. 17, n. 2, p. 7-8, 1987.).
-
External Variety system: The greater the variety of the entities with which the system has continuous relationships, the more complex the human system in this criterion (VAZ, 2003).
-
Integration of the informational variety: The integration of different structures, processes, and patterns of behavior leads to enlargement of the conceptual boundaries and to richer meaning of the constructed reality. The living system develops the ability to deal with uncertainty in all domains of knowledge, and its reasoning becomes probabilistic, not simply deterministic (LE MOIGNE, 2011LE MOIGNE, J. L. L’exercice de la pense complexe permet lintelligence des systèmes complexes: interview by Jacques Perrault, Stephanie Proutheau, Edouard Kleinpeter and Alfredo Pena Vega). Hermès, n. 60, p. 157-163, 2011-2012.).
2 Theoretical Framework
Complex thinking recommends that the interpretation of human behavior takes account of all the data collected through the measuring instruments, and that each type of data is specifically analyzed and interpreted in the light of its level of complexity:
-
First, recording and interpretation of data that allow qualitative view of the subject (the informational dimension of behavior).
-
Second, data on the magnitude of behavior (the quantitative dimension): the frequency of significant behaviors; the frequency and intensity of emotions experienced by the subject, his energetic dimension (PARREIRA, 2006PARREIRA, A. Gestão do stress e da qualidade de vida. Lisboa: Monitor, 2006.).
The study aimed at answering both concerns above, seeking to combine the qualitative and quantitative dimensions and reporting such knowledge to the level of complexity in which the subject is positioned.
The researchers adopted the format scale proposed by Likert, as these are the most used scales today and the easiest to construct (BOZAL, 2006BOZAL, M.G. Escala Mixta Likert Thurstone. Andull: Revista Andaluza de Ciencias Sociales, n. 5, p. 81-96, 2006.). They are ordinal scales, in general, as Stevens points out (1946, quoted in BOZAL, 2006BOZAL, M.G. Escala Mixta Likert Thurstone. Andull: Revista Andaluza de Ciencias Sociales, n. 5, p. 81-96, 2006.). Stevens categorized scales according to statistical operations allowed by them, and this categorization has become classic. Those focused in this article are ordinal and interval scales.
-
Ordinal: Allowed transformations are strictly monotone, the scale only preserves the order between variable positions;
-
Interval: elements maintain the same known distance between them, but zero and origin points of the scale are arbitrary.
The instruments to capture data about behavior should adapt to the specificity of the psychological; only in this way we can create instruments with higher levels of validity and reliability. In the psychological field, the specificities scales must answer are mainly three:
-
The diversity of subjects is large, specifically the related to demographic variables;
-
A real zero does not exist; behavioral diversity is largely qualitative, although it also expresses quantitative values;
-
The spontaneous evaluation of items by the subject is based on a quasi-quantitative assessment, that is, it is based on the use of adverbs of quantity or frequency, which mix qualitative and quantitative thinking (in fact, the words are information – a qualitative dimension – but express intensities – a quantitative dimension).
To achieve this closer adjustment to the reality of the human subject, we start from the spontaneous evaluative behavior of the subjects, who currently use adverbs of quantity and frequency. This study is a continuation of another carried out in 2003 and published in 2006 (PARREIRA, 2006PARREIRA, A. Gestão do stress e da qualidade de vida. Lisboa: Monitor, 2006.), whose objective was the substitution of ordinal scales by interval scales, in order to reach an adequate mix of qualitative and quantitative factors, and to create scales of accrued validity and reliability. The obtained results are quite similar to those found, for the same adverbs, in the present study, as can be confirmed comparing the Tables 1 and 5 below.
These similar scores show that there is a high stability of the proposed evaluations: even very different composition and staggered in time (10 years) samples produce very close numerical scores. Thus, the use of these qualitative/quantitative scales seems both quite reliable and characterized by a solid empirical validity.
On this basis, the authors decided to conduct a similar research, aiming to gain a more extensive evidence for the following questions:
-
How can we transform qualitative spontaneously evaluation made by subjects into quantitative data – in order to obtain a range of known and stable intervals and not a simple ordinal scale?
-
Is it possible to assign a real zero to this type of scales?
-
Are these scales valid, fiable and usable?
3 The Methodology
In this study, the authors started by choosing a set of quantity and frequency adverbs currently used by people when they want to mean the quantitative dimension of a cognition or an emotion. This is the starting hypothesis: A scale based on a stable measurement of the numerical value of these adverbs will present consistent and known distances between the various positions; thus it will be effectively an interval scale.
Any interpretation or action based on it will thus be more precise than the mere ordering and will be more adjusted to what is expressed by the subjects, that is, its validity will be accurated. A list of adverbs of quantity/intensity- those most frequently used in Likert scales – was presented to a sample of people. People were asked to attribute a numerical value to each adverb or adverbial phrase on a scale of 0 (meaning 0% intensity) to 10 (meaning 100% intensity), in order to be used as a quantitative scale measuring attitudes, emotions and behavioral patterns.
This procedure is similar to Thurstone’s, who also asked respondents to evaluate the numerical value of a sentence (the difference being that in this case, it is a quantity or frequency adverb or adverbial expression). Its advantage is the possibility of being used with any sample of people who will answer a test or questionnaire, as the scale is independent of the content of the evaluated sentence. The same procedure was used with frequency adverbs; in this case, however, the numerical scale used frequency reasoning, evaluating the frequency adverbs within a continuum from 0% frequency to 100% frequency.
3.1 The Sample
The sample, originally composed by 219 subjects, included mainly University students, some of them workers. Sample treatment: Evidently incongruent subjects or participants with missing data were excluded from the original sample, using the listwise method. Subjects that were not able to correctly understand Portuguese language, that is, the meaning of some adverbs, and detected outliers were also excluded. The final sample was composed by 198 subjects, although the following tables are based on 219 observations (Tables 2, 3 and 4).
3.2 Procedure
Two adverb lists were presented to the subjects of the study: one about quantity adverbs or adverbial expressions, and another about frequency adverbs or corresponding adverbial expressions. Subjects were asked to evaluate the numerical significance of the adverbs in the list, in accordance with the following.


3.3 The results
3.3.1 Quantity adverbs
As one can see (Table 5), the adverbs that indicate extreme positive or negative intensities have a more precise evaluation, with less dispersion; those in the middle of the scale are less precise and are more disperse. The same occurred with the frequency adverbs. This is a result compatible with theories on psychological judgement:
The study is complemented by the graphs presented in Figures 1, 2 and 3, resulting from the use of the Principal Component Analysis methodology for ordinal data as described in Borg and Groenen (2005)BORG, I.; GROENEN, P.J.F. Modern multidimensional scaling: theory and applications. New York: Springer, 2005. (Springer Series in Statistics)., (procedure CATPCA in IBM SPSS-Statistics); it confirms the idea that it is possible to build an interval scale based on quantity adverbs, as could be expected.
Main component analysis and discrimination measures of different categories of quantity adverbs.
Main component analysis and discrimination measures of different categories of frequency adverbs.
3.3.2 Frequency adverbs
In the case of frequency adverbs, the procedure was similar to that of quantity adverbs. It was presented an example of a sentence using a frequency adverb to subjects and they were asked to evaluate it in a scale as the shown in the box.
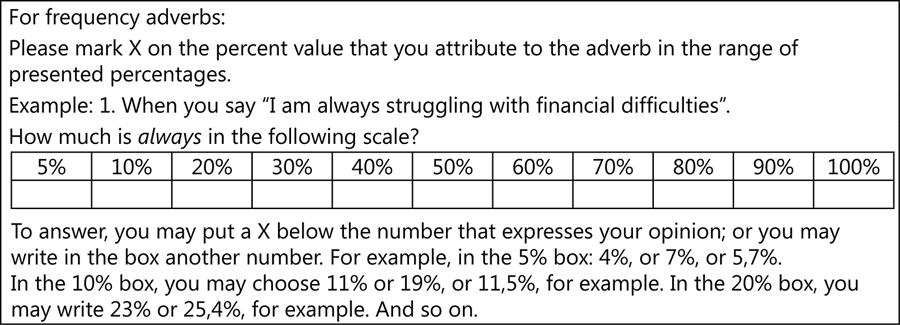
The Table 6 shows the results obtained with this procedure.
3.4 Practical Applications
The obtained results enable the construction of different equivalent scales, which can be adapted by the researcher to: respondents sample, issue and situation, according to the research objectives. This condition facilitates the transfer of Thurstone´s perspective to different situations and instruments, enhancing the researcher’s flexibility.
Two examples of these different scales (with 5 or 6 degrees based on the two categories of adverbs) can be found below (Tables 7 and 8).
3.4.1. Scale examples from quantity adverbs
3.4.2. The Frequency adverb scales
The based on frequency adverbs scales are presented below. A first example of this scale, showing the numerical values of the adverbs and the distance between positions can be observed in Table 9.
A second example: the frequency adverbs scale applied to a motivation test 1 1 This test was fully studied in a paper presented at SMTDA Congress, Lisbon, 2014. Here only applicable results are considered.
In its first part, the motivation test confronts value objects and situations, in sets of three. The purpose of this part is to confront the person with affectively guided choices – motivational dilemmas – which is the way motivation works, according to the motivational theory on which the test is based. In this part, the scale is composed by quantity adverbs.
The test
First part: the subjects mark the sentence they consider as the most important in the set; then, they choose the second one in importance and mark its position in the scale; finally, they mark the third one in relevance.

The questionnaire includes 21 sets, like the presented above, covering the most important areas of daily life: Personal life and family (11 sets); Work (5 sets); Leisure and free time (2 sets); Friends and friendships (3 sets).
Second part: the test measures the affective tone of the subject’s life, by registering - in the frequency adverbs scale – the frequency of emotions felt in his personal life and at work (results shown in Table 10).
Using the scale below, please mark the frequency of each feeling in your personal life and in work situations;
Scale for this part:
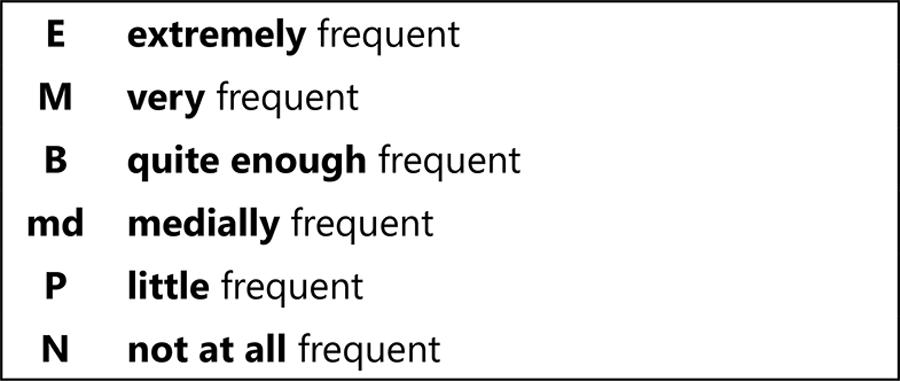
Table 11 shows that this procedure adequately evidences the contribution of interval scales to a more precise evaluation of behavioral factors and variables.
3.2.1 Internal consistency
The value of the realibity for the internal consistency (SIJTSMA, 2009SIJTSMA, K. Reliability beyond theory and practice. Psychometrica, v. 74, n. 1, p. 169-73, 2008. doi:10.1007/s11336-008-9103-y) is 0.861 for the 61 items, which means the motivation test presents internal consistency.
4 Conclusion
This study opens a path to the elaboration of interval scales suited to several types of psychological and sociological questionnaires, as they can be adapted to different speeches, ages, professional experiences, and cultural settings. No doubt it will be interesting for the researcher to have different options of scales, adjusted to the issue and to the sample under study. If those scales combined the words used by the subjects in their daily life, and if they could be quantified as true interval scales, we would obtain a fiable and valid instrument for behavioral research.
So this procedure allows us affirmatively answering the first question: the use of adverbs is an interesting basis for the construction of scales combining qualitative and quantitative approaches in a valid and reliable way. It allows avoiding the inaccuracies sometimes seen in Likert scales (LIKERT; ROSLOW; MURPHY, 1993LIKERT, R.; ROSLOW, S.; MURPHY, G. A simple and reliable method of scoring the Thurstone attitude scales. Personnel Psychology, v. 46, p. 689-90, 1993.) used by the authors, as shown in the two examples shown below:

In the first example, the position undecided does not contain an intensity position: it actually means a refusal of expressing a position; it is away of expressing frequency reasoning. The second example contains three positions out of the pretended scale: agree and disagree express the qualitative meaning of the position, but do not indicate its quantitative meaning; and the word neutral is even more explicitly away from the scale than undecided: they are expressions out of a scaling reasoning.
According to that, it is believed that the use of adverbs and of the frequency scale construction increases the accuracy eliminating ambiguities.
The results of this study constitute also an affirmative answer to the specific question about validity and reliability, as it was shown along the paper and especially in the presented examples.
In behavioral studies, it is quite inappropriate to speak about a zero position; but we hope that this study helps to define a minimum position (equivalent to zero in each population to whom the scale is applied). Actually this is what is used in every behavioral reasoning: there is a zero pint to each population in each variable. In face of these results, the objectives of this study have been reached and this could be useful to other behavioral scientists.
References
- BORG, I.; GROENEN, P.J.F. Modern multidimensional scaling: theory and applications. New York: Springer, 2005. (Springer Series in Statistics).
- BOZAL, M.G. Escala Mixta Likert Thurstone. Andull: Revista Andaluza de Ciencias Sociales, n. 5, p. 81-96, 2006.
- BUNGE, M. La Investigacin científica Barcelona: Siglo XXI, 2000.
- CARDELLI, D.T.; ELLIOT, L. Avaliação por diferentes olhares: fatores que explicam o sucesso da escola carioca em área de risco. Ensaio: Avaliação e Políticas Públicas em Educação, v. 20, n. 77, p.769-98, out.-dez. 2012. doi:10.1590/S0104-40362012000400008
- KERLINGER, F. N.; LEE, H. B. Foundations of behavioral research. 4a ed. Forth Worth: Harcourt College, 2000.
- LE MOIGNE, J. L. L’exercice de la pense complexe permet lintelligence des systèmes complexes: interview by Jacques Perrault, Stephanie Proutheau, Edouard Kleinpeter and Alfredo Pena Vega). Hermès, n. 60, p. 157-163, 2011-2012.
- LIKERT, R.; ROSLOW, S.; MURPHY, G. A simple and reliable method of scoring the Thurstone attitude scales. Personnel Psychology, v. 46, p. 689-90, 1993.
- MORIN, E. ; LE MOIGNE, L. L’Intelligence de la complexité Paris: L’Harmattan, 1999.
- PARREIRA, A. Gestão do stress e da qualidade de vida Lisboa: Monitor, 2006.
- SIJTSMA, K. Reliability beyond theory and practice. Psychometrica, v. 74, n. 1, p. 169-73, 2008. doi:10.1007/s11336-008-9103-y
- SIMON, H.A. CMU as an anti-entropic organization. Focus, v. 17, n. 2, p. 7-8, 1987.
- SULBARAN, D. Medición de actitudes. Caracas: Escuela de Psicologia, Universidad Central de Venezuela, 2009.
- THURSTONE, L.L.; CHAVE E. J. The measurement of Attitudes Chicago: University of Chicago Press, 1928.
- VIANNA, J.A.; SOUSA, S.M.; REIS, K.P. Bullying nas aulas de Educação Física: a percepção dos alunos no ensino médio. Ensaio: Avaliação e Políticas Públicas em Educação, v. 23, n. 86, p. 73-93, jan./fev. 2015. doi:10.1590/S0104-40362015000100003
-
1
This test was fully studied in a paper presented at SMTDA Congress, Lisbon, 2014. Here only applicable results are considered.
Publication Dates
-
Publication in this collection
Jan-Feb 2016
History
-
Received
9 Sept 2015 -
Accepted
26 Nov 2015

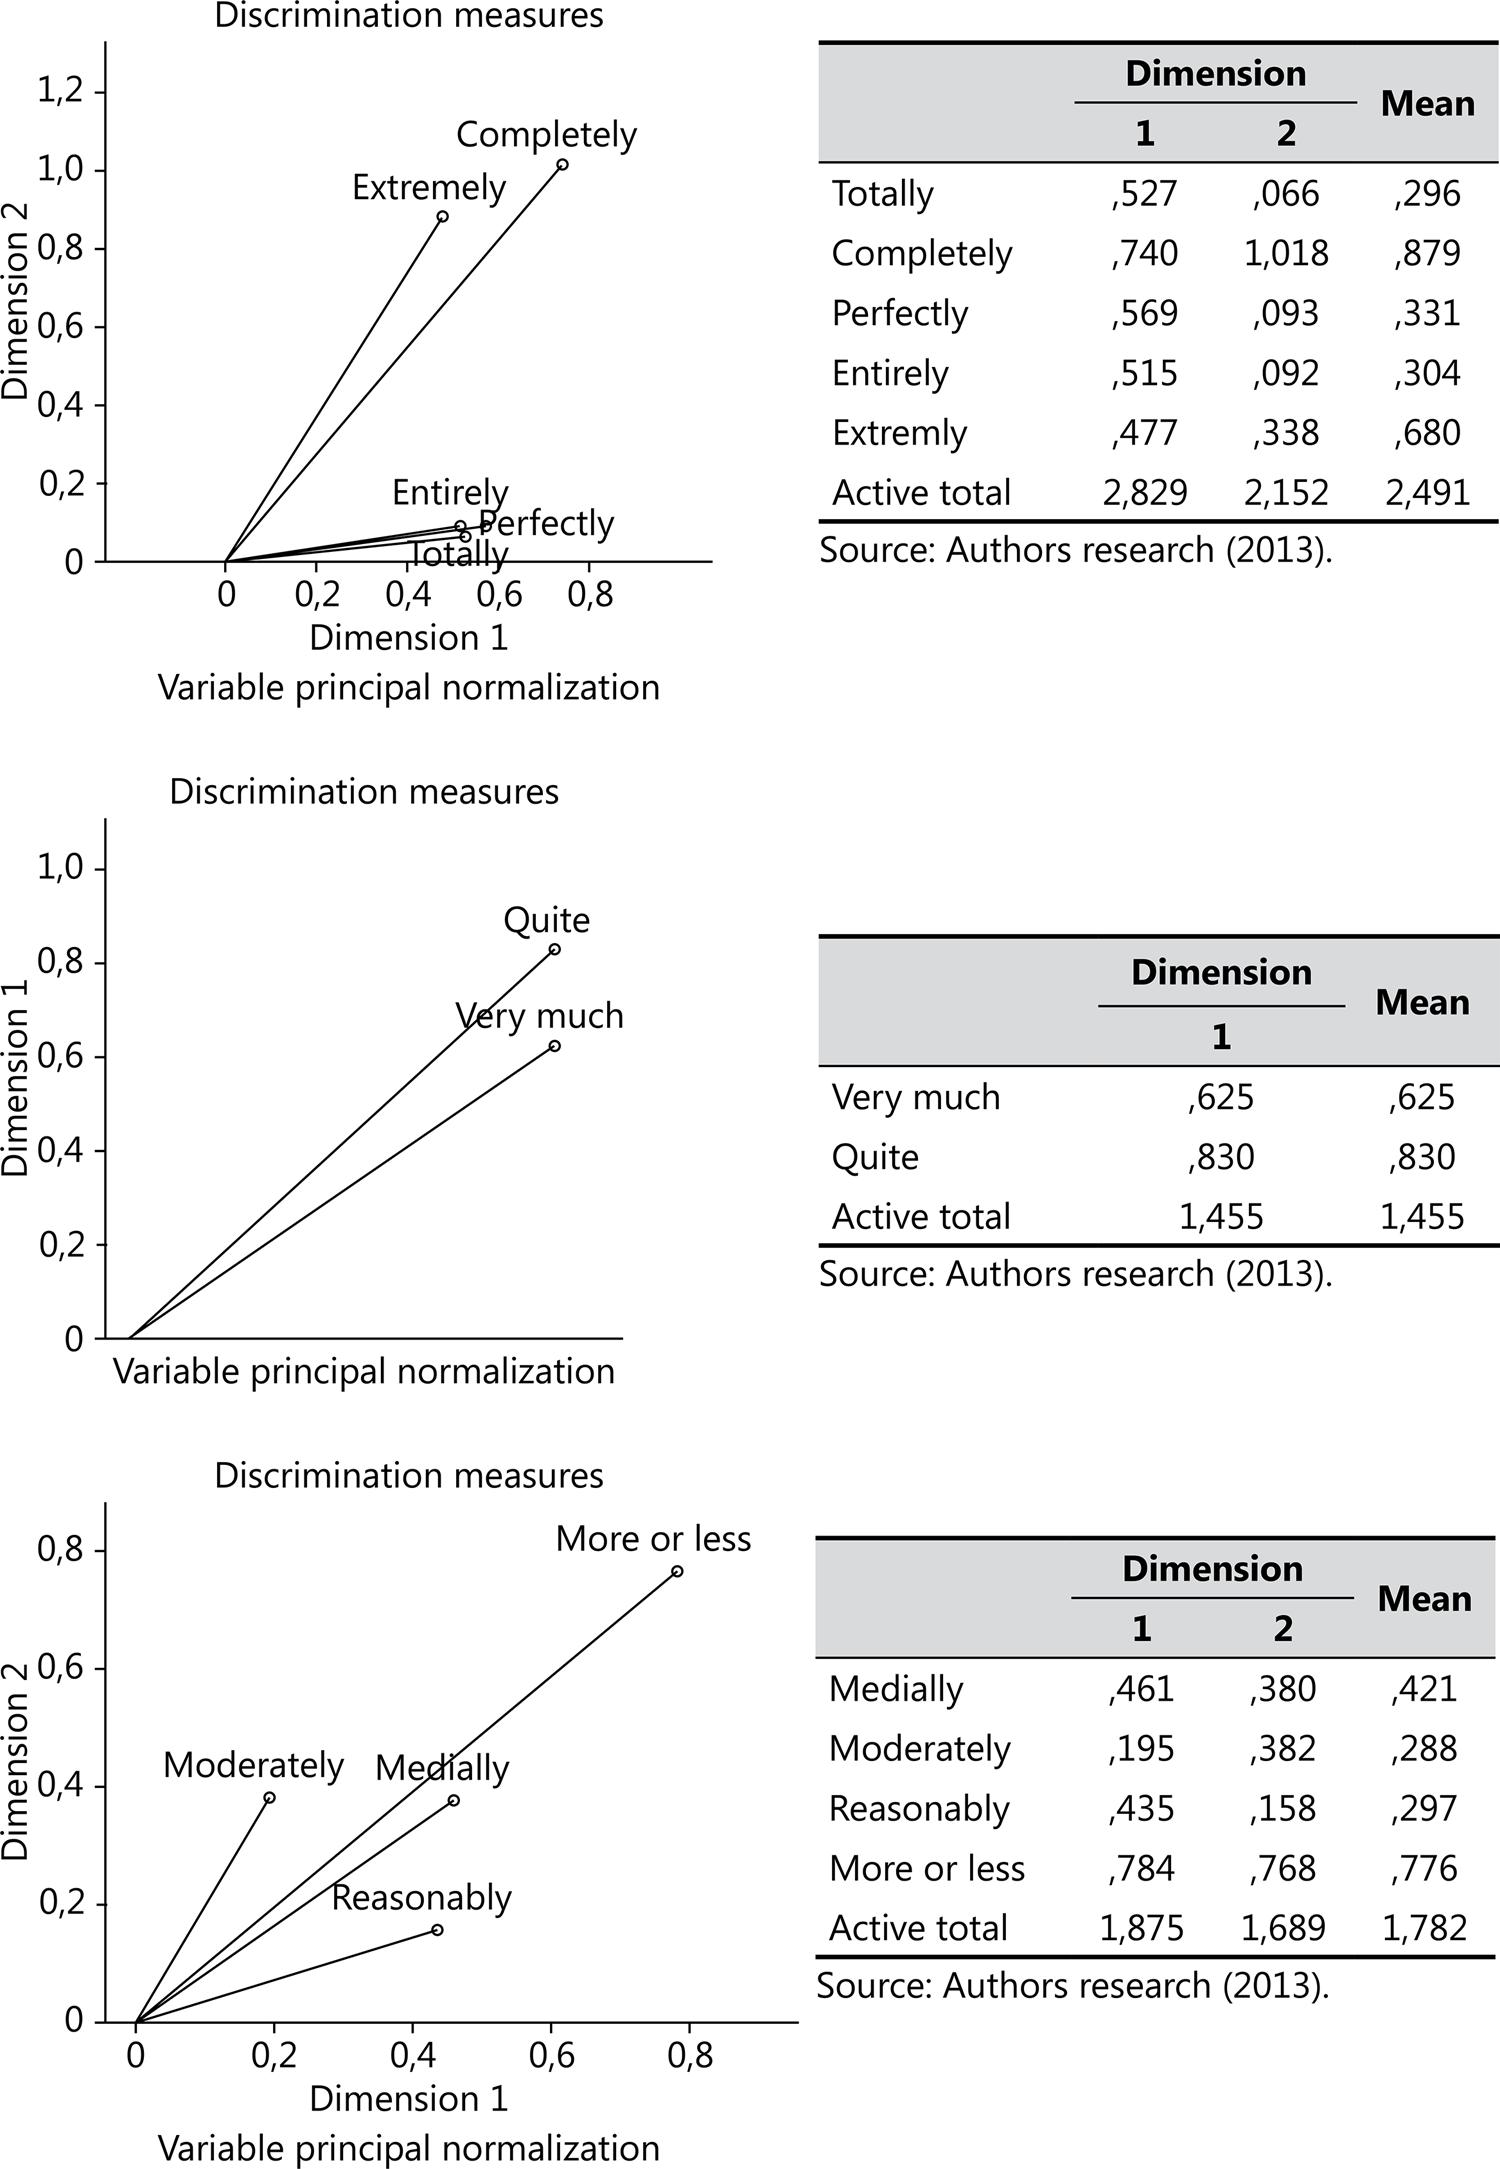
 Source: Authors research (2013).
