
Abstract
The paper discusses the need for studies with longitudinal design and a baseline for construction of value added models to assess the impact of policies and school practices in pre-school and in the first years of primary school. The objective was to identify family factors or previous experience in a crèche that are correlated with the starting point in pre-school. The multivariate regression models suggest that a) age is a key factor to explain children’s cognitive development when they start compulsory education; b) educational level of parents/guardians is the most significant factor for family characteristics; c) the home learning environment indicator suggests a positive association with the cognitive test, even after control of socio-economic level and age variables.
Early childhood education; Longitudinal studies; Educational opportunities; Educational inequality/disadvantage
Resumo
O artigo discute a necessidade de estudos com desenho longitudinal e de uma linha de base para a construção de modelos de valor agregado para avaliar o impacto de políticas e práticas escolares na pré-escola e nos primeiros anos do ensino fundamental. O objetivo da análise foi identificar fatores da origem familiar e de experiência prévia na creche correlacionados ao ponto de partida das crianças na pré-escola. Os modelos de regressão multivariadas indicam que: a) idade é um importante preditor para o desenvolvimento cognitivo das crianças no ingresso do período obrigatório de escolarização; b) educação dos pais é o principal preditor considerando as características da família; c) o indicador de ambiente educativo do lar sugere uma associação positiva com o teste cognitivo, mesmo após controle das variáveis socioeconômicas e idade.
Educação infantil; Estudos longitudinais; Oportunidades educacionais; Desigualdades/desvantagens educacionais
Resumen
El artículo discute la necesidad de estudios con diseño longitudinal y una línea de base para la construcción de modelos de valor agregado para evaluar el impacto de las políticas y prácticas escolares en preescolar y en los primeros años de la escuela primaria. El objetivo fue identificar los factores familiares o la experiencia previa en una guardería que se correlacionan con el punto de partida en el preescolar. Los modelos de regresión multivariada indican que: (a) la edad es un predictor importante del desarrollo cognitivo de los niños en la escuela obligatoria; b) La educación de los padres es el principal predictor considerando las características de la familia; c) el indicador del entorno educativo en el hogar sugiere una asociación positiva con las pruebas cognitivas, incluso después de controlar las variables socioeconómicas y la edad.
Educación infantil temprana; Estudios longitudinales; Oportunidades educativas; Desigualdad/desventaja educativa
1 Introduction
The first years of a child’s life are crucial for his/her development. Research in the neuroscience field provides evidence that, during pregnancy, the child’s cerebral architecture is already being constructed and will form the basis for the acquisition of motor, cognitive and social skills. Among the innumerable factors that contribute to adequate child development it is possible to cite aspects like nutrition, care regarding hygiene, carer affection, diversity of motor stimuli and in the language field (PAUS, 2013PAUS, T. Cérebro. enciclopédia sobre o desenvolvimento na primeira infância. 2013. Available in: http://www.enciclopedia-crianca.com/sites/default/files/dossiers-complets/pt-pt/cerebro.pdf. Accessed: 2018 Nov. 11.
http://www.enciclopedia-crianca.com/site...
)1
1
See <http://www.enciclopedia-crianca.com/sites/default/files/dossiers-complets/pt-pt/cerebro.pdf>
. The family is the baby’s first socializing environment, and this is slowly expanded to other spaces, such as crèches and pre-school.
Besides this, various studies conducted in the international context indicate that attending pre-school is an effective measure to guarantee greater equality in educational opportunities, that is, it contributes to learning (present and future) and to a broader school trajectory, especially in the case of children from low socio-economic backgrounds. (PEISNER-FEINBERG et al., 2001PEISNER-FEINBERG, E. et al. The relation of preschool child-care quality to children’s cognitive and social developmental trajectories through second grade. Child Development, v. 72, n. 5, p. 1534-53, Sep./Oct. 2001.; SAMMONS, 2006SAMMONS, P. et al. Influences on children’s attainment and progress in key stage 2: cognitive outcomes in year 6: effective pre-school and primary education 3-11 project (EPPE 3-11). Nottingham: Department for Children, Schools and Families, 2006. (Research Report, No DCSF-RR048).; SYLVA et al., 2010SYLVA, K., et al. Early childhood matters: evidence from the effective pre-school and primary education project. London: Routledge, 2010.). However, in many countries, there is a gap in enrolment and/or in the quality of the pre-school program attended between children of advantaged and disadvantaged background (UNICEF, 2018UNICEF. An unfair start: inequality in children’s education in rich countries. Florença; 2018.). Moreover, early differences in cognitive development, before entering school, have been observed according to children socio-economic background, race/ethnicity, family structure, home environment, among others (BURKAM; LEE, 2002BURKAM, D. T.; LEE, V.E. Inequality at the starting gate. Washington, DC: EPI Books, 2002.; BIERDINGER, 2010BIERDINGER, N. Early ethnic inequality: the influence of social background and parents involvement of preschool children’s cognitive ability in Germany. Child Indicators Research, v. 3, n.1, p. 11-28, jan. 2010. https://doi.org/10.1007/s12187-009-9054-6
https://doi.org/10.1007/s12187-009-9054-...
)2
2
Burkam and Lee (2002) point that longitudinal studies have focused more on inequalities of achievement during preschool or latter and less on inequalities at “the starting gate”.
. Burkham and Lee (2002) argue that if disadvantage or at-risk children are systematically placed in lower-quality preschool programs, this might increase the already existing inequalities on children’s cognitive abilities and, thus, prevent attendance to preschool to enhance equality in educational opportunities.
In Brazil, there are still few studies about the impact of child education on children learning and school trajectory. For example, a study by Damiani et al. (2011)DAMIANI, M. F. et al. Educação infantil e longevidade escolar: dados de um estudo longitudinal. Estudos de Avaliação Educacional, São Paulo, v. 22, n. 50, p. 515-32, 2011. https://doi.org/10.18222/eae225020111968
https://doi.org/10.18222/eae225020111968...
, observed that students who attend pre-school tend to have longer school trajectories, and Campos et al. (2011a) observed that children who had attended high quality institutions presented better performance in the 2nd year of primary education than children who had not attended pre-school or had studied in institutions with unsatisfactory levels of quality. Nevertheless, the scarce studies undertaken in the Brazilian context are not longitudinal, and, therefore, present diverse limits on identification of causality between the quality of pre-school and learning, or pupils’ future trajectory. For example, we do not have studies with a baseline that informs what children know at the outset of compulsory schooling and that indicates the factors associated to differences at this initial moment of schooling and/or development and learning during the first school years.
In this context, this article has the aim of presenting the design of a longitudinal study that begins at pre-school and presents a representative probabilistic sample of the Rio de Janeiro municipal public system. It discusses the importance of research featuring robust design with adoption of systematic information, collected with rigor and precision, to act as a basis for education policy decision-making (DAGENAIS et al., 2012; MILLER; PASLEY, 2012MILLER, B.; PASLEY, J. What do we know and how well do we kow it? Identifying practice-based insights in education. Evidence & Policy, v. 8, n. 2, p. 193-212, May 2012. https://doi.org/10.1332/174426412X640081
https://doi.org/10.1332/174426412X640081...
), and argues that the design of the study presents potential for investigation of which pre-school characteristics (school inputs, organization of supply and pedagogic processes) can influence the school trajectory, and, in particular, literacy and numeracy in the Brazilian context3
3
The research is funded by the Inter-American Development Bank (IDB), Fundação de Amparo à Pesquisa do Estado do Rio de Janeiro (FAPERJ) and Instituto Alfa e Beto (IAB). The authors thank the Rio de Janeiro Education Department for all the collaboration during data collection.
. The article also presents the results of analyses of data collected during the first wave of a longitudinal study, carried out at the entry to the first year of pre-school in the Rio de Janeiro municipal system, focusing on analysis to identify factors associated to child development at the start of pre-school, which has become the initial step of the compulsory schooling in Brazil4
4
See Constitutional Amendment n 59 issued in November 2009.
.
2 The longitudinal study and the baseline measurement
The longitudinal study performed in Rio de Janeiro city’s municipal public system is scheduled to have a duration of three years, 2017–2019. The children’s cognitive development is measured with the instrument developed by the Centre for Evaluation and Monitoring of Durham University, England, called Performance Indicator for Primary Schools (PIPS), currently used in 9 countries (THE UNIVERSITY OF WESTERN AUSTRALIA, 1999THE UNIVERSITY OF WESTERN AUSTRALIA. Centre for Evaluation & Monitoring – CEM. Performance indicators in primary schools: baseline assessment, 2010: changes and directions. Durham: CEM Centre, 1999.). Furthermore, the study presents another two measurements regarding child development: a) final motor skills – with a “drawing along a trail” test; and b) anaerobic physical fitness – Sitting and Raising test (ARAÚJO, 1999ARAÚJO, C. G. S. Teste de sentar-levantar: apresentação de um procedimento para avaliação em Medicina do Exercício e do Esporte. Revista Brasileira de Medicina do Esporte, Niterói, v. 5, n. 5, p. 179-82, 1999. https://doi.org/10.1590/S1517-86921999000500004
https://doi.org/10.1590/S1517-8692199900...
). The main objective is to identify pre-school characteristics (school inputs, organization of provision, teachers’ training, school practices), as well as pedagogic processes and patterns of classroom interactions associated to children’s cognitive development.
There are four main innovations in the study. The first is the understanding that it is not only important but necessary to obtain direct measurements about child development. International studies have already demonstrated that ensuring access or measuring the quality of the environment are insufficient metrics to guarantee effective learning for children and youths in general (PEISNER-FEINBERG et al., 2000; SYLVA et al., 2010SYLVA, K., et al. Early childhood matters: evidence from the effective pre-school and primary education project. London: Routledge, 2010.). Therefore, measuring child development is a necessary step in assessing the effectiveness of early childhood education policy.
The second innovation is the use of an adaptive cognitive test as a robust measurement at the individual level. Our preliminary analyses of the cognitive test results in Waves 1 and 2 of the project suggested a correlation of about 0.75 – higher than that observed in similar studies in Brazil, and very close to that found in international studies (SIRIN, 2005SIRIN, S. R. Socioeconomic status and academic achievement: a meta-analytic review of research. Review of Educational Research Fall, v. 75, n. 3, p. 417-53, 2005. https://doi.org/10.3102/00346543075003417
https://doi.org/10.3102/0034654307500341...
; TYMMS; MERRELL, JONES, 2004). The adaptive test allows generation of reliable measurements at the individual level without exposing the child to many items and reduced time for application.
The third refers to longitudinal data collection that offers consecutive measurements of the same children. This type of design is far superior to analyses with cross-section data and greatly improves the quality of the causal inference about the effects of the educational policies and teaching practices on child development. The majority of the studies that attempt to observe the impact of quality service in early childhood education or of the characteristics of schools on child development and/or other school results are correlational studies, and, therefore, always present limits or threats that a selection bias and/or variables omitted from the estimated models could explain the relations observed (GOLDSTEIN, 1997GOLDSTEIN, H. Methods in school effectiveness research. School Effectiveness and School Improvement, v. 8, n. 4, p. 369-95, 1997. https://doi.org/10.1080/0924345970080401
https://doi.org/10.1080/0924345970080401...
; NICHD EARLY CHILD CARE RESEARCH NETWORK; DUNCAN, 2003).
The fourth innovation is the possibility of comparing the child development in the Rio do Janeiro public system with those beginning the formal schooling process in other countries participating in the Placing Early Childhood Education at the Heart of Worldwide Policy Making (iPIPS). The data collected will allow comparison of the development level of Rio de Janeiro pupils with others of the same age in different educational systems at the formal starting point, and, more important, how they develop in the first school years.
Thus, the project arouse from the need to construct more robust research designs that allow better quality causal inference to understand the specific effects of existing education policies in Brazil’s public systems.
3 Cognitive instrument of the PIPS
The instrument is composed of a set of dimensions of cognitive assessment measurements, such as: a) Handwriting – the child is requested to write his own name; b) Vocabulary – identifying objects in a series of images; c) Ideas about reading – to assess concepts about print; c) Phonological awareness – rhymes and word repetition; d) Identification of letters; e) Recognition of words and reading – sentences and comprehension; f) Ideas about mathematics – understanding of mathematical concepts; g) Counting and numbers; h) Addition and subtraction problems without symbols; i) Shapes identification; j) Digit Identification; and k) Mathematical problems including sums with symbols.
The application of the test is individual and it may be conducted by the group’s own teacher or another adult, and the duration varies from 10 to 20 minutes. In the longitudinal study, a researcher asks the questions and makes a record of the answers on a tablet. The program is adjusted such that wrong and right answers are considered in order to continue the test or not. Each test session presents items of increasing difficulty, which enables testing with a desirable minimum duration, without making the child bored with questions that are too simple or getting upset when faced with very difficult ones (TYMMS; MERREL; JONES, 2004).
Currently, the iPIPS is being applied to children in the age range 4–7, with adapted instruments, in 9 countries, there having been various scientific works generated that attest to its technical quality and predictive power. The English version of PIPS presented a high test-retest reliability, a correlation of 0.98 (THE UNIVERSITY OF WESTERN AUSTRALIA, 1999THE UNIVERSITY OF WESTERN AUSTRALIA. Centre for Evaluation & Monitoring – CEM. Performance indicators in primary schools: baseline assessment, 2010: changes and directions. Durham: CEM Centre, 1999.) and good predictive power for reading and mathematics. Using a baseline measurement with children aged 4 to 5, the test presents a correlation of 0.71 for reading 3 years after the first measurement and a correlation of 0.7 after 7 years (TYMMS, 1999TYMMS, P. Baseline assessment and monitoring in primary schools: achievements, attitudes and value-added indicators. London: David Fulton, 1999.; TYMMS; MERREL; HENDERSON, 1997; TYMMS; MERREKK; JONES, 2004; TYMMS; MERREL; JONES, 2004). These are high values compared with those of other tests available, which reinforces its relevance for use in school effectiveness studies with a longitudinal or experimental design.
In Brazil, 4 important steps of the longitudinal study have already been taken: (i) adaptation of the test (items) to Portuguese; (ii) cultural adaptation of the figures presented in the test (booklet); (iii) production of the software that helps researchers with application of the test and (iv) pre-testing of the items and (v) data collection for three waves of the longitudinal study. The pre-test was conducted in 2016 in three cities, with 560 children. The analyses of the pre-test indicated that the cognitive test items presented appropriate behavior, suggesting theoretical adequacy of the items and it revealed the adequacy of the scale for children aged 4–7 in the Brazilian context5 5 For further information about the adaptation of the instrument, the pre-test and its results, see Bartholo et al. (2019, forthcoming). BARTHOLO, T. L. et al. Monitoring early childhood education in the Brazilian Context: constraints and possibilities. Pró-posições (forthcoming), 2019. .
4 Study design and sample
The project, started in March 2017, presents a probabilistic single-stage cluster sample (school as the primary sampling unit) stratified by characteristics of pre-school provision6 6 The two types of pre-school provision in the city of Rio de Janeiro educational system include: a) Child Development Centers (EDI), a program which confers unusual characteristics on the provision; and b) regular or “traditional” pre-schools. and local authority of the municipal system of the city of Rio de Janeiro. It ran a lottery to the random selection of 46 schools from the Rio de Janeiro Municipal System7 7 Margin of error of 11.6% at 90.0% confidence interval. . All the children enrolled in the first-year of pre-school of the selected/sampled schools were eligible to participate in the research.
In order to monitor the students in the longitudinal study, we adopted the following strategy: a) all the students enrolled in the schools randomly selected for the sample would be measured in all the waves, irrespective of whether they had moved to another school of the Rio de Janeiro public system. Children who had migrated to private schools or to other cities ceased to be part of the research; b) students that had joined the randomly selected schools in the sample after starting the study were also tested.
Figure 1 presents the different stages in the data collection. It is to be stressed that the article analyzes only the data collected in Wave 1 – entry to pre-school.
Some challenges were identified right at the beginning of the longitudinal study, among which was the difficulty in accessing some districts due to violence, thus causing an impact on the research fieldwork. The risk to the physical integrity of the researchers involved in the study was the sole criterion adopted to substitute the randomly selected schools. Contact was made with all 11 Regional Education Coordinating Authorities (CREs), and the school boards to map the specific cases of violence in different city regions. Seven schools were replaced by others (random sampling with replacement). However, in one CRE, extreme difficulty was faced in selecting schools in risk-free areas, and, therefore, a decision was taken to intentionally select a school. Future analyses will consider this aspect of the sample, including and excluding a school selected for convenience to identify possible alterations in the results.
Chart 1 presents the descriptive statistic of the data collected in 2017, the first year of research.
5 What do children know upon entry to preschool?
Figure 2 shows the item-person map for the mathematics test collected in the first wave. The map allows analysis of four principal points: a) distribution of the children on the test scale; b) distribution of the items on the scale; c) level of difficulty of the items; d) probability of each child correctly identifying the different items. It is possible to observe that the distribution of tested children is very close to a normal distribution, that is, few children at the lower and upper ends of the scale, and a greater concentration in the intermediate part. The results suggest that the test is capable of adequately measuring the mathematical knowledge at the moment of school entry in the Rio de Janeiro municipal public system.
Another relevant aspect is to analyze the distribution of items on the scale. Items in the lower part were estimated to be the easiest, whereas those positioned in the upper part were the most difficult. It is important to stress that, as the test applied is adaptive, most of the students had the application interrupted at some moment of the test when they demonstrated they did not know certain content. For instance, children incapable of identifying single-digit numbers were not exposed to the more difficult numbers session – with two or three digits.
The scale for mathematics covered a broad array of skills. The order of the items is relevant for testing the hypothesis that there is a progression in the level of difficulty of the items. We can observe that the easier items are those in the initial test sections – Ideas about mathematics – and afterwards there appeared items about counting objects, identification of shapes and single-digit numbers. Thus, children at the beginning of the scale dominate concepts like size (bigger/smaller), quantity and volume (more/less). They are capable, for example, of pointing to the biggest cat in a drawing with cats of three different sizes; pointing to which of two people holding balloons in a drawing has more. Children in the sample close to the average typically, besides the concepts described above, are also capable of identifying single-digit numbers (1–5) and counting a small quantity of objects with the support of images. Other students start pre-school already being capable of identifying double-digit numbers and have notions of simple formal arithmetic (for instance, doing simple sums) and a very small group with more advanced knowledge are capable of identifying triple-digit numbers and performing formal mathematical operations with coins. The broad scale of the test is necessary to adequately measure, in the same metric, students at various stages of development from the first year of pre-school to the end of the first year of primary education.
Another way of presenting the results of the item-person map is to make a pedagogic interpretation of the scale. Figure 3 presents the percentages of students at each development stage for mathematics at the entry to pre-school in March 2017.
At admission to pre-school, most pupils (79.6%) were at the initial levels on the scale, still developing skills related to ideas about mathematics, counting objects and identifying single-digit numbers (especially 1 – 5). Only 18.8% of the pupils were already capable of identifying numbers 6 – 10, and making simple informal sums, and a very small portion (1.6%) identified double-digit numbers and were capable of making more complex informal sums or simple formal sums.
The data presented are useful for teachers, principals, parents and researchers in the education field and administrators. Identifying what students are capable of achieving at entry to pre-school can help with school planning and debates about the pre-school curriculum. As it constitutes a probabilistic sample for the Rio de Janeiro municipal public network,
It is important to emphasize that the ladder does not indicate what students should be capable of doing at the end of a certain stage. The figures only present the starting point and the pace of development of children in different dimensions. The pedagogic interpretation of the cognitive test results is a fundamental task for maximizing the dialogue and comprehension of the results with school actors.
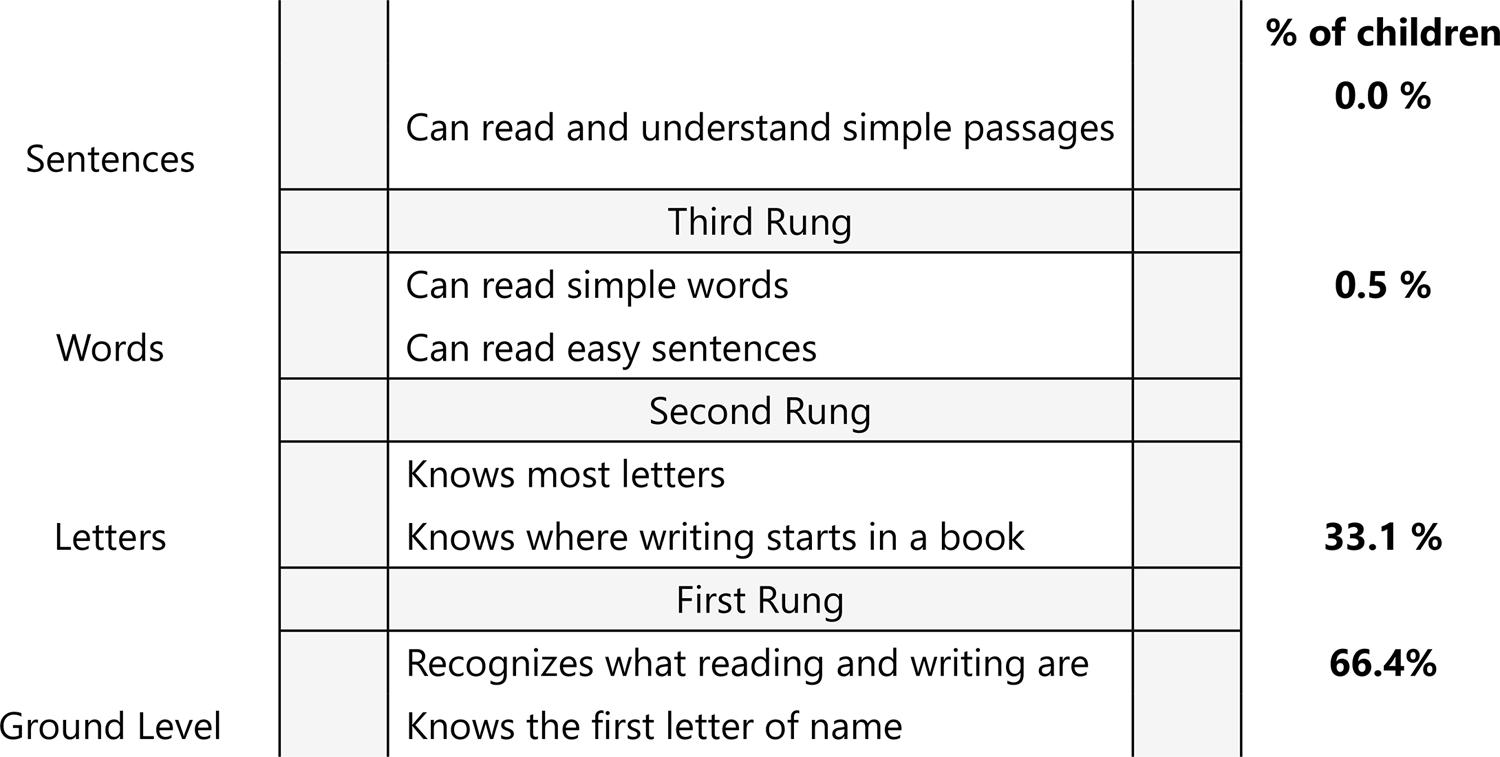
The item-person map was also constructed for the language part of the test and the pedagogic ladder was made considering the items of ideas about reading, identification of letters and reading of words and sentences. Figure 4 presents the pedagogic interpretation of the language measurement, considering the aforementioned sections.
Approximately two thirds of the children enter pre-school knowing only the first letter of their own names and with basic ideas about what reading and writing are (for example, the item asks the child to point to “someone who is reading” and “someone who is writing”). The other third already know the majority of the letters and are capable of identifying on a page that presents a drawing and a text “where the sentence begins”. Very few students (0.5%) enter pre-school reading words and simple sentences.
6 How do the skills vary according to the characteristics of children and their families?
As observed in the previous section, the children already present a great variation regarding the development of language and mathematical skills right at the beginning of pre-school. The next analysis will describe how this variation is associated with the children’s characteristics and the family environment, as well as the attendance of a crèche. For such, we use two sources: i) data from questionnaires for children’s parents/guardians (parents’ schooling, access to cash transfer programs, home learning environment and possession of goods; ii) data from the Sistema de Gestão Acadêmica – SGA (Academic Administration System) of the Rio de Janeiro Municipal Education Secretariat: gender, age, parents’ schooling, skin color, access to income transfer programs, and frequency to crèche.
Neither of the two databases contain complete information for all the children assessed and as it has only been possible, until the moment, to apply the questionnaire to 62.0% of the parents/guardians, we have used data available from the SGA to complete part of the missing data referring to parents’ schooling, access to cash transfer programs, and if the child has attended a crèche. Chart 2 presents the description of the variables utilized and their sources.
Table 1 presents the mean and standard deviation of the mathematics and language measurements at pre-school entry (Wave 1), according to gender, age, skin color, parent’s (s’)/guardian’s(s’) educational level, and attending a crèche.
Regarding the child’s family characteristics, this table indicates a marked difference between the development level in language and mathematics, in accordance with the parents’ schooling, with a disadvantage for children whose parents had a maximum of complete or incomplete elementary education. The disadvantage regarding poverty and skin color seem to be less visible. Another marked difference is related to age, that is, younger children present starting points lower than those who are older8 8 The indicator provides a procedural dimension with regard to the development of parents’/guardians’ activities with children, such as: reading, drawing, singing, playing/developing activities with numbers, colors and the alphabet. Studies have already observed the association between this procedural dimension, “Home Learning Environment” and the development of children during pre-school and at the start of primary education (SYLVA et al., 2010; SAMMONS et al., 2006). The indicator also covers items referring to a physical environment conducive to child development (number of rooms in the home, a bedroom for the child), possession of books and children’s games. The methodology employed took as its base the Socio-Economic Index devised by Alves, Soares and Xavier (2014). . This tendency shows the strong effect of maturity in this age range. Finally, girls present an advantage over boys with respect to the starting point in language, and children who have attended a crèche presented a slight disadvantage at their starting point in mathematics and language in comparison to those who have not9 9 The indicator utilized items referring to the possession of goods (car, washing machine, computer, tablet, printer) and access to the following services: Internet and cable TV. Once again, the methodology employed took as its base the Socio-Economic Index devised by Alves, Soares e Xavier (2014). .
Table 2 presents the results obtained from linear regressions estimating the language and mathematics measurements at entry to pre-school, based on child and family characteristics, and whether the child attended a crèche or not. In Model 1 we inserted the contextual variables of the students who had little missing data (gender, age, parents’ education, poverty and crèche). In Model 2 we inserted the home learning environment and goods possession variables. The parameters estimated with the different models are reported as effect sizes, which were calculated in accordance with the methodology developed by Tymms (2004)TYMMS, P. Effect sizes in multilevel models. In: SCHAGEN, I.; ELLIOT, K. But what does it mean? The use of effect sizes in educational research. Slough, UK: National Foundation for Educational Research, 2004. p. 55-66..
In Model 1, which estimated the mathematics measurement in Wave 1, we observed a strong association among the children’s development, age and parents’ education. We also detected a small disadvantage for non-white children and those in a situation of poverty. Controlling for other variables in the models, attending a crèche did not seem to be associated with the children’s starting point.
The lack or small negative impact of attending crèche has been observed in other studies (Campos et al., 2011ba; Loeb et al., 2004LOEB, S., et al. Child care in poor communities: early learning effects of type, quality, and stability. Child Development, v. 75, n. 1, p. 47-65, Jan./Feb. 2004.), which suggests that it shall be associated to the quality of provision10 10 It is noteworthy that the last category, 57 months or more, leads to data as much on pupils of the right age to attend pre-I as pupils who attended mixed groups (pre-I and pre-II), and, in the academic year 2017. . In our sample, it is relevant to mention that low-income families have priority access to enrollment in public municipal crèches and, therefore, there is a selection bias that might explain the association observed.
In Model 2, we noticed that the home learning environment is a variable with a modest effect on both mathematics and language starting point, even when controlling for parents’ educational level. The variable, possession of goods presented a small but significant association with the wave 1 starting point in mathematics. With the insertion of these variables, poverty ceased to be significant, which is probably due to the fact these variables are capturing this dimension in a more adequate manner. Nevertheless, the results observed need to be considered with caution, as these indicators were devised based only on items of the questionnaire applied to pupils’ parent(s)/guardian(s), and their insertion into the model generated a great loss of observations from the sample. Even so, such indicators increased the explanatory capacity of the model, and seem promising for understanding other aspects of the variation in the family context that help to explain as much the variation in starting point as, possibly, the learning during pre-school. We expect that further analyses using longitudinal data for children’s progress present a larger R2for the regression models.
The results of the models that estimated the language measurement in Wave 1 present similar patterns to those in models that estimated the mathematics measurement in relation to the schooling of the parent(s)/guardian(s) and the child’s age. However, in Model 1, we observed that boys were at a disadvantage at the initial point in language, and the parameters estimated for skin color and poverty were not statistically significant. In this model, attending a crèche seemed to represent a disadvantage. In Model 2, the variables, home learning environment and possession of goods seem to be moderately associated to the starting point in language, and, with the insertion of these variables, the parameters estimated for attending a crèche ceased to be statistically significant.
The results found tend to be aligned with studies conducted in the Brazilian context that indicate that parents’ education, socio-economic level and/or poverty and gender are associated to students’ performance in the initial years of primary school (BONAMINO et al., 2010BONAMINO, A. M. C. et al. Os efeitos das diferentes formas de capital no desempenho escolar: um estudo à luz de Bourdieu e de Coleman. Revista Brasileira de Educação, Rio de Janeiro, v. 15, n. 45, p. 487-99, set/dez. 2010. https://doi.org/10.1590/S1413-24782010000300007
https://doi.org/10.1590/S1413-2478201000...
; FRANCO et al., 2007FRANCO, C. et al. Qualidade e equidade em educação: reconsiderando o significado de fatores intra-escolares. Ensaio: Avaliação e Políticas Públicas em Educação, Rio de Janeiro, v. 15, n. 55, p. 277-97, abr./jun.2007. https://doi.org/10.1590/S0104-40362007000200007
https://doi.org/10.1590/S0104-4036200700...
; SOARES, 2003SOARES, T. M. Influência do professor e do ambiente em sala de aula sobre a proficiência alcançada pelos alunos avaliados no Simave-2002. Estudos em Avaliação Educacional, Rio de Janeiro, n. 28, jul.-dez, 2003. https://doi.org/10.18222/eae02820032172
https://doi.org/10.18222/eae02820032172...
; 2004). Nevertheless, these studies utilize data from assessment systems, the majority of which present cross-sectional designs11
11
This difference may be related do the Rio de Janeiro´s public systems criteria for admission to crèche, as vulnerable families have priority in enrolling their children at this stage of early childhood education. It is also missing the information for children enrolled in private crèche.
. Thus, they estimate the association of the students’ characteristics with their performance in the 3rd and/or 4th/5th grades of primary education, without having a control of the students’ previous performance. Even the studies that utilize longitudinal data, as is the case of studies that relied on data from “A Longitudinal study of quality and equity of Brazilian Elementary Education: GERES 2005”, or from the Rio de Janeiro municipality, counted on only on a baseline measure for the 1st or 2nd grade of primary education (BROOKE et al., 2014BROOKE, N. et al. Modelagem do crescimento da aprendizagem nos anos iniciais com dados longitudinais da pesquisa Geres. Educação e Pesquisa, v. 40, n.1, p. 77-94, jan/mar 2014. https://doi.org/10.1590/S1517-97022014000100006
https://doi.org/10.1590/S1517-9702201400...
; SOARES et al., 2017) or at the end of the 1st grade (CASTRO, 2016CASTRO, C. Avaliação do aprendizado no ciclo de alfabetização de alunos da rede municipal do Rio de Janeiro. 2016. 141 p.. Dissertação (Mestrado em População, Território e Estatísticas Públicas) — Instituto Brasileiro de Geografia e Estatística, Escola Nacional de Ciência Estatística, Rio de Janeiro, RJ, 2016.) and/or the 3rd grade (BARTHOLO; COSTA, 2016BARTHOLO, T. L.; COSTA, M. Evidence of a school composition effect in Rio de Janeiro public schools. Ensaio: Avaliação e Políticas Públicas em Educação, Rio de Janeiro, v. 24, n. 92, p. 498-521, Sept. 2016. https://doi.org/10.1590/S0104-40362016000300001
https://doi.org/10.1590/S0104-4036201600...
). Thus, the study contributes to discussion and understanding of the effect of family and child characteristics right at the beginning of compulsory schooling, that is at the beginning of pre-school.
7 Final considerations
The data presented describe what the children enrolled in the Rio de Janeiro city municipal public system know and are capable of doing at the entry to pre-school, considering the cognitive data collected in the first wave of the longitudinal study. The simple description of the scale and its pedagogic interpretation may be useful information for administrators, principals and teachers to think about curriculum and pedagogical planning for the students who enter the aforementioned school system.
The adaptive test, with the use of the software and a tablet, allows application of a test with a broad scale with the least amount of time possible (BARTHOLO et al., 2019, forthcoming). The diversity of skills among the students upon the pre-school entry, Figure 2 (Items Map), is a reality that is little studied and debated in the educational field in the Brazilian context, and challenges all teachers who deal with this age range.
The multivariate regression models suggest that there are factors associated to the children’s level of development at the entry to the compulsory schooling process. The first characteristic that is, at times, ignored by the professionals and researchers in the educational field is age. Pupils born in January, February and March of year “X”, on average, present a lower stage of development compared with their peers born in the previous year, “X - 1”, in April, May and June. This information must be considered by teachers, head teachers and other professionals involved in school activities and learning, not only during pre-school, but also in the first years of primary school.
The educational level of parents/guardians is the most significant factor in the attempts to explain pupils’ initial development stage. The results corroborate international evidence about factors associated to the learning of children and youths (GORARD; SEE, 2013GORARD, S.; SEE, B. H. Overcoming disadvantage in education. Abington: Routledge, 2013.) and studies that focus on children starting school (BURKHAM; LEE, 2002; BIERDINGER, 2010BIERDINGER, N. Early ethnic inequality: the influence of social background and parents involvement of preschool children’s cognitive ability in Germany. Child Indicators Research, v. 3, n.1, p. 11-28, jan. 2010. https://doi.org/10.1007/s12187-009-9054-6
https://doi.org/10.1007/s12187-009-9054-...
). Furthermore, there is a slight disadvantage for children living in poverty or that are not white. The home learning environment indicator suggests a positive association with the cognitive test, even after control of socio-economic level and age variables. This evidence may be utilized by policy-makers for the formulation of action with parents and guardians to disseminate activities that can be stimulated in the children’s home to bolster schoolwork.
Last but not least, longitudinal studies are important to know children’s learning trajectory at school as much as a baseline children measure which allows noticing what children know at the outset of compulsory schooling. Knowing the differences at the initial moment of schooling associated with home background characteristics can help to understand child development at the beginning of pre-school and, thus, identify potential policies and practices that can reduce such inequalities during pre-school.
References
- ALVES, M. T.; SOARES, J. F.; XAVIER, F. Índice socioeconômico das escolas de educação básica brasileiras. Ensaio: Avaliação e Políticas Públicas em Educação, Rio de Janeiro, v. 22, n. 84, p. 671-703, jul./set. 2014. https://doi.org/10.1590/S0104-40362014000300005
» https://doi.org/10.1590/S0104-40362014000300005 - ARAÚJO, C. G. S. Teste de sentar-levantar: apresentação de um procedimento para avaliação em Medicina do Exercício e do Esporte. Revista Brasileira de Medicina do Esporte, Niterói, v. 5, n. 5, p. 179-82, 1999. https://doi.org/10.1590/S1517-86921999000500004
» https://doi.org/10.1590/S1517-86921999000500004 - BARTHOLO, T. L.; COSTA, M. Evidence of a school composition effect in Rio de Janeiro public schools. Ensaio: Avaliação e Políticas Públicas em Educação, Rio de Janeiro, v. 24, n. 92, p. 498-521, Sept. 2016. https://doi.org/10.1590/S0104-40362016000300001
» https://doi.org/10.1590/S0104-40362016000300001 - BIERDINGER, N. Early ethnic inequality: the influence of social background and parents involvement of preschool children’s cognitive ability in Germany. Child Indicators Research, v. 3, n.1, p. 11-28, jan. 2010. https://doi.org/10.1007/s12187-009-9054-6
» https://doi.org/10.1007/s12187-009-9054-6 - BONAMINO, A. M. C. et al. Os efeitos das diferentes formas de capital no desempenho escolar: um estudo à luz de Bourdieu e de Coleman. Revista Brasileira de Educação, Rio de Janeiro, v. 15, n. 45, p. 487-99, set/dez. 2010. https://doi.org/10.1590/S1413-24782010000300007
» https://doi.org/10.1590/S1413-24782010000300007 - BROOKE, N. et al. Modelagem do crescimento da aprendizagem nos anos iniciais com dados longitudinais da pesquisa Geres. Educação e Pesquisa, v. 40, n.1, p. 77-94, jan/mar 2014. https://doi.org/10.1590/S1517-97022014000100006
» https://doi.org/10.1590/S1517-97022014000100006 - BURKAM, D. T.; LEE, V.E. Inequality at the starting gate. Washington, DC: EPI Books, 2002.
- CAMPOS, M. M. et al. A contribuição da educação infantil de qualidade e seus impactos no início do ensino fundamental. Educação e Pesquisa, São Paulo, v. 37, n. 1, p. 15-33, jan./abr. 2011a. https://doi.org/10.1590/S1517-97022011000100002
» https://doi.org/10.1590/S1517-97022011000100002 - CAMPOS, M. M. et al. A qualidade da educação infantil: um estudo em seis capitais brasileiras. Cadernos de Pesquisa, São Paulo, v .41, n. 142, p. 20-54, 2011b. https://doi.org/10.1590/S0100-15742011000100003
» https://doi.org/10.1590/S0100-15742011000100003 - CASTRO, C. Avaliação do aprendizado no ciclo de alfabetização de alunos da rede municipal do Rio de Janeiro. 2016. 141 p.. Dissertação (Mestrado em População, Território e Estatísticas Públicas) — Instituto Brasileiro de Geografia e Estatística, Escola Nacional de Ciência Estatística, Rio de Janeiro, RJ, 2016.
- DAGENAIS, C. et al. Use of research-based information by school practioners and determinants of use: a review of empirical research. Evidence & Policy: A Journal of Research, Debate and Practice, v. 8, n.3, p. 285-309, ago. 2012. https://doi.org/10.1332/174426412X654031
» https://doi.org/10.1332/174426412X654031 - DAMIANI, M. F. et al. Educação infantil e longevidade escolar: dados de um estudo longitudinal. Estudos de Avaliação Educacional, São Paulo, v. 22, n. 50, p. 515-32, 2011. https://doi.org/10.18222/eae225020111968
» https://doi.org/10.18222/eae225020111968 - FRANCO, C. et al. Qualidade e equidade em educação: reconsiderando o significado de fatores intra-escolares. Ensaio: Avaliação e Políticas Públicas em Educação, Rio de Janeiro, v. 15, n. 55, p. 277-97, abr./jun.2007. https://doi.org/10.1590/S0104-40362007000200007
» https://doi.org/10.1590/S0104-40362007000200007 - GOLDSTEIN, H. Methods in school effectiveness research. School Effectiveness and School Improvement, v. 8, n. 4, p. 369-95, 1997. https://doi.org/10.1080/0924345970080401
» https://doi.org/10.1080/0924345970080401 - GORARD, S.; SEE, B. H. Overcoming disadvantage in education. Abington: Routledge, 2013.
- LOEB, S., et al. Child care in poor communities: early learning effects of type, quality, and stability. Child Development, v. 75, n. 1, p. 47-65, Jan./Feb. 2004.
- MILLER, B.; PASLEY, J. What do we know and how well do we kow it? Identifying practice-based insights in education. Evidence & Policy, v. 8, n. 2, p. 193-212, May 2012. https://doi.org/10.1332/174426412X640081
» https://doi.org/10.1332/174426412X640081 - NICHD EARLY CHILD CARE RESEARCH NETWORK.; DUNCAN, Greg J. Modeling the impacts of child care quality on children´s preschool cognitive development. Child Development, New Jersey, v. 74, n. 5, p. 1454-75, sep./oct. 2003.
- PAUS, T. Cérebro. enciclopédia sobre o desenvolvimento na primeira infância. 2013. Available in: http://www.enciclopedia-crianca.com/sites/default/files/dossiers-complets/pt-pt/cerebro.pdf Accessed: 2018 Nov. 11.
» http://www.enciclopedia-crianca.com/sites/default/files/dossiers-complets/pt-pt/cerebro.pdf - PEISNER-FEINBERG, E. et al. The relation of preschool child-care quality to children’s cognitive and social developmental trajectories through second grade. Child Development, v. 72, n. 5, p. 1534-53, Sep./Oct. 2001.
- SAMMONS, P. et al. Influences on children’s attainment and progress in key stage 2: cognitive outcomes in year 6: effective pre-school and primary education 3-11 project (EPPE 3-11). Nottingham: Department for Children, Schools and Families, 2006. (Research Report, No DCSF-RR048).
- SIRIN, S. R. Socioeconomic status and academic achievement: a meta-analytic review of research. Review of Educational Research Fall, v. 75, n. 3, p. 417-53, 2005. https://doi.org/10.3102/00346543075003417
» https://doi.org/10.3102/00346543075003417 - SOARES, J. F. Qualidade e eqüidade na educação básica brasileira: a evidência do SAEB-2001. Archivos Analíticos de Políticas Educativas, v. 12, n.38, p. 1-24, 2004.
- SOARES, J. F. Qualidade e equidade na educação básica brasileira: fatos e possibilidades. In: BROCK, C.; SCHWARTZMAN, S. (Org.). Os desafios ad educação no Brasil. Rio de Janeiro: Nova Fronteira, 2005. Vol. 1, p. 91-117.
- SOARES, T. M. Influência do professor e do ambiente em sala de aula sobre a proficiência alcançada pelos alunos avaliados no Simave-2002. Estudos em Avaliação Educacional, Rio de Janeiro, n. 28, jul.-dez, 2003. https://doi.org/10.18222/eae02820032172
» https://doi.org/10.18222/eae02820032172 - SOARES, T. M. Modelos de valor agregado para medir a eficácia das escolas Geres. Ensaio: Avaliação e Políticas Públicas em Educação, Rio de Janeiro, v. 25, n. 94, p. 59-89, jan./mar. 2017. https://doi.org/10.1590/s0104-40362017000100003
» https://doi.org/10.1590/s0104-40362017000100003 - SYLVA, K., et al. Early childhood matters: evidence from the effective pre-school and primary education project. London: Routledge, 2010.
- THE UNIVERSITY OF WESTERN AUSTRALIA. Centre for Evaluation & Monitoring – CEM. Performance indicators in primary schools: baseline assessment, 2010: changes and directions. Durham: CEM Centre, 1999.
- TYMMS, P. Baseline assessment and monitoring in primary schools: achievements, attitudes and value-added indicators. London: David Fulton, 1999.
- TYMMS, P. Effect sizes in multilevel models. In: SCHAGEN, I.; ELLIOT, K. But what does it mean? The use of effect sizes in educational research. Slough, UK: National Foundation for Educational Research, 2004. p. 55-66.
- TYMMS, P.; MERRELL, C.; HENDERSON, B. The first year at school: a quantitative investigation of the attainment and progress of pupils. Educational Research and Evaluation, v.3, n. 2, p. 101-118, 1997. https://doi.org/10.1080/1380361970030201
» https://doi.org/10.1080/1380361970030201 - TYMMS, P.; MERRELL, C.; JONES, P. Using baseline assessment data to make international comparisons. British Educational Research Journal, v. 30, n. 5, p. 673-89, Oct. 2004. https://doi.org/10.1080/0141192042000234647
» https://doi.org/10.1080/0141192042000234647 - UNICEF. An unfair start: inequality in children’s education in rich countries. Florença; 2018.
- 1
-
2
Burkam and Lee (2002)BURKAM, D. T.; LEE, V.E. Inequality at the starting gate. Washington, DC: EPI Books, 2002. point that longitudinal studies have focused more on inequalities of achievement during preschool or latter and less on inequalities at “the starting gate”.
-
3
The research is funded by the Inter-American Development Bank (IDB), Fundação de Amparo à Pesquisa do Estado do Rio de Janeiro (FAPERJ) and Instituto Alfa e Beto (IAB). The authors thank the Rio de Janeiro Education Department for all the collaboration during data collection.
-
4
See Constitutional Amendment n 59 issued in November 2009.
-
5
For further information about the adaptation of the instrument, the pre-test and its results, see Bartholo et al. (2019, forthcoming). BARTHOLO, T. L. et al. Monitoring early childhood education in the Brazilian Context: constraints and possibilities. Pró-posições (forthcoming), 2019.
-
6
The two types of pre-school provision in the city of Rio de Janeiro educational system include: a) Child Development Centers (EDI), a program which confers unusual characteristics on the provision; and b) regular or “traditional” pre-schools.
-
7
Margin of error of 11.6% at 90.0% confidence interval.
-
8
The indicator provides a procedural dimension with regard to the development of parents’/guardians’ activities with children, such as: reading, drawing, singing, playing/developing activities with numbers, colors and the alphabet. Studies have already observed the association between this procedural dimension, “Home Learning Environment” and the development of children during pre-school and at the start of primary education (SYLVA et al., 2010SYLVA, K., et al. Early childhood matters: evidence from the effective pre-school and primary education project. London: Routledge, 2010.; SAMMONS et al., 2006)SAMMONS, P. et al. Influences on children’s attainment and progress in key stage 2: cognitive outcomes in year 6: effective pre-school and primary education 3-11 project (EPPE 3-11). Nottingham: Department for Children, Schools and Families, 2006. (Research Report, No DCSF-RR048).. The indicator also covers items referring to a physical environment conducive to child development (number of rooms in the home, a bedroom for the child), possession of books and children’s games. The methodology employed took as its base the Socio-Economic Index devised by Alves, Soares and Xavier (2014).
-
9
The indicator utilized items referring to the possession of goods (car, washing machine, computer, tablet, printer) and access to the following services: Internet and cable TV. Once again, the methodology employed took as its base the Socio-Economic Index devised by Alves, Soares e Xavier (2014).
-
10
It is noteworthy that the last category, 57 months or more, leads to data as much on pupils of the right age to attend pre-I as pupils who attended mixed groups (pre-I and pre-II), and, in the academic year 2017.
-
11
This difference may be related do the Rio de Janeiro´s public systems criteria for admission to crèche, as vulnerable families have priority in enrolling their children at this stage of early childhood education. It is also missing the information for children enrolled in private crèche.
-
12
Campos et al. (2011a): the quality of crèche provision was measured using the Infant/Toddler Environment Rating Scale Revised Edition. It focuses on: a) space and furnishings, b) personal care routines, c) language and literacy, d) learning activities, e) interactions, f) program structure.
-
13
The studies by Soares (2005)SOARES, J. F. Qualidade e equidade na educação básica brasileira: fatos e possibilidades. In: BROCK, C.; SCHWARTZMAN, S. (Org.). Os desafios ad educação no Brasil. Rio de Janeiro: Nova Fronteira, 2005. Vol. 1, p. 91-117.; Franco et al. (2007)FRANCO, C. et al. Qualidade e equidade em educação: reconsiderando o significado de fatores intra-escolares. Ensaio: Avaliação e Políticas Públicas em Educação, Rio de Janeiro, v. 15, n. 55, p. 277-97, abr./jun.2007. https://doi.org/10.1590/S0104-40362007000200007
https://doi.org/10.1590/S0104-4036200700... used data from the Sistema de Avaliação da Educação Básica (SAEB – Basic Education Assessment System) for the 4th grade of primary school. On the other hand, Soares (2003)SOARES, T. M. Influência do professor e do ambiente em sala de aula sobre a proficiência alcançada pelos alunos avaliados no Simave-2002. Estudos em Avaliação Educacional, Rio de Janeiro, n. 28, jul.-dez, 2003. https://doi.org/10.18222/eae02820032172
https://doi.org/10.18222/eae02820032172... used data from the Sistema Mineiro de Avaliação Educacional (SIMAVE – Minas Gerais Educational Assessment System) for the 3rd primary school year.
Publication Dates
-
Publication in this collection
28 Nov 2019 -
Date of issue
Apr-Jun 2020
History
-
Received
30 Nov 2018 -
Accepted
28 Aug 2019

 Source: Authors own elaboration (2019).
 Source: Authors own elaboration using WinSteps, 2017.
 Source: Authors own elaboration, 2017.
 Source: Authors own elaboration, 2017.