Abstract
The study aims to determine the efficiency of undergraduate courses associated with a Brazilian Federal University contributing to the discussion about performance evaluation models in the context of Brazilian Higher Education. Data envelopment analysis (DEA) is used to obtain the efficiency indexes that reflect the ability of the courses to add knowledge to students during the academic training period. Therefore, DEA-BCC model is applied in two different scenarios. In the first one, undergraduate courses were evaluated as a whole, to compare them, regardless of their differences. In the second scenario, the profile differences of each course are respected by grouping these units. Thus, the findings showed that 10 of the 31 units were considered efficient in Scenario 1, that is, they are courses that have provided greater capacity to add knowledge to the students in the considered period. For the inefficient units, some variables that should be improved were analyzed. In Scenario 2, when the courses are grouped by area, the peers that serve as benchmarks for the inefficient courses were identified.
Higher Education; Undergraduate Courses; Performance Evaluation; DEA
Resumo
O estudo tem como objetivo determinar a eficiência de cursos de graduação vinculados a uma universidade federal brasileira contribuindo para a discussão a respeito de modelos de avaliação dentro do ensino superior brasileiro. Utiliza-se a análise envoltória de dados (DEA) para a obtenção de índices de eficiência capazes de refletir a capacidade dos cursos em agregar conhecimento aos estudantes durante o período de formação acadêmica. Assim, o modelo DEA-BCC foi aplicado em dois cenários distintos. No primeiro, os cursos de graduação foram avaliados de maneira conjunta, independentemente de suas diferenças. No segundo cenário, as diferenças de perfil de cada curso foram respeitadas através do agrupamento dessas unidades. Dessa forma, os resultados mostraram que 10 das 31 unidades foram consideradas eficientes, no Cenário 1, ou seja, são cursos que proporcionaram maior capacidade de agregar conhecimento aos alunos no período considerado. Para as unidades ineficientes, foram analisadas algumas variáveis que deveriam ser aprimoradas. Já no Cenário 2, foram identificados os cursos de graduação que servem como referência para as unidades ineficientes.
Ensino Superior; Cursos de Graduação; Avaliação de Desempenho; DEA
Resumen
Este estudio tiene como objetivo determinar la eficiencia de cursos de pregrado vinculados a una universidad federal brasileña contribuyendo a la discusión acerca de modelos de evaluación dentro de la enseñanza superior brasileña. El Análisis Envolvente de Datos (DEA) se utiliza para la obtención de índices de eficiencia capaces de reflejar la capacidad de los cursos en agregar conocimiento a los estudiantes durante el período de formación académica. El modelo DEA-BCC fue aplicado en dos escenarios distintos. En el primero, los cursos de pregrado fueron evaluados en su conjunto, para compararlos, independientemente de sus diferencias. En el segundo escenario, las diferencias de perfil de cada curso se respetaron a través del agrupamiento de esas unidades. De esta forma, los resultados mostraron que 10 de las 31 unidades se consideraron eficientes en el escenario 1, es decir, son cursos que han proporcionado una mayor capacidad para agregar conocimiento a los estudiantes en el período considerado. Para las unidades ineficientes, se analizaron algunas variables que deberían mejorarse. En el escenario 2, cuando los cursos se agrupan por área, se identificaron los pares que sirven como puntos de referencia para los cursos ineficientes.
Enseñanza Superior; Cursos de Grado; Evaluación de Desempeño; DEA
1 Introduction
Brazilian public universities play an important social role supporting personal development, among other contributions. This is done by preparing a large number of young people to assume different positions in the labor market through the performance of universities’ teaching, research and extension activities. Moreover, they make possible a career advancement of these individuals, who seek the opportunity to adapt to the demands imposed by modern organizations. On the other hand, they expect that the Higher Education Institution (HEI) will be able to offer the necessary conditions for the development of knowledge and skills, thus fulfilling one of the university’s central objectives ( KATHARAKI; KATHARAKIS, 2010KATHARAKI, M.; KATHARAKIS, G. A comparative assessment of Greek universities’ efficiency using quantitative analysis. International Journal of Educational Research , Amsterdam, v. 49, n. 4-5, p. 115-128, Nov. 2010. https://doi.org/10.1016/j.ijer.2010.11.001
https://doi.org/10.1016/j.ijer.2010.11.0...
).
The Support Program for Restructuring Plans and Expansion of Federal Universities in Brazil (Reuni), in force between 2007 and 2011, presented great challenges for the managers of these institutions, mainly due to the significant increase in the number of students, administrative staff and faculty. At the same time, managers had to deal with declining budgets and some structures that were not adequate to receive this significant number of people integrated into the academic community ( TAVARES; ANGULO-MEZA, 2017TAVARES, R. S.; ANGULO-MEZA, L. Uso da análise envoltória de dados para a avaliação da eficiência em cursos de graduação: um estudo de caso em uma Instituição de Ensino Superior brasileira. Revista Espacios , v. 38, n. 20, p. 16, jan. 2017. ). Thus, one of the concerns is with the possible loss of quality of these institutions, because their infrastructure has not kept up with the growth rate of universities in recent years ( BRAZIL, 2007BRAZIL. Ministério da Educação. Secretaria de Educação Superior. Diretrizes gerais do Programa de Apoio a Planos de Reestruturação e Expansão das Universidades Federais – REUNI . Brasília, DF, 2007. Available from: http://portal.mec.gov.br/sesu/arquivos/pdf/diretrizesreuni.pdf. Accessed on: 2019 Jan. 26.
http://portal.mec.gov.br/sesu/arquivos/p...
).
In Brazil, the public agency responsible for evaluating the performance of HEIs is National Institute of Educational Studies and Research Anísio Teixeira (Inep). This agency is linked to the Ministry of Education (MEC), which through the National System for the Evaluation of Higher Education (Sinaes) ensures the national evaluation process.
However, since the publication of the Shanghai Ranking (ARWU), in 2003, there is a growing number of researches that propose frameworks capable of analyzing and evaluating HEIs. Some concepts on this subject can be seen in Bernardino and Marques (2010)BERNARDINO, P.; MARQUES, R. C. Academic rankings: an approach to rank portuguese universities. Ensaio: Avaliação e Políticas Públicas em Educação , Rio de Janeiro, v. 18, n. 66, p. 29-48, jan. 2010. https://doi.org/10.1590/S0104-40362010000100003
https://doi.org/10.1590/S0104-4036201000...
and Andriola and Araújo (2018). These frameworks attempt mainly to identify better empirical methods of evaluation, based on data availability, in order to produce more representative indicators for the benchmarking analysis ( GUIRONNET; PEYPOCH, 2018GUIRONNET, J. P.; PEYPOCH, N. The geographical efficiency of education and research: the ranking of U.S. universities. Socio-Economic Planning Sciences, New York, v. 62, p. 44-55, June 2018. https://doi.org/10.1016/j.seps.2017.07.003
https://doi.org/10.1016/j.seps.2017.07.0...
). One method that has been widely used in this context is Data Envelopment Analysis, popularly known as DEA.
Berbegal-Mirabent and Solè (2012) point out that the use of DEA in the evaluation of HEIs has grown since the 80’s. The authors also emphasize that DEA is a well-known approach that fits very well with university requirements, reporting not only valuable information on how to improve efficiency, but also allowing comparisons between those with similar behaviors.
In general terms, DEA technique evaluates the efficiency of a set of homogeneous units, considering the efficiency concept in which is compared what was produced (outputs), given the available resources (inputs) of all units.
Thus, the efficiency evaluation in the context of federal universities is an alternative to managers, the academic community and society, to obtain more information that helps in the finding for an optimized use of IES resources. The information obtained will be used to highlight best practices, eliminating possible existing waste through improvements in efficiency that will lead these institutions to reach their full potential ( ABBOTT; DOUCOULIAGOS, 2003ABBOTT, M.; DOUCOULIAGOS, C. The efficiency of Australian universities: a data envelopment analysis. Economics of Education Review , Cambridge, v. 22, n. 1, p. 89-97, Feb. 2003. https://doi.org/10.1016/S0272-7757(01)00068-1
https://doi.org/10.1016/S0272-7757(01)00...
).
The present study aims to evaluate the efficiency of undergraduate courses, responsible for the development of university students, seeking quantitative results regarding the ability of each course to add knowledge to these students during the period of their academic formation. For this, two scenarios are considered – an evaluation that includes all undergraduate courses considered in the analysis, belonging to the same university, and a grouped evaluation, considering the area of knowledge of each course.
This paper is divided into 5 sections starting with this introduction. In section 2, some information about the HEI studied and a brief discussion about the evaluation of the Higher Education in Brazil is presented, followed by the methodology issues, in section 3. The results are arranged in section 4 and in section 5 are the conclusions of the study.
2 Theoretical background
This section is dedicated to present information regarding the evaluated HEI, clarifying the official evaluation process in Brazil focused on student’s evaluation.
2.1 Fluminense Federal University
The present study intends to measure the efficiency of undergraduate courses offered by Fluminense Federal University (UFF). This section aims to bring information about this HEI, contextualizing its history, structure and expansion.
Initially denominated as Federal University of the State of Rio de Janeiro (Uferj) and founded through law nº 3,848 of December 18, 1960 ( BRAZIL, 1960BRAZIL. Lei Nº 3.848, de 18 de dezembro de 1960. Cria a Universidade do Estado do Rio de Janeiro, e dá outras providências. Diário Oficial da União, Brasília, DF, 20 dez. 1960. ), UFF was created to meet the yearning of Rio de Janeiro’s society, which sought economic development for the region that had as its main activity agriculture. Part of the Rio de Janeiro region’s development project, the university is based in the city of Niterói and it is one of the 63 federal universities in Brazil ( INEP, 2018INSTITUTO NACIONAL DE ESTUDOS E PESQUISAS EDUCACIONAIS ANÍSIO TEIXEIRA - INEP. Sinopse estatística da educação superior 2017. Brasília, DF, 2018. Available from: http://portal.inep.gov.br/web/guest/sinopses-estatisticas-da-educacao-superior. Acessed on: 2019 Jan. 18.
http://portal.inep.gov.br/web/guest/sino...
). Among the federal universities in the year 2017, Fluminense Federal University offered the highest number of vacancies among the face-to-face courses and it is the second HEI in relation to distance learning courses in Brazil.
Another fact that draws attention is that this university has the highest number of graduated students in distance learning Education and the second highest number of graduated students in face-to-face teaching. According to the Brazilian Higher Education Census of 2017 ( INEP, 2018INSTITUTO NACIONAL DE ESTUDOS E PESQUISAS EDUCACIONAIS ANÍSIO TEIXEIRA - INEP. Sinopse estatística da educação superior 2017. Brasília, DF, 2018. Available from: http://portal.inep.gov.br/web/guest/sinopses-estatisticas-da-educacao-superior. Acessed on: 2019 Jan. 18.
http://portal.inep.gov.br/web/guest/sino...
), the university had approximately 47,000 enrollments in that year.
The face-to-face courses of the university are distributed among the 12 cities. According to the Institutional Development Plan ( UFF, 2009UNIVERSIDADE FEDERAL FLUMINENCE – UFF. PDI - Plano de Desenvolvimento Institucional 2008-2012. Niterói, 2009. Available from: http://pdi.sites.uff.br/pdis-da-uff. Acessed on 2019 Jan. 19.
http://pdi.sites.uff.br/pdis-da-uff...
), UFF is the public HEI with greater presence in cities in the interior of the state.
2.2 Evaluation of the Higher Education system in Brazil
The Federal Fluminense University, like other Brazilian universities, has its performance periodically analyzed by the Sinaes. This system, in force since 2004, emerged as a proposal to be a guide for the various institutional models (CASTRO et al., 2018) and it is structured based on three main components: the evaluation of Higher Education Institutions, the undergraduate courses’ evaluation offered by these institutions, and the academic performance of their students.
It is worth highlighting, for the purposes of building the evaluation model, object of this research, the important instrument inherent to the last component indicated in the previous paragraph. This is the National Student Performance Exam (Enade), which is one of the important variables used in this study to obtain the efficiency indexes of the undergraduate courses evaluated.
With this, subsection 2.2.1 is dedicated to dealing with conceptual questions about Enade. In order to know the issue of the Sinaes evaluation processes in more detail, it is recommended to read the articles: Polidori, Marinho-Araujo and Barreyro (2006) and Pereira, Araujo and Machado-Taylor (2018).
2.2.1 National Student Performance Exam (Enade)
Enade is an instrument for evaluating the performance of students from Brazilian HEIs. This instrument is characterized as a mandatory exam, with periodic application and divided into cycles of three years, according to the area of knowledge and technological axis of the undergraduate course to which the student is enrolled. Inep is responsible for carrying out the mentioned exam (Brazil, 2004).
This exam was introduced together with Sinaes, in 2004, replacing the old instrument of student assessment, the National Examination of Courses (ENC), known as “ Provão ”. The study proposed by Verhine, Dantas and Soares (2006) delves into the similarities and differences between the two exams.
Lima et al. (2019) explain that Enade mixes two evaluation components: the specific component (whose results will be used for the efficiency assessment proposed in this study) and the general component. The specific component aims to assess and monitor the learning process of students and their academic performance in relation to the curricular guidelines of the respective undergraduate course. The general component, on the other hand, aims to test the students’ skills in adapting to the requirements arising from the evolution of knowledge. Moreover, it aims to test the skills to understand themes outside the specific scope of the chosen profession, linked to the Brazilian and world’s reality and other areas of knowledge.
Lima et al. (2019) still point out that Enade is formed, in addition to knowledge tests, by a questionnaire to identify students’ perception of the test and another questionnaire to identify the educational socioeconomic profile of the student.
Another factor that must be clarified refers to the selection of students who participate in Enade. The exam will be applied, admitting the use of sampling procedures, to students of all undergraduate courses, at the end of the first and last year of the course (incoming and concluding students, respectively).
It is noteworthy that Enade evaluates the performance of incoming undergraduate students, that is, students who have completed a minimum percentage established, in relation to the minimum curriculum load. Also, this exam evaluates the performance of concluding students, those who have completed a certain percentage of the minimum curriculum load. In this way, the requirements related to the criteria established by MEC are fulfilled according to the nature of their course. It should be added that in the latest editions of Enade, incoming students have been excused from taking the test, as confirmed by the study by Feldmann and Souza (2016)FELDMANN, T.; SOUZA, O. A governamentalidade e o Exame Nacional de Desempenho de Estudantes - ENADE. Avaliação (Campinas), Sorocaba, v. 21, n. 3, p. 1017-1032, ago./nov. 2016. https://doi.org/10.1590/S1414-40772016000300017
https://doi.org/10.1590/S1414-4077201600...
.
Finally, due to the direct influence on the choice of the sample for this study, it is worth mentioning one of the peculiarities of Enade: the possibility of boycotting by some students of certain undergraduate courses that do not agree with the evaluation methodology and with the aspects of Higher Education policies imposed by MEC.
About this subject, Leitão et al. (2010) studied the phenomenon called boycott of the exams that make up the system of evaluation of Higher Education in Brazil. It was observed the occurrence of boycotts between 1997 and 2007 (ENC and Enade) and it was verified that the percentage of boycotts never exceeded 3.5% for the total population evaluated in all years of application, which ensures that the data obtained, despite having a few inconsistencies in isolated cases, can be used, since the occurrence of boycott is minimal.
3 Methodology
3.1 Data envelopment analysis
Data Envelopment Analysis (CHARNES et al ., 1978) aims to evaluate the efficiency of production units called Decision Making Units (DMUs) and the method calculates the efficiency frontier based on the observed inputs and amount of outputs of all DMUs. In this way, using mathematical programming, an efficiency index is obtained. For the inefficient DMUs, DEA provides targets (input and output levels to achieve in order to become efficient) and benchmarks (reference set) containing managerial/operational information.
There are two classical DEA models: the CCR model and the BCC model. Initially, it is pointed out that the main difference between these models is related to the way in which the returns of scale between input and output variables are handled. Another characteristic in DEA is the orientation of the model. As shown in Figure 1 , when the input-oriented approach is sought, the resources used are reduced, while the same levels of results are maintained, and when output-oriented, we aim to maximize the results obtained while maintaining the same resources, as shown in Figure 2 .


3.2 Inverted efficiency and composed efficiency
When determining the efficiency index, DEA models may be benevolent, that is, many DMUs may be deemed efficient. There are methods to avoid the low discrimination among efficient DMUs. In this section, we present a method to rank all DMUs with DEA.
In addition to the efficiency index, that will be called standard efficiency, which associates the 100% value to the efficient DMUs, there are other indexes that evaluate the performance of the units, such as inverted efficiency, which evaluates DMUs under a different optic.
In order to increase in the discrimination power of DEA (i.e. to reduce the number of DMUs tied to the efficiency frontier) as well as to identify the DMUs classified as default-efficient (i.e., a unit benefited by the benevolence of the DEA model, just by having a variable with a prominent performance), we will use the inverted frontier. This approach was initially proposed by Yamada et al. (1994) and it is obtained by considering outputs as inputs and inputs as outputs. This frontier allows to identify the worst managerial practices, providing an opposite view of the classical DEA frontier (LETA et al., 2005). Using the inverted efficiency index, it is still possible to calculate the so-called composite efficiency index. The composite efficiency index is defined by the arithmetic mean between the efficiency regarding the original frontier and the inefficiency in relation to the inverted frontier (SOARES DE MELLO et al., 2008). Equation 1 shows the composed efficiency:
Effc is the composed efficiency / Eff p is the standard efficiency / Eff i is the inverted efficiency.
It should be noted that this study will not be limited to the standard efficiency index and will use the inverted efficiency index and the composed efficiency, which will allow a complete classification of the DMUs under study.
3.3 Definition and selection of DMUs
Some of the active undergraduate courses offered by UFF will be considered as DMUs under evaluation. It should be emphasized that the data that support the study refer to the period between 2007 and 2012, so that it is taken into account that the students who are attending the last periods of the undergraduate course (concluding student) of 2012, for example, joined the HEI four or five years ago, depending on the standard course duration.
In order to make possible the application of DEA, in this study, the UFF’s undergraduate courses must have available clear and consistent information concerning the variables described in section 3.4. Thus, some of the undergraduate courses were excluded from the analyzed sample, due to the lack of important information. This happened because of the manager’s unavailability of the information or the recent creation of some courses, due to the program of expansion of federal universities.
One of the variables that were most affected by the recent creation of undergraduate courses is the result of the Enade for incoming students, as explained in sections 2.2.1 and 3.4.1.
Another reason for the exclusion of undergraduate courses from the analysis was the lack of precision and consistency of information available. This happened with some specific undergraduate courses offered by UFF, which presented very low values for the variable “Faculty”, which clearly do not agree with the reality of the course.
Similarly, it was decided to exclude from the analysis the thirteen courses focused on Languages and Literature. They presented aggregated data about the performance of students in Enade test, which could affect the reliability of the results of the DEA model used.
Other DMUs were excluded due to inconsistent data in the variable Undergraduate Success Rate (USR), which has expected values ranging from 0 to 1, as will be explained in section 3.4.2. Thus, DMUs with USR greater than 1 were eliminated from the set.
Finally, after analyzing the data regarding the performance of the students of each undergraduate course in Enade exam, it was proposed to exclude some courses because they present anomalous values in this variable. For this, we compared the results of their incoming and concluding students with the national average obtained by this same course considering all institutions of Higher Education and we eliminated DMUs that demonstrated signs of boycott.
After exclusion of some courses with missing or inaccurate data, the DMUs to be evaluated in this work and their acronyms are listed in Table 1 .
As can be seen in Table 1 , some specific courses are classified into Bachelor’s Degree and Licentiate’s Degree, according to the emphasis of the curriculum matrix. Guidelines established by the Ministry of Education of Brazil state that the first group is configured as generalist Higher Education courses, which are focused on preparing professionals for the job market. The second group are Higher Education courses that give the graduate the skills to act as a teacher in elementary, Middle-School and High-School Education.
3.4 Variables used in the model
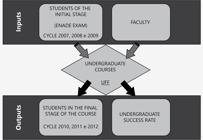
In this step, the inputs and outputs used in the DEA efficiency assessment will be described. Figure 3 graphically shows the model used and its inputs and outputs.
3.4.1 Inputs
INCOMING STUDENTS (INC_EN): This variable represents the performance of incoming students of each course, related to the evaluation of the specific component in the 2007, 2008 and 2009 cycle of the Enade exam. An incoming student is the one who completed a certain percentage of the subjects according to the curricular grade, defined by Inep.
FACULTY (FAC): This indicator reflects the size of the faculty that effectively participates in the undergraduate course. These data were obtained through records of the year 2012.
3.4.2 Outputs
CONCLUDING STUDENTS (CONC_EN): This variable is directly linked to the variable INC_EN. It represents the performance of students who are in the final phase of the undergraduate course (concluding students), in the 2010, 2011 and 2012 cycle of the Enade exam. This output when compared to the input “incoming students” referring to the previous exam cycle (2007, 2008 e 2009), reflects the ability of the course to contribute to the development of new knowledge to the students.
UNDERGRADUATE SUCCESS RATE (USR): The USR index was calculated by the ratio between the number of graduates in 2012 and the number of entrants in 2012- n , where n is the standard duration of a given course. The USR in 2012 is defined by Equation 2:
Where:
-
NDi2012: represents the total number of graduates in 2012; and
-
Nifp2012: represents the total number of incoming students enrolled in previous years with a graduation expected to occur in 2012. For the calculation of Nifp2012, the year or semester of the supposed incoming students who graduated in 2012, should be considered based on the Standard Duration (SD) defined by Secretariat of Higher Education (SESu) for each course.
Finally, it is important to note that the USR index is expected to be between 0 and 1; however, a few courses presented a USR > 1. In these cases, as mentioned previously, to avoid inconsistencies in the obtained efficiency indexes, we opted to exclude these DMUs.
3.5 Data collection
The information that will serve as a basis for conducting the study is available on several websites that provide public databases, such as Inep, the Ministry of Education and the Fluminense Federal University website. Although some data were not publicly disclosed, they were requested and obtained through a government communication channel called the Electronic System of Citizen Information Service (e-SIC).
3.6 Analysis and treatment of data
Finally, two scenarios will be considered for evaluating the efficiency of UFF’s undergraduate courses. The first one will consider all the DMUs in a global way and the second one proposes a clustering of these units, considering its area of pertinence, with the objective of obtaining a more homogeneous set of reference for the inefficient courses (benchmarks).
4 Results
4.1 Scenario I: global assessment
Initially, the efficiency of a set of 31 UFF’s undergraduate courses was determined. Table 2 shows the statistical data for this scenario.
Next, Table 3 lists the undergraduate courses under evaluation, and the standard, inverted and composed efficiencies of each DMU, obtained through the DEA technique application and using SIAD software, developed by Angulo-Meza et al. (2005).
Table 3 shows that 10 of the 31 courses analyzed have standard efficiency equal to 1, that is, they are located on the BCC standard efficiency frontier. The ordering of the courses was established according to the composed efficiency, since the index offers a greater discrimination of the evaluated DMUs. We can verify that the courses ADM_ITA, DEN_NIT and SOC_GOY can be efficient by default, that is, due to the benevolence of the BCC model, they are efficient just for having the lowest value in one of the inputs or the largest value in one of the outputs (DYSON et al ., 2001).
This is most evident when analyzing the inverted efficiency attributed to the first and third courses mentioned (0.789 and 0.790, respectively). A high value for inverted efficiency may mean that the DMU is on the efficiency frontier due only to the benevolence of the BCC model. In the specific case of DMU DEN_NIT, although the possibility exists to be efficient by default, the course has a high composed efficiency index, showing that the course performed well in this scenario, as well as DMUs NUR_NIT, and LCH_NIT.
It is also verified that the DMU AGR_NIT is among the three lowest indexes of composed efficiency. Other poor performing courses are: LMT_NIT and ECO_NIT, which make up the group of the three worst performances. On the other hand, the VET_NIT and MET_VR courses deserve a positive mention, since they were not on the standard efficiency frontier, but obtained a high standard efficiency and composed efficiency index that were much higher than courses considered efficient.
Graph 1 presents the targets for the variable “concluding students” using the standard BCC model, the average performance of the students of each course at the national level and the result obtained by each course evaluated at the Fluminense Federal University.
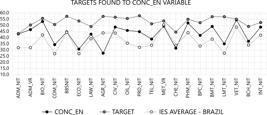
Twenty-one undergraduate courses considered to be inefficient in Scenario 1 are shown in Graph 1 , in which it is easy to see that the AGR_NIT, LMT_NIT and ECO_NIT courses are among the worst performers in the set and a great improvement in the performance of the “concluding students” of these courses will be necessary to reach the target proposed by the DEA model. It can also be seen in the Graph 1 that only two courses obtained indexes below the national average in this variable: CHE_NIT and AGR_NIT. On the other hand, ADM_NIT, BIO_NIT, PHM_NIT and VET_NIT achieved a result significantly above the national average and all of them require just a small improvement to operate optimally in this variable.
For the output Undergraduate Success Rate, the targets defined by the DEA-BCC model for the 21 undergraduate courses considered to be inefficient are shown in Graph 2 .

Graph 2 presents the undergraduate courses according to its USR value, arranged in a descending order, as well as their targets using the standard BCC model. We can verify that the undergraduate courses related to the Mathematical Sciences, due to the reduced values in this variable are those that need a more significant improvement to reach the proposed target. The undergraduate course BPC_NIT and the two undergraduate Mathematics courses present in the Graph 2 are those that visually present a longer path to reach the target. ADM_NIT, VET_NIT and BIO_NIT are those that obtained the closest results of their targets for this variable.
4.2 Scenario II: clustering performance evaluation
In the second scenario, it is proposed to group the undergraduate courses according to the thematic area in which they are inserted, in order to respect the different profiles of each course and to facilitate the establishment of benchmarks for inefficient DMUs. Three different groups were proposed: Mathematical Sciences, Earth Sciences and Engineering (G1), Social Sciences and the Humanities (G2) and Biological Sciences and Health (G3), as organized in Table 4 .
Next, Tables 5 , 6 and 7 refer to the descriptive statistics for each group.
Tables 5 , 6 and 7 show once again that the courses in the area of Mathematical Sciences, Earth Sciences and Engineering present values for the variable USR significantly lower than those of the other two groups, indicating a greater retention of students. The undergraduate courses in the area of Social Sciences and the Humanities have on average a shorter faculty when compared to the other groups, unlike what happens with the Biological Sciences and the Health area. In Group 3, we also observe higher average indexes on the variables CONC_EN and USR. Based on this pre-analysis, Table 8 shows the efficiency indexes in Scenario 2 for undergraduate courses in the Mathematical Sciences, Earth Sciences and Engineering area.
In this second scenario, the composed efficiency index will serve as the basis for the unit’s performance analysis, since with the reduction of the number of DMUs, due to the proposed grouping, a significant decrease in the discrimination is observed. Thus, the results of the DEA-BCC model pointed out that 7 of the 15 undergraduate courses are efficient, considering only the standard efficiency frontier in this group.
MET_VR and CIV_NIT were not considered efficient in the Scenario1. In Scenario 2, besides obtaining a standard efficiency equal to 1, they also exhibit a high value on the composed efficiency frontier. The students of both courses performed well in the variables CONC_EN and FAC. In these cases, both DMUs perform close to the average found in the group (99 and 164). In addition, the results of USR are higher than those found for the group average. The good performance in all these variables made these courses stand out from the others.
LCH_NIT and COM_RO are on the standard efficiency frontier as well; however, they obtained composed efficiency indexes lower than inefficient courses in Scenario 1. It was verified that the course COM_NIT can be efficient by default, since it has the lowest FAC input and the highest CONC_EN output among the other courses. This undergraduate course still has a considerably high inverted efficiency value (> 0.78).
As in the other scenario, the courses LMT_NIT and AGR_NIT are among the ones found with the worst performances. Table 9 indicates the reference set for the inefficient courses in Group 1. The grouping of courses by area, although increasing the number of efficient DMUs, assists in proposing more similar units as a benchmark to those that are not on the frontier.
The first column of Table 9 presents the undergraduate courses indicated by the DEA-BCC model as inefficient, i.e., the standard efficiency index is different from 1. The first line of Table 9 lists the courses that are on the standard efficiency frontier and can be pointed as reference for the inefficient DMUs. The colored cells represent the closest benchmark proposal for an inefficient DMU.
As example, we can verify LMT_NIT course, which has as reference COM_RO. Both are similar in Faculty (28 x 27) and USR (> 0.2). LCH_NIT appears as the main reference for four courses, becoming the DMU more often pointed as benchmark for the others.
Among the courses belonging to the area of Social Sciences and Humanities (Group 2), the efficiency indexes can be seen in Table 10 .
For the Social Sciences and the Humanities courses, only two DMUs do not belong to the standard efficiency frontier, they are LAW_NIT and ECO_NIT. These courses have the two largest faculty in the group (134 and 126). In addition to the large number of professors, compared to the other units in the group, these inefficient DMUs performed poorly on the CONC_EN output when compared to the ING_EN input.
ADM_NIT has the highest composed efficiency index of Group 2. This DMU does not show signs of being efficient by default, since none of its inputs is the smallest in the group, and none of its outputs is the largest in the group. Nevertheless, it has a faculty size close to the average of the other courses (66) and a very high performance in the variable USR (> 0.9).
Regarding the reference set, Table 11 indicates the benchmarks for inefficient undergraduate courses of Group 2. It is noticed that, the smaller the number of courses in a given group, the smaller the number of inefficient DMUs. This is clear in Groups 2 and 3.
Table 11 shows that ADM_NIT represents the best reference for these courses, which has the best composed efficiency index. For ECO_NIT, besides ADM_NIT, BPL_NIT and LPL_NIT were also proposed as reference. For LAW_NIT, the reference set is completed with INT_NIT. To conclude the efficiency analysis in Scenario 2, Table 12 lists the courses belonging to the area of Biological Sciences and Health.
Group 3 has the lowest number of undergraduate courses, totaling 6 DMUs. Thus, the standard efficiency results in the DEA-BCC model indicated five courses as efficient, so the analysis will be concentrated on the composed efficiency index.
As in Scenario 1, NUR_NIT has the highest composed efficiency value among its peers. This result can be explained by the evolution in the concluding students’ performance (56.3) in relation to the incoming students who did the Enade in the previous cycle (28,5). The variable Undergraduate Success Rate also presents a satisfactory index (> 0,8).
DEN_NIT and VET_NIT follow the same pattern as NUR_NIT, presenting a similar faculty and a high USR index; however, the relationship between the performance of the concluding and incoming students in Enade test is not as good as in this last course. BBS_NIT is the only non-efficient DMU in the group, which can be explained by the robust faculty and USR variable that is lower than expected for its area. Since Group 3 presents only one non-efficient DMU, Table 13 shows the reference set for BBS_NIT DMU.
Table 13 shows that BBS_NIT has as reference NUR_NIT and DEN_NIT, being pointed a greater similarity with the latter.
Finally, in order to approximate the two scenarios proposed in this section and to provide a clearer analysis of the performance of the undergraduate courses considering both the standard efficiency and the composed efficiency, Graph 3 was elaborated.

In Graph 3 , using results from Scenarios 1 and 2, we calculate the average index of the standard efficiencies and then the average index of the composed efficiencies for all DMUs.
Initially, it can be noticed that 10 courses obtained a standard efficiency index equal to 1 in both evaluation scenarios. Although MET_VR is efficient only in Scenario 2, it has the highest average of composed efficiency compared to the other DMUs.
NUR_NIT, DEN_NIT, LPL_NIT and COM_RO also had a good overall performance and have an average composed efficiency index greater than 0.6. Note also the good performance of the DMUs CIV_NIT and VET_NIT, since they are not on the standard efficiency frontier, but still have high standard efficiency indexes. As previously noted, LMT_NIT, ECO_NIT, and AGR_NIT are the ones that most need improvement.
5 Conclusions
The present study proposed an efficiency evaluation approach in order to analyze undergraduate courses, considering the ability of each of them to contribute to the evolution of their students during the period of their academic training. Data Envelopment Analysis was used considering two distinct scenarios through a case study in a Brazilian federal university.
In both scenarios, four variables were used, two inputs (performance of incoming students in the Enade exam and Faculty) and two outputs (concluding student performance in Enade exam and Undergraduate Success Rate).
The results found may support the manager’s decision-making process and they may be replicated in other educational institutions, contributing to the formulation and proposal of public policies in Higher Education context.
In order to enrich the analysis of the research results, a qualitative study of the undergraduate courses evaluated in this manuscript is proposed as future work, considering their performance in a longer period of time. We also suggest that this qualitative study may be used to deepen inferences regarding factors that influence the efficiency indexes obtained for these courses. Thus, a qualitive study would complement the present quantitative DEA analysis.
Moreover, we recommend as future research the application of a network DEA model, considering the intermediate stages of this process (Network DEA). It is also necessary to find a substitute for the variable INC_EN, since Enade no longer considers the performance of incoming students since the year 2011.
Referências
- ABBOTT, M.; DOUCOULIAGOS, C. The efficiency of Australian universities: a data envelopment analysis. Economics of Education Review , Cambridge, v. 22, n. 1, p. 89-97, Feb. 2003. https://doi.org/10.1016/S0272-7757(01)00068-1
» https://doi.org/10.1016/S0272-7757(01)00068-1 - ANDRIOLA, W. B.; ARAUJO, A. C. Uso de indicadores para diagnóstico situacional de Instituições de Ensino Superior. Ensaio: Avaliação e Políticas Públicas em Educação , Rio de Janeiro, v. 26, n. 100, p. 645-663, jul. 2018. https://doi.org/10.1590/s0104-40362018002601062
» https://doi.org/10.1590/s0104-40362018002601062 - ANGULO-MEZA, L. A. et al. IS A.YDS - Integrated System for Decision Support (SIAD - Sistema Integrado de Apoio à Decisão): a software package for data envelopment analysis model. Pesquisa Operacional , Rio de Janeiro, v. 25, n. 3, p. 493-503, Sep./Dec. 2005. https://doi.org/10.1590/S0101-74382005000300011
» https://doi.org/10.1590/S0101-74382005000300011 - BERBEGAL-MIRABENT, J.; SOLÉ, F. What are we measuring when evaluating universities efficiency? Regional and Sectoral Economic Studies , [s. l.], v. 12, n. 3, p. 31-46, Jan. 2012.
- BERNARDINO, P.; MARQUES, R. C. Academic rankings: an approach to rank portuguese universities. Ensaio: Avaliação e Políticas Públicas em Educação , Rio de Janeiro, v. 18, n. 66, p. 29-48, jan. 2010. https://doi.org/10.1590/S0104-40362010000100003
» https://doi.org/10.1590/S0104-40362010000100003 - BRAZIL. Lei Nº 3.848, de 18 de dezembro de 1960. Cria a Universidade do Estado do Rio de Janeiro, e dá outras providências. Diário Oficial da União, Brasília, DF, 20 dez. 1960.
- BRAZIL. Lei Nº 10.861, de 14 de abril de 2004. Institui o Sistema Nacional de Avaliação da Educação Superior - SINAES e dá outras providências. Diário Oficial da União, Brasília, DF, 15 abr. 2004.
- BRAZIL. Ministério da Educação. Secretaria de Educação Superior. Diretrizes gerais do Programa de Apoio a Planos de Reestruturação e Expansão das Universidades Federais – REUNI . Brasília, DF, 2007. Available from: http://portal.mec.gov.br/sesu/arquivos/pdf/diretrizesreuni.pdf Accessed on: 2019 Jan. 26.
» http://portal.mec.gov.br/sesu/arquivos/pdf/diretrizesreuni.pdf - CASTRO, R. N. A. et al. Integração de processos avaliativos em uma instituição de ensino superior brasileira. Avaliação (Campinas) , Sorocaba, v. 23, n. 1, p. 58-74, 2018. https://doi.org/10.1590/s1414-40772018000100005
» https://doi.org/10.1590/s1414-40772018000100005 - CHARNES, A.; COOPER, W. W.; RHODES, E. Measuring the efficiency of decision making units. European Journal of Operational Research , Amsterdam, v. 2, n. 6, p. 429-444, Nov. 1978. https://doi.org/10.1016/0377-2217(78)90138-8
» https://doi.org/10.1016/0377-2217(78)90138-8 - DYSON, R. G. et al. Pitfalls and protocols in DEA. European Journal of Operational Research, Amsterdam, v. 132, n. 2, p. 245-259, July 2001. https://doi.org/10.1016/S0377-2217(00)00149-1
» https://doi.org/10.1016/S0377-2217(00)00149-1 - FELDMANN, T.; SOUZA, O. A governamentalidade e o Exame Nacional de Desempenho de Estudantes - ENADE. Avaliação (Campinas), Sorocaba, v. 21, n. 3, p. 1017-1032, ago./nov. 2016. https://doi.org/10.1590/S1414-40772016000300017
» https://doi.org/10.1590/S1414-40772016000300017 - GOMES JÚNIOR, S. F. Índice de eficiência não radial em DEA baseado em propriedades vetoriais . Tese (Doutorado em Engenharia e Produção) – Universidade Federal Fluminense, Rio de Janeiro, 2010.
- GUIRONNET, J. P.; PEYPOCH, N. The geographical efficiency of education and research: the ranking of U.S. universities. Socio-Economic Planning Sciences, New York, v. 62, p. 44-55, June 2018. https://doi.org/10.1016/j.seps.2017.07.003
» https://doi.org/10.1016/j.seps.2017.07.003 - INSTITUTO NACIONAL DE ESTUDOS E PESQUISAS EDUCACIONAIS ANÍSIO TEIXEIRA - INEP. Sinopse estatística da educação superior 2017. Brasília, DF, 2018. Available from: http://portal.inep.gov.br/web/guest/sinopses-estatisticas-da-educacao-superior Acessed on: 2019 Jan. 18.
» http://portal.inep.gov.br/web/guest/sinopses-estatisticas-da-educacao-superior - KATHARAKI, M.; KATHARAKIS, G. A comparative assessment of Greek universities’ efficiency using quantitative analysis. International Journal of Educational Research , Amsterdam, v. 49, n. 4-5, p. 115-128, Nov. 2010. https://doi.org/10.1016/j.ijer.2010.11.001
» https://doi.org/10.1016/j.ijer.2010.11.001 - LEITÃO, T. et al. Uma análise acerca do boicote dos estudantes aos exames de avaliação da educação superior. Revista Brasileira de Educação , Rio de Janeiro, v.15, n.43, p.21-43, jan./ar. 2010. https://doi.org/10.1590/S1413-24782010000100003
» https://doi.org/10.1590/S1413-24782010000100003 - LETA, F. R. et al. Métodos de melhora de ordenação em DEA aplicados à avaliação estática de tornos mecânicos. Investigação Operacional , Lisboa, v. 25, n. 2, p. 229-242, 2005.
- LIMA, P. S. N. et al. Análise de dados do Enade e Enem: uma revisão sistemática da literatura. Avaliação (Campinas), Sorocaba, v. 24, n. 1, p. 89-107, mar./maio 2019. https://doi.org/10.1590/s1414-40772019000100006
» https://doi.org/10.1590/s1414-40772019000100006 - PEREIRA, C. A.; ARAUJO, J. F. F. E.; MACHADO-TAYLOR, M. L. The Brazilian higher education evaluation model: “SINAES” sui generis? International Journal of Educational Development , London, v. 61, p. 5-15, July 2018. https://doi.org/10.1016/j.ijedudev.2017.11.007
» https://doi.org/10.1016/j.ijedudev.2017.11.007 - POLIDORI, M. M.; MARINHO-ARAUJO, C. M.; BARREYRO, G. B. SINAES: perspectivas e desafios na avaliação da educação superior brasileira. Ensaio: Avaliação e Políticas Públicas em Educação , Rio de Janeiro, v. 14, n. 53, p. 425-436, dez. 2006. https://doi.org/10.1590/S0104-40362006000400002
» https://doi.org/10.1590/S0104-40362006000400002 - SOARES DE MELLO, J. C. C. B.; LETA, F. R.; ANGULO-MEZA, L. DEA advanced models for geometric evaluation of used lathes. WSEAS Transactions on Systems , Wisconsin, v. 7, n. 5, p. 500-520, May 2008.
- TAVARES, R. S.; ANGULO-MEZA, L. Uso da análise envoltória de dados para a avaliação da eficiência em cursos de graduação: um estudo de caso em uma Instituição de Ensino Superior brasileira. Revista Espacios , v. 38, n. 20, p. 16, jan. 2017.
- UNIVERSIDADE FEDERAL FLUMINENCE – UFF. PDI - Plano de Desenvolvimento Institucional 2008-2012. Niterói, 2009. Available from: http://pdi.sites.uff.br/pdis-da-uff Acessed on 2019 Jan. 19.
» http://pdi.sites.uff.br/pdis-da-uff - VERHINE, R. E.; DANTAS, L. M. V.; SOARES, J. F. Do Provão ao ENADE: uma análise comparativa dos exames nacionais utilizados no Ensino Superior Brasileiro. Ensaio: Avaliação e Políticas Públicas em Educação , Rio de Janeiro, v. 14, n. 52, p. 291-310, set. 2006. https://doi.org/10.1590/S0104-40362006000300002
» https://doi.org/10.1590/S0104-40362006000300002 - YAMADA, Y.; MATSUI, T.; SUGIYAMA, M. An inefficiency measurement method for management systems. Journal of the Operations Research Society of Japan , v. 37, n. 2, p. 158-168, 1994. https://doi.org/10.15807/jorsj.37.158
» https://doi.org/10.15807/jorsj.37.158
Publication Dates
-
Publication in this collection
14 Sept 2020 -
Date of issue
Jan-Mar 2021
History
-
Received
11 Mar 2019 -
Accepted
30 June 2020

 Source: Adapted from Gomes Júnior (2010)
 Source: Adapted from Gomes Júnior (2010)
 Source: Authors (2019)
 Source: Authors (2019)
 Source: Authors (2019)
 Source: Authors (2019)