Abstracts
This paper deals with design of manufacturing cells and addresses the following issues: a) strategy and its importance in the context of manufacturing cells; b) use of STORM software for the design of manufacturing cells; c) discuss parameters related to performance measurements and propose some indexes for their measurement. Finally, it presents comments and results of the application of manufacturing cells in American industry.
manufacturing cells; strategy; performance measurement; software STORM; production flow analysis
Este artigo trata do projeto de células de manufatura e enfoca as seguintes questões: a) estratégia e sua importância no contexto de células de manufatura; b) uso do software STORM para o projeto de células de manufatura; c) discute parâmetros relacionados às medidas de desempenho e, são propostos alguns índices para estas medidas. Finalmente, apresenta-se comentários e resultados da aplicação de células de manufatura na indústria americana.
células de manufatura; estratégia; medida de desempenho; software STORM; análise do fluxo de produção
Design of manufacturing cells: strategy, software and performance measurement
Projeto de células de manufatura: estratégia, software e medida de desempenho
Antonio BatocchioI; Shahrukh Adi IraniII
IDepartamento de Engenharia de Fabricação. Faculdade de Engenharia Mecânica -UNICAMP, Caixa Postal 6122, 13.083-970, Campinas, SP, Brazil. Visiting Assistant Professor-IEOR Division. Department of Mechanical Engineering. University of Minnesota, USA
IIDepartment of Industrial, Welding and Systems Engineering. Ohio State University - 210 Baker Systems. 1971 Neil Avenue, Columbus, OH 43210-1271, USA
ABSTRACT
This paper deals with design of manufacturing cells and addresses the following issues: a) strategy and its importance in the context of manufacturing cells; b) use of STORM software for the design of manufacturing cells; c) discuss parameters related to performance measurements and propose some indexes for their measurement. Finally, it presents comments and results of the application of manufacturing cells in American industry.
Key-words: manufacturing cells, strategy, performance measurement, software STORM, production flow analysis.
RESUMO
Este artigo trata do projeto de células de manufatura e enfoca as seguintes questões: a) estratégia e sua importância no contexto de células de manufatura; b) uso do software STORM para o projeto de células de manufatura; c) discute parâmetros relacionados às medidas de desempenho e, são propostos alguns índices para estas medidas. Finalmente, apresenta-se comentários e resultados da aplicação de células de manufatura na indústria americana.
Palavras-chave: células de manufatura, estratégia, medida de desempenho, software STORM, análise do fluxo de produção
1. Introduction
Manufacturing cells have been one of the main solutions to several problems caused by change in the world context in manufacturing systems (BOE & CHENG, 1991; HARVEY, 1994). Some of these changes are: reduction in lot sizes, increase in the product variety, improvement of quality, cost reduction, market competition, flexibility, relationship with customers (for example, consumer's satisfaction), etc. Manufacturing systems need a quick answer to the changing market, due to the variety that the customers bring to the market. They can look for other alternatives in product, quality, time and cost.
Several researchers (CURRIE & CREESE, 1990; BURBIDGE, 1992; BURGESS et al., 1993; HARVEY, 1994) have reported the application of manufacturing cells to systems for manufacturing parts in medium and small-sized batches.
This paper presents important considerations related to the design of manufacturing cells: (a) the concept of strategy and parameters that need to be considered in manufacturing cells; (b) the use of the STORM software (EMMONS et al., 1992) for the design of manufacturing cells. It discusses the parameters that can help managers to define performance measurements, and proposes some indices for their measurement. Finally, it presents comments and general results on the application of manufacturing cells in the American industry.
2. One of the Key Issues: Strategy
Strategy can be generally defined as: "a particular plan for gaining success in a particular activity" (LONGMAN, 1992). If the owners think about a company or industry, they have their particular goals. The owners (or partners) want growth, and want to get positive results, such as: profit, increased demand, satisfied customers, high performance, winning the competition, etc. Good objectives are not the only guarantee of success for a company. They should have a way (or several ways) to achieve these objectives. The purpose needs to define its strategies. Therefore, it is more important to choose an adequate strategy, because the results will be a function of the chosen strategy. An incorrect choice will result in failure and the company will suffer financial losses.
A difficult question to answer is how to choose an adequate or better strategy that the company can adopt to achieve its goals. In a study made by NAIK & CHAKRAVARTY (1992) about strategic acquisition of new technology, they discussed four approaches, and several other models that were used by other authors for this purpose. They show in a table a summary of the four justification approaches: economic, analytic, strategic and integrated.
In NAIK & CHAKRAVARTY's (1992) visions, they are not satisfied with these models and, they present a new framework. This framework is divided into three hierarchical levels of evaluation: strategic, operational and financial. This shows that it is more difficult to have the best strategy, and there are a lot of parameters and information involved in this process to choose a strategy. Moreover, there is a dependence on the subjective judgment of a person (or group of persons) that will decide about adequate strategy which can be adopted by a company.
3. Strategy for the Design of Manufacturing Cells
The decision that a company can make for change in its manufacturing system must be based on several factors. The analysis of these factors, both internal and external, can support a decision to choose an adequate strategy. These factors also influence the behavior of the manufacturing system.
The outside factors are: customer service (satisfaction of the client), competition, product mix, volume, quality, price and cost, due date and delivery. The inside factors are: production facilities, flexibility, assembly, process, machine and equipment, setup, part's flow, lead time, cycle time, waiting time, quality, schedule, control and planning.
The outside factors help a company to face market and competitors; whereas, the inside factors help to select the most appropriate manufacturing system that will process parts or products. The problem is the selection and definition of a good model for strategy that considers both types of factors.
The best way to solve this problem will be to choose a model from the literature, and to make some changes in it. Authors cited before (NAIK & CHAKRAVARTY, 1992) present several models that can help as a first attempt in the search of new models for manufacturing strategy. At present, the authors of this paper are working in this direction, and they wish as soon as possible to have a new model to apply to manufacturing systems.
The changes in a manufacturing system are more complex, and they involve a lot of factors that can cause problems for a company. For example, if a company has a jobshop layout, and it decides to change to manufacturing cells, it will have a lot of problems to solve such as a new organizational structure, a new layout, employee's qualification (operators multi-function and with some new functions too: for example, leaders of cells), reduction in the numbers of operators, inspectors and supervisors, increase of the work in the support areas (for example, tools and fixtures: increase external setup, necessity of new project and standardization of tools and fixture), change in planning and control of production, new strategy for maintenance, etc.
In the context, it is necessary to make a plan which the changes will occur without fail. The following questions will be consider in this planning:
(i) To analyze the positive and negative points of actual structure and the potential of its employees.
(ii) To prepare some courses for employees that will develop new functions.
(iii) To prepare several meeting with all staff and to show the benefits of the change.
(iv) To define the flow of the new information, decision of the systems and, relationship between the areas.
(v) To create one committee that will have the function of solve the conflict between people or areas.
(vi) To make the design of manufacturing cells and the facilities that will be necessary to the new system.
(vii) To define the index of performance measurements of the new system (dynamic index).
(viii) To make budget and chronogram of the changes, and to define the evaluation system for all phases of the changes.
This plan will have success in its implementation only if participation and motivation of the employees for change occur. People will be involved and they could or could not cooperate in this process. There are known cases which the resistance of the people became changes in failure. They were afraid of the changes (or something new), and they did not try to work hard, so the changes could occur in the manufacturing system. HARVEY (1994) addresses these questions and explains: "in conducting this research I gained the impression that many single operators could be grouped together to form one multiple operator cell to take advantage of numerical flexibility (i.e. the ability to alter the number of workers in the cell). The possibility of losing pay or status combined to limit group work in cells. Most workers in the USA were reluctant to participate in group work if it meant an equalization of status with a worker who has less seniority. Even in multiple operator cells, the problems were many: peer pressure was used to oust substandard workers. Unions and managers turned a blind eye to this, suggesting that it was a social problem that they could do little about. Management was primarily concerned that the cell reached its productivity goals, and unions were most reluctant to go against their own members."
4. The Software STORM Applied in PFA
The objective of this item is to encourage the use of operations research models and computer software that has implemented them for rapid deployment of Production Flow Analysis-PFA (BURBIDGE, 1975) in companies. Some of the advantages of being able to implement PFA in a company using a computer package are: a) large data sets can be analyzed; b) what-if analyzes can be conducted quickly to adapt the results to specific situations in each company; c) the standardization of the results will allow easier dissemination of the results among interested companies; d) some sense of confidence can be associated with the computer-generated results, and e) the analyzes can be repeated in several other companies without requiring specially trained personnel.
IRANI & RAMAKRISHNAN (1995) have identified a set of easy-to-use models that have already been implemented through the use of an educational software such as the STORM package (EMMONS et al., 1992).
STORM is an integrated software package consisting of the most frequently used quantitative modeling techniques for business and engineering problems. It is menu driven for convenience and flexibility, and consists of: i) a flexible and easy-to-use Editor for data input and modification; ii) eighteen computational modules, and iii) a variety of user-selected outputs for displaying the results of computations. The mathematical models included in STORM are drawn from operations research/management science, operations management/industrial engineering, and statistics.
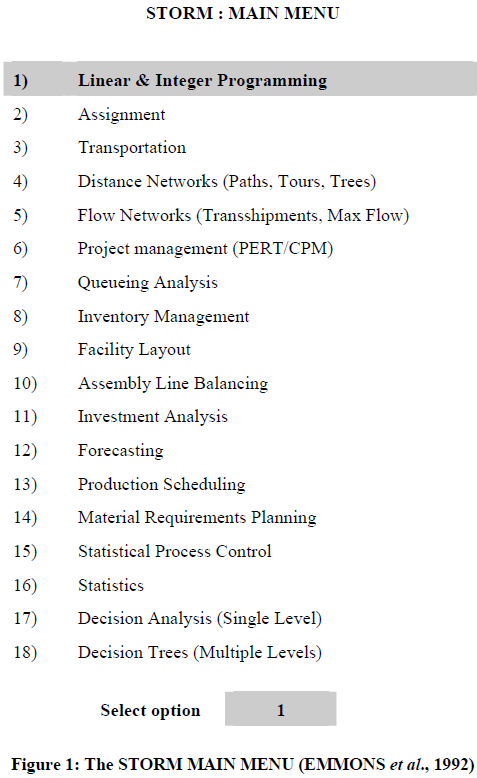
STORM provides a suite of modules for Linear Programming, Graph and Network Theory, Inventory Control, Facility Layout, Material Requirements Planning, Production Scheduling, etc. The STORM Main Menu allows you to select which of the computational procedures available in STORM you wish to use. It is shown in Figure 1 as it appears on your screen.
Even though the complete cell design problem cannot be solved by these modules in STORM, they are sufficient for performing a quick-and-dirty feasibility study for implementation of PFA in a small or medium-sized company. The use of the different relevant modules in STORM to partially computerize and analytically solve the first three stages in PFA has been described in this item.
a) Factory flow analysis with STORM
In PFA the detailed routes for each part are converted to process route number (PRN's) to capture the movement of the part between the different shops in the factory. BURBIDGE (1991) described the majors shops in a factory and listed the different PRN's and the number of parts that follow it. IRANI & RAMAKRISHNAN 1995) used these data, and made a Pareto analysis of these data. Using the FROM/TO chart generated from these data, the unidirectional sequence of the shops was generated using the Facility Layout module of STORM. They showed this information in several figures. These results obtained using STORM clearly demonstrate the feasibility of rapid and effective computer implementation of FFA in practice.
b) Group analysis with STORM
The foundation of group technology is the generation of machine groups and matchining part families from a 0-1 machine-part matrix. This is achieved by reordering the initial matrix by generating new machine and part permutations which would match the corresponding clusters in both dimensions in a Block Diagonal Form (BDF) (CHEN & IRANI, 1993). The permutations for the final matrix can be generate by solving the appropriate Linear Placement Problem (LPP) using the Facility Layout module in STORM.
The student version of STORM (manual included) retails for about $80 and the Facility Layout module can handle 50 machines and 50 parts. This version of STORM could be used to solve significantly large machine-part matrices by exploiting the concept of the "module" proposed by BURBIDGE (1991). The module is essentially a small machine-part matrix identified with the remaining parts in the machine usage list of a key machine type. Using the sorting techniques adopted by BURBIDGE to create the modules, the usually large number of parts will always be reduced to a small number of modules, a number which can never exceed the number of machine types in the shop. Hence, a 50x50 machine-module matrix representing a medium-sized machine shop could easily be solved using STORM to identify potential machine groups and part families. In fact, instead of purchasing the professional version of STORM which costs about $1000 and can handle 150 machines and 150 parts, a company could easily use-house programmers to implement this particular module. IRANI & RAMAKRISHNAN (1995) propose 18 steps for quick implementation of group analysis (GA) by a company using STORM, and they presented details of each step.
c) Line analysis with STORM
Having completed group analysis, the layout for each cell (line analysis-LA) must be planned. STORM has limited capacity for LA because it cannot account for machine shapes and sizes, non-linear cell layout shapes such as U or H or W (ARVINDH & IRANI, 1994), duplication of the same machine type at two or more locations within the cell and unequal material handling cost for forward vs. back vs. cross flow of parts in a non-linear layout shape (IRANI & RAMAKRISHNAN, 1995). However, having observed the simplicity of cell layout design techniques employed in industry (WRENNALL & LEE, 1994), the capabilities of STORM are sufficient for rough cut and rapid modeling purposes. In terms of data requirements for this stage, IRANI & RAMAKRISHNAN (1995) used: list of parts assigned to the cell, operation sequence and batch quantity for each part, list of machine types assigned to the cell, number of machines of each type assigned to the cell, and machines in other cells that one or more parts must visit.
However, in an actual industrial implementation, the shape and area requirements for each machine type and the infeasibility of relocating certain machines required by the cell within it must also be taken into consideration. In the example developed by IRANI & RAMAKRISHNAN (1995), the routing data for its family of parts was converted into a Travel Chart and, a single input and output station was assumed for each cell when entering the Travel Chart into the Facility Layout module of STORM. The layout generated for each cell by authors (IRANI & RAMAKRISHNAN, 1995) are shown in that paper.
d) Shop layout analysis with STORM
Having completed LA, the layout for the entire shop (shop layout analysis-SLA) showing the relative locations of the cells with respect to the equipment external to the cells that is in the same shop and the other shops must be planned. STORM has limited capacity for SLA, because it cannot account for the sizes and shapes of the cells, the boundary shape of the shop floor, locations of the input/output points for the individual cells, interactions between the shapes chosen for the cells and location constraints forced by the structure of the shop floor, the configuration of the network of material handling aisles connecting the cells, supply points for electricity or compressed air or gas, and other general considerations for facility layout design (IRANI & RAMAKRISHNAN, 1995).
In terms of data requirements for this stage, were used only the following data (IRANI & RAMAKRISHNAN, 1995): number of cells, list of parts involved in intercell flows, operation sequence and batch quantity for each of these parts, machine type required for each external operation and the cell in which that machine type occurs. To design the layout for the shop, a Travel Chart for intercell flows was input to STORM. Assuming a linear layout for the shop, the optimal layout for cells produced by STORM with the flow paths for each of the parts moving between the cells. For cases where a larger number of cells is involved, the following approach using the Distance Networks module STORM can be adopted: generate the initial asymmetric Travel Chart for the intercell flows; convert this chart into a symmetric Travel Chart for the total flow between any and every pair of cells; obtain the Maximum Spanning Tree (MST) from this data, using the Distance Networks module STORM.
5. Performance Measurements
5.1. Overview
Performance measurement is fundamental to the success of implementation of new manufacturing system. NYMAN (1992) shows that there are some basic assumption of performance measurements as: it should be derived from the business strategy; it must be hierarchical as well as horizontal; it must support the business multidimensional environment (internal and external effects). This author makes other considerations, and he names them as specific characteristics of performance measurements as:
(i) Should help measure progress toward controlling activity cost (overtime hours, machine downtime, rework, scrap, setup reduction, throughput time).
(ii) Must not be considered permanent (dynamic, because competitive businesses are flexible and rapidly changing).
(iii) Must be easy to understand (influence human behavior toward desired positive results).
(iv) Must have few in numbers (many numbers are more difficult to know one is the most important).
(v) Should be reported on a timely basis (to take an effective and correct action after to know the measurement).
(vi) Results must be clearly visible (changes will occur only when you see and understand the results).
(vii) Management must be committed to supporting (by all management levels).
(viii) Must be clearly linked to the employee evaluation process (employees should be evaluated in relation to the success they obtain in helping the company attain its goals).
In this specific case, when a company changes its manufacturing system to manufacturing cells system, NYMAN (1992) makes the following affirmative: "It is mandatory that companies that change their physical operations structure also change their performance management systems to fully support the physical change. For certain, the introduction of manufacturing cells techniques and philosophies into a traditional manufacturing company, and even the redesign of current manufacturing cell facilities, disrupts in place performance management systems. Performance management system changes should be documented in the original cell installation plan."
WILLEY & DALE (1977) present the result of survey made in 28 industries in UK which were using group technology or manufacturing cells. In this survey, they proposed and showed the results of 23 index of performance measurements and 11 other parameters of production. Some of these index are: average batch size, percentage scrap rate, proportion of orders delivered on time, average number of operations per component, relationship between value of annual sales per value of WIP, relationship between value of raw material stock per rate of buying raw materials, relationship between actual product lead-time through manufacturing areas per average total time spent on machines and equipment, relationship between number of manufacturing employees per number of inspectors.
KELLER & NOORI (1988) present one model for justifying investment in new technology acquisition based on the lot size. They presented a four-step solution procedure to the lot size reorder-point model and two specific cost functions: logarithmic and power cost functions. They present four case studies based on kind of demand (uniform and exponential) combined with two specific cost functions.
NYMAN (1992) reports an experience of major British manufacturer of aircraft wing components that developed a performance measurement system based on four levels: business, operations, shift and cell. Table 1 shows theses four levels, their measurement frequency and the factor that is monitored.
VISWANADHAM & NARAHARI (1992) consider eight performance measurements, which are indicative of their competitive status in the manufacturing world. These performance measurements are: manufacturing lead time, work-in-process, machine utilization, throughput time, capacity, flexibility, performability and quality ["To evaluate automated manufacturing systems (AMSs), we need combined measures of performance and reliability, called performability measures. The most important performability measures in the AMS context are related to throughput and manufacturing lead time since high productivity and low lead times are prime features determining the competitiveness of AMSs. Performability studies are of great interest in the AMS context also, since performability enables to quantify flexibility and competitiveness of a manufacturing systems" (VISWANADHAM et al, 1991)].
5.2. Performance Measurements Models
One important question that can be emphasized is an adequate choice of the index of performance measurement. The quantity of index is not important, but the quality of it, and an action or decision that results of its analysis. This way, we propose some performance measurements to apply in manufacturing cells. The indexes are relatively simple and this is an important aspect that was considered in their prepositions. When an index has a simple model, it is easily determined due to involvement for few parameters that are easily obtained. Another aspect relative to this model is that its analysis is very easy to be make.
The performance measurements will be proposed to consider their application in two levels: managerial level and operational level. In the first category, the indexes will be used mainly by managers, because they are based on cost relationship. The other index category will be used by supervisor and engineers, because they address production parameters only.
5.2.1. Managerial Indexes
The managerial indexes are based on relationship between inventory cost and product cost. Here, the authors will propose five managerial indexes that will be able to help in making decision about manufacturing performance.
a) Managerial Index of Inventory in Process (Rip)
It is a relationship between cost of inventory in process (Cinp) and product cost (Cpd) (or total product cost). It is showed in the following model:
Rip = Cinp / Cpd
where,
Cinp = Ni * Tmi * Cma * (1 + xtax)
and:
- Ni: total number of parts in process
- Tmi: total time of parts in process
- Cma: material cost
- xtax: daily tax
b) Managerial Index of Inventory in Stock (Ris)
It is a relationship between cost of inventory in stock (Csto) and product cost (Cpd) (or total product cost). It is showed in the following model:
Ris = Csto / Cpd
where,
Csto = Nj * Tsto * Cma * (1 + xtax)
and,
- Nj: total number of parts in stock
- Tsto: total stock time
c) Managerial Index of Scrap (Rsc)
It is a relationship between cost of scrap (Cscr) and product cost (Cpd) (or total product cost). It is showed in the following model:
Rsc = (Cscr + Cma) / Cpd
where,
Cscr = Nk * Cman * Tp
and,
Cman = Cmach + Cop + Ctool + Cfix
and,
- Nk: total number of parts scrap
- Tp: total manufacturing time
- Cman: total cost of manufacturing
- Cmach: machine cost
- Cop: operator cost
- Ctool: tools cost
- Cfix: fixture cost
d) Managerial Index of Rework (Rrw)
It is a relationship between cost of rework (Crew) and product cost (Cpd) (or total product cost). It is showed in the following model:
Rrw = Crew / Cpd
where,
Crew = Np * Cman * Tr
and,
- Np: total number of parts rework
- Tr: total rework time
e) Managerial Index of the Total Inventory (Rti)
It is the sum of the four indexes defined before, and it is showed in the following model:
Rti = (Rip + Ris + Rsc + Rrw)
and,
Rti = (Cinp + Csto + Cscw + Cma + Crew) /Cpd
The managerial index of the total inventory is a combination of performance measurement of the partial indexes. An analysis of sensibility of this index (Rti) shows that it has the same behavior of its partial indexes. Verify that, if any of the partial indexes increases it will also increase. An analysis of the inventory level (this is, inventory cost) shows that the worst situation for the manufacturing system occurs when Rti is higher than Rgoal, and Rgoal is a value defined by management. Otherwise, the adequated situation is when Rti is equal Rgoal or less than Rgoal. Then, the managerial index of the total inventory (Rti) and its partial indexes may always have small values, and this fact signifies low inventory level in shop floor.
5.2.2. Operational Indexes
An other issue that can be addressed is that a part of the numerator of each model proposed (item 5.2.1) is also an index of measurement. In this way, five new indexes can be proposed. These indexes will be named operational indexes and they will be used by analysis of inventory in shop floor level.
a) Operational Index of Inventory in Process (Oip)
It is the result between the number of parts in process and the total time of parts in process. It is showed in the following model:
Oip = Ni * Tmi
b) Operational Index of Inventory in Storage (Ois)
It is result between the number of parts in storage and the total storage time. It is showed in the following model:
Ois = Nj * Tstoj
c) Operational Index of Scrap (Osc)
It is result between the number of parts of scrap and the total scrap-manufacturing time these parts. It is showed in the following model:
Osc = Nk * Tsck
d) Operational Index of Rework (Orw)
It is result between the number of parts of rework and the total rework time these parts. It is showed in the following model:
Orw = Np * Trwp
e) Operational Index of Total Inventory (Oti)
It is sum of the four operational indexes defined before. It is showed in the following model:
Oti = Oip + Ois + Osc + Orw
and,
Oti = Ni * Tmi + Nj * Tstoj + Nk * Tsck + Np * Trwp
The operational indexes give the inventory level in shop floor. In the current context, a reduction (or an increase) of inventory is shown by partial indexes and the total indexes. Graph can be easily built weekly (or any period) and analyzed by production employees (operators or supervisor). Target can be defined for inventory level, and it is frequently checked with its value put in the graph.
BATOCCHIO & IRANI (1996) tested these models with hypothetical data, but unfortunately they could not test these models with real data. In the future, they will intend to apply these models in the industry. Also, they will analyze the results and will compare with others models of the literature.
6. Conclusion
This paper addressed the feasibility of rapid computer implementation of the first three stages of Production Flow Analysis, i.e.: factory flow analysis, group analysis and line analysis. Each of these stages is analogous to fundamental operations research problems for which effective solution algorithms are available in a commercial package such as STORM. This STORM package is adequate to apply in small and medium-sized companies for the design of manufacturing cells.
The introduction of manufacturing cell based on adequate strategy will bring advantages to a company. However, it is necessary to have good performance measurements for the system's evaluation.
These performance measurements can be general and specific, but it is important that after their analysis, one or more actions are made and it causes an improvement on the company's performance.
There are several indexes to the performance measurement, but there is an index that is based on cost analysis that allows a clearly analysis of the performance financial of the company. The managers are more sensitive when the results are measured in quantity of money. Therefore, the indexes presented in this paper can help the managers in their decisions. So it is important to have specific index, based on parameters that operators and other employees can use to improve the performance of the manufacturing system. The operational indexes are adequate to apply in shop floor level, and they be able to used by operators.
In workshops achieved with managers of American companies, they presented some information of their experiences with manufacturing cells system as: reduction of lead-time and setup, scrap and rework; improve of quality and simplification of part flow. Some of the industries reported the reduction of inventory, but they have not got formal models of performance measurements that allow to make this and other measurements.
The authors in this paper believe, in function of the tests made with hypothetical data, that the indexes of performance measurement proposed can help the managers and engineers to make good evaluations of the manufacturing cells system.
Acknowledgement
This research was supported by FAPESP - Fundação para o Amparo à Pesquisa do Estado de São Paulo (Brazilian Sponsor) - Brazil, and IEOR Division, Department of Mechanical Engineering, University of Minnesota, Minneapolis, MN 55455, USA.
- ARVINDH, B. & IRANI, S.A.: "Cell formation: the need for an integrated solution of the subproblems", International Journal of Production Research, vol.32, n.5, pp. 1197-1218, 1994.
- BATOCCHIO, A. & IRANI, S.A.: "Proposal for some indexes for performance measurement", Paper submitted to the International Journal of Flexible Manufacturing Systems, August, 1996.
- BOE, W.J. & CHENG, C.H.: " A close neighbour algorithm for designing cellular manufacturing systems". International Journal of Production Research, vol. 29, n.10, pp. 2097-2116, 1991.
- BURBIDGE, J.L.:The introduction of group technology Heinemman, London, 1975.
- BURBIDGE, J.L.: "Change to group technology: process organization is obsolete", International Journal of Production Research, vol.30, n.5, pp. 1209-1219, 1992.
- BURBIDGE, J.L.: "Production flow analysis for planning group technology", Journal of Operations Management, vol.10, n.1, pp. 5-27, 1991.
- BURGESS, A.G., MORGAN, I. & VOLLMANN, T.E.: "Cellular manufacturing: its impact on the total factory", International Journal of Production Research, vol.31, n.9, pp. 2059-2077, 1993.
- CHEN, C.Y. & IRANI, S.A.: "Cluster first-sequence last heuristics for generating block diagonal forms for a machine-part matrix", International Journal of Production Research, vol.31, n.11, pp. 2623-2647, 1993.
- CURRIE, K.R. & CREESE, R.C.: "Justification of cellular manufacturing using multi-attribute part family loading - MAPFLO", Justification Methods for Computer Integrated Manufacturing Systems: Planning, Design, Justification and Costing, Elsevier Science Publishers B.V., pp. 203-219,1990.
- EMMONS, H. et al.:STORM Personal Version 3.0: Quantitative Modelling for decision Support, Prentice Hall/Allyn & Bacon. Englewood, Cliffs, New Jersey, 1992.
- HARVEY, N.: "Socio-technical organization of cell manufacturing and production islands in the metal manufacturing industry in Germany and the USA", International Journal of Production Research, vol.32, n.11, pp. 2669-2681, 1994.
- IRANI, S.A. & RAMAKRISHNAN, R.: "Production flow analysis using STORM", Planning, Design, and Analysis of Cellular Manufacturing Systems, A.K. Kamrani et al (editors). Elsevier Science B.V., 299-349, 1995.
- KELLER, G. & NOORI, H.: "Justifying new technology acquisition through its impact on the cost of running an inventory policy", IIE Transactions, vol.20, n.3, pp. 284-291, 1988.
- LONGMAN Dictionary of Contemporary English,. LONGMAN, England, 1992.
- NAIK, B. & CHAKRAVARTY, A.K.: "Strategic acquisition of new manufacturing technology: a review and research framework", International Journal of Production Research, vol.30, n.7, pp. 1575-1601, 1992.
- NYMAN, L.R. (editor):Making Manufacturing Cells Work, Society of Manufacturing Engineering (SME) & Computer and Automated System Association (CASA), Dearborn-Michigan., 1992.
- VISWANADHAM et al.: "Performability of Automated Manufacturing Systems", Control and Dynamic Systems, vol.47, pp. 77-120, 1991
- VISWANADHAM, N. & NARAHARI, Y.:Performance Modeling of Automated Manufacturing Systems, Prentice Hall, New Jersey, 1992.
- WILLEY, P.C.T. & DALE, B.G.: "Manufacturing characteristics and management performance of companies under group technology". Proceeding of 18th MATADOR, pp. 777-792, 1977.
- WRENNALL, W. & LEE, Q.:Handbook of commercial and industrial facilities management, McGraw-Hill Company, New York, USA, 1994.
Publication Dates
-
Publication in this collection
01 June 2010 -
Date of issue
Dec 1996