Abstract:
Identification and hierarchy of risks in inventory management allow mapping and generating a plan of actions in order to control them, diminish them or even extinguish them. This research aims to identify and measure the degree of importance of the main problems encountered in the sector of a metal production chain. The method used to develop this research is the Analytic Hierarchy Process (AHP), in order to hierarchize and thus defines the best way to manage risks. The main results of this study reveal that each area of the organization presents a risk that stands out in the management of inventories, allowing the company to control its expenses better, aligning itself with the companies' strategy of producing at the lowest cost. Excess consumption (demand), supplier delay (supply), and stock divergence (material handling) were highlighted as the major risks in their categories. This study revealed that in the category of demand risks, excess consumption was identified as the most critical risk, in the supply category, the supplier delay was identified at the highest risk and finally in the material handling category, the risk divergence of inventory obtained the highest percentage in relation to the other problems.
Keywords:
Risks; Analytic hierarchy process; Risk management
Resumo:
A identificação e hierarquização dos riscos na gestão de estoque permite mapear e gerar um plano de ações a fim de controlá-los, diminuí-los ou até mesmo extingui-los. Esta pesquisa tem como objetivo identificar e mensurar o grau de importância dos principais problemas encontrados no setor de uma cadeia produtiva do metal. O método utilizado para o desenvolvimento desta pesquisa é o AHP (Analitic Hierarchy Process), a fim de hierarquizar e assim definir a melhor forma de gerenciar os riscos. Os principais resultados deste estudo revelam que cada área da organização apresenta um risco que se destaca na gestão de estoques, permitindo a empresa controlar melhor seus gastos alinhando-se a estratégia das empresas de produzir ao menor custo. O excesso de consumo (demanda), atraso de fornecedor (fornecimento) e divergência de estoque (manuseio de materiais) foram destacados como os principais riscos em suas categorias. O estudo revelou que na categoria de riscos de demanda, o excesso de consumo foi apontado como o risco mais crítico, na categoria de fornecimento, o atraso de fornecedor foi identificado como o risco mais alto e finalmente na categoria de manuseio de material, o risco divergência de estoque obteve o maior percentual em relação aos outros problemas.
Palavras-chave:
Riscos; Analitic hierarchy process; Gestão de riscos
1 Introduction
Present in most organizations, inventory management when efficient can help the company achieve its goals at low cost and leverage profits (Sanchez-Rodrigues et al., 2010Sanchez-Rodrigues, V., Potter, A., & Naim, M. M. (2010). Evaluating the causes of uncertainty in logistics operations. International Journal of Logistics Management, 21(1), 45-64. http://dx.doi.org/10.1108/09574091011042179.
http://dx.doi.org/10.1108/09574091011042...
). Correct development of a stock policy will define when, how much and what to order, as well as how to define what to keep in stock (Ching, 1999Ching, H. Y. (1999). Gestão de estoques na cadeia de suprimentos. São Paulo: Atlas.). Stock out costs as well as the excess of materials in stock is harmful and are problems that directly influence your expenses as well as your revenues.
As it is essential to fulfill the logistics function, inventory management is classified as primary, because depending on the active market to which the company belongs, it will be necessary to analyze the levels of inventory to cushion the impacts between supply and demand (Ching, 1999Ching, H. Y. (1999). Gestão de estoques na cadeia de suprimentos. São Paulo: Atlas.).
Due to problems in inventory management, companies need to map possible inventory-related risks so that each is systematically addressed to address or effectively manage inventory (Chang et al., 2015Chang, W., Ellinger, A. E., & Blackhurst, J. (2015). A contextual approach to supply chain risk mitigation. International Journal of Logistics Management, 26(3), 642-656. http://dx.doi.org/10.1108/IJLM-02-2014-0026.
http://dx.doi.org/10.1108/IJLM-02-2014-0...
).
Thus, in order to gain a better understanding of the factors leading to the occurrence of a specific risk and at the same time to provide information on their impact, a risk assessment is carried out so that risks can be avoided or reduce the effect of its consequences through contingency strategies (Zsidisin et al., 2004Zsidisin, G. A., Ellram, L. M., Carter, J. R., & Cavinato, J. L. (2004). An analysis of supply risk assessment techniques. International Journal of Physical Distribution & Logistics Management, 34(5), 397-413. http://dx.doi.org/10.1108/09600030410545445.
http://dx.doi.org/10.1108/09600030410545...
).
The risk assessment permits clear understanding of the most important risks, whether in an organization or in a supply chain, providing opportunity for them to be placed on a priority scale. In order for the evaluation process to be effective, this phase should be simple and, in an appropriate way, show where, when and with what probability they can occur (Hallikas et al., 2002Hallikas, J., Virolainen, V. M., & Tuominen, M. (2002). Risk analysis and assessment in network environments: a dyadic case study. International Journal of Production Economics, 78(1), 45-55. http://dx.doi.org/10.1016/S0925-5273(01)00098-6
http://dx.doi.org/10.1016/S0925-5273(01)...
; Harland et al., 2003Harland, C., Brenchley, R., & Walker, H. (2003). Risk in supply networks. Journal of Purchasing and Supply Management, 9(2), 51-62. http://dx.doi.org/10.1016/S1478-4092(03)00004-9.
http://dx.doi.org/10.1016/S1478-4092(03)...
; Manuj & Mentzer, 2008Manuj, I., & Mentzer, J. T. (2008). Global supply chain risk management strategies. International Journal of Physical Distribution & Logistics Management, 38(3), 192-223. http://dx.doi.org/10.1108/09600030810866986.
http://dx.doi.org/10.1108/09600030810866...
; Matook et al., 2009Matook, S., Lasch, R., & Tamaschke, R. (2009). Supplier development with benchmarking as part of a comprehensive supplier risk management framework. International Journal of Operations & Production Management, 29(3), 241-267. http://dx.doi.org/10.1108/01443570910938989.
http://dx.doi.org/10.1108/01443570910938...
; Ritchie & Brindley, 2007Ritchie, B., & Brindley, C. (2007). Supply chain risk management and performance: a guiding framework for future development. International Journal of Operations & Production Management, 27(3), 303-322. http://dx.doi.org/10.1108/01443570710725563.
http://dx.doi.org/10.1108/01443570710725...
; Tomas & Alcantara, 2013Tomas, R. N., & Alcantara, R. L. C. (2013). Modelos para gestão de riscos em cadeias de suprimentos: revisão, análise e diretrizes para futuras pesquisas. Gestão & Produção, 20(3), 695-712. http://dx.doi.org/10.1590/S0104-530X2013000300014.
http://dx.doi.org/10.1590/S0104-530X2013...
).
Given the information, this research has the objective of identifying the main risks and their respective degrees of importance in the stock sector of a company in the aluminum production chain.
The remainder of this paper is organized as follows. In Section 2 we present the risks in inventory management and the AHP. Section 3 shows the case study. In Section 4 describes the proposed risk assessment using the AHP. Finally, Section 5 is devoted to the conclusions of the paper and directions to the future researches.
2 Risks in inventory management
Stokes can be considered as the strategic sum of raw materials, semi-finished products, components for manufacturing and assembly, finished products, office supplies and other supplies that have the role of supporting the flow of administrative activities whether organizational or industrial. Poor management of inventory can directly affect product availability and, consequently, the company's sales (Sanchez-Rodrigues et al., 2010Sanchez-Rodrigues, V., Potter, A., & Naim, M. M. (2010). Evaluating the causes of uncertainty in logistics operations. International Journal of Logistics Management, 21(1), 45-64. http://dx.doi.org/10.1108/09574091011042179.
http://dx.doi.org/10.1108/09574091011042...
).
As Chopra & Meindl (2004Chopra, S., & Meindl, P. (2004). Gerenciamento da cadeia de suprimentos: estratégia, planejamento e operação. In S. Chopra & P. Meindl. Gerenciamento da cadeia de suprimentos: estratégia, planejamento e operação. Nova Jersey: Pearson Prentice Hall., p. 49) point out, economically managing stocks consists in the search for rationality and equilibrium with consumption, so that in the first place the effective needs of its consumers are met with minimum cost and less risk of lack possible.
Treatment applied to good inventory management aims to strategically manage inventory risks (Fernandes et al., 2015Fernandes, F. C., Wrubel, F., & Dallabona, L. F. (2015). Gerenciamento de riscos na cadeia de suprimentos de micro e pequenas empresas têxteis: discussão exploratória sobre oportunidades de pesquisa. REGEPE-Revista de Empreendedorismo e Gestão de Pequenas Empresas, 4(1), 125-151. http://dx.doi.org/10.14211/regepe.v4i1.172.
http://dx.doi.org/10.14211/regepe.v4i1.1...
). As the Committee of Sponsoring Organizations of Treadway Commission points out, risk management represents the process conducted in an organization by the board of directors, board of directors and other employees, applied in establishing strategies, formulated to identify potential events throughout the organization capable of affecting it and managing the risks (Manuj & Mentzer, 2008Manuj, I., & Mentzer, J. T. (2008). Global supply chain risk management strategies. International Journal of Physical Distribution & Logistics Management, 38(3), 192-223. http://dx.doi.org/10.1108/09600030810866986.
http://dx.doi.org/10.1108/09600030810866...
).
Supply chain risks are more frequent and visible due to the operational complexity that has become present in the scope of supply, increasing the size and risk of rupture in the flow of products as well as services (Silva et al., 2008Silva, A. L. B., Ladeira, M. B., & Oliveira, M. D. (2008). A aplicação do modelo de redes bayesianas para o Gerenciamento de risco de ruptura em cadeias de suprimento. In Anais do XI Simpósio de Administração da Produção, Logística e Operações Internacionais. São Paulo: FGV-EAESP.; Cavinato, 2004Cavinato, J. L. (2004). Supply chain logistics risks: from the back room to the board room. International Journal of Physical Distribution & Logistics Management, 34(5), 383-387. http://dx.doi.org/10.1108/09600030410545427.
http://dx.doi.org/10.1108/09600030410545...
; Ghadge et al., 2012Ghadge, A., Dani, S., & Kalawsky, R. (2012). Supply chain risk management: present and future scope. International Journal of Logistics Management, 23(3), 313-339. http://dx.doi.org/10.1108/09574091211289200.
http://dx.doi.org/10.1108/09574091211289...
).
Each category is associated with events that result in inventory disruption and the respective negative impacts generated, according to Figure 1.

The Supply Risk Model. Source: DRK Research and Consulting (2007)DRK Research and Consulting. (2007). Supply risk assessment process. Retrieved in 2018, September 21, from http://www.drkresearch.org/
http://www.drkresearch.org/... .
Given the presented, sources of the risks are not mutually exclusive, and the occurrence of one may imply the occurrence of another (Jereb et al., 2013Jereb, B., Ivanusa, T., & Rosi, B. (2013). Systemic thinking and requisite holism in mastering logistics risks: the model for identifying risks in organisations and supply chain. Amfiteatru Economic, 15(33), 56.). In this way, supply chain can be vulnerable to ruptures and failures, requiring management to minimize the likelihood of risks (Tomas & Alcantara, 2013Tomas, R. N., & Alcantara, R. L. C. (2013). Modelos para gestão de riscos em cadeias de suprimentos: revisão, análise e diretrizes para futuras pesquisas. Gestão & Produção, 20(3), 695-712. http://dx.doi.org/10.1590/S0104-530X2013000300014.
http://dx.doi.org/10.1590/S0104-530X2013...
).
Different approaches are found in the literature (Harland et al., 2003Harland, C., Brenchley, R., & Walker, H. (2003). Risk in supply networks. Journal of Purchasing and Supply Management, 9(2), 51-62. http://dx.doi.org/10.1016/S1478-4092(03)00004-9.
http://dx.doi.org/10.1016/S1478-4092(03)...
; Kleindorfer & Saad, 2005Kleindorfer, P. R., & Saad, G. H. (2005). Managing disruption risks in supply chains. Production and Operations Management, 14(1), 53-68. http://dx.doi.org/10.1111/j.1937-5956.2005.tb00009.x.
http://dx.doi.org/10.1111/j.1937-5956.20...
; Peck, 2005Peck, H. (2005). Drivers of supply chain vulnerability: an integrated framework. International Journal of Physical Distribution & Logistics Management, 36(4), 210-232. http://dx.doi.org/10.1108/09600030510599904.
http://dx.doi.org/10.1108/09600030510599...
; Tummala & Schoenherr, 2011Tummala, R., & Schoenherr, T. (2011). Assessing and managing risks using the Supply Chain Risk Management Process (SCRMP). Supply Chain Management, 16(6), 474-483. http://dx.doi.org/10.1108/13598541111171165.
http://dx.doi.org/10.1108/13598541111171...
; Handfield & McCormack, 2007Handfield, R., & McCormack, K. P. (2007). Supply chain risk management: minimizing disruptions in global sourcing. New York: Taylor & Francis. http://dx.doi.org/10.1201/9781420013306.
http://dx.doi.org/10.1201/9781420013306...
) to manage risks in an organization and / or supply chain. According to Tomas & Alcantara (2013)Tomas, R. N., & Alcantara, R. L. C. (2013). Modelos para gestão de riscos em cadeias de suprimentos: revisão, análise e diretrizes para futuras pesquisas. Gestão & Produção, 20(3), 695-712. http://dx.doi.org/10.1590/S0104-530X2013000300014.
http://dx.doi.org/10.1590/S0104-530X2013...
, in general, these risk management models consider that four steps to be taken are: risk identification, risk assessment, risk control and risk monitoring and assessment of the impact of risk mitigation.
Risk identification is the first step in a risk management model. In it are carried out the activities of surveying the sources of risks with their characterization. The process of risk management is initiated with the identification of risks. The identification is intended to discover all the relevant risks in the organization or chain being studied. In this way, an early assessment is necessary to determine whether a risk should be considered relevant, and therefore continue to be assessed, or not (Zsidisin & Ritchie, 2009Zsidisin, G. A., & Ritchie, B. (2009). Supply chain risk management - developments, issues and challenges. In G. A. Zsidisin & B. Ritchie (Eds.), Supply chain risk - a handbook of assessment, management and performance. New York. Springer. http://dx.doi.org/10.1007/978-0-387-79934-6_1.
http://dx.doi.org/10.1007/978-0-387-7993...
).
Next step, called risk assessment, is to select the most important risks and assess the impact of these risks in terms of occurrence and consequences potential (Zsidisin & Ritchie, 2009Zsidisin, G. A., & Ritchie, B. (2009). Supply chain risk management - developments, issues and challenges. In G. A. Zsidisin & B. Ritchie (Eds.), Supply chain risk - a handbook of assessment, management and performance. New York. Springer. http://dx.doi.org/10.1007/978-0-387-79934-6_1.
http://dx.doi.org/10.1007/978-0-387-7993...
). To these activities, Rice & Cainato (2003)Rice, B., & Cainato, F. (2003). Building a secure and resilient supply network. Supply Chain Management Review, 7(5), 22-30. add that it is necessary to estimate the probability of occurrence of each risk, as well as to evaluate the potential losses.
In addition, the risk assessment step allows crisp understanding of the most relevant risks in an organization or chain, providing opportunity for them to be allocated in order of priority. In order for this evaluation process to be effective, this step should be simple (Hallikas et al., 2002Hallikas, J., Virolainen, V. M., & Tuominen, M. (2002). Risk analysis and assessment in network environments: a dyadic case study. International Journal of Production Economics, 78(1), 45-55. http://dx.doi.org/10.1016/S0925-5273(01)00098-6
http://dx.doi.org/10.1016/S0925-5273(01)...
; Manuj & Mentzer, 2008Manuj, I., & Mentzer, J. T. (2008). Global supply chain risk management strategies. International Journal of Physical Distribution & Logistics Management, 38(3), 192-223. http://dx.doi.org/10.1108/09600030810866986.
http://dx.doi.org/10.1108/09600030810866...
; Ritchie & Brindley, 2007Ritchie, B., & Brindley, C. (2007). Supply chain risk management and performance: a guiding framework for future development. International Journal of Operations & Production Management, 27(3), 303-322. http://dx.doi.org/10.1108/01443570710725563.
http://dx.doi.org/10.1108/01443570710725...
).
Risk control stage seeks to institute suggestions (Zsidisin & Ritchie, 2009Zsidisin, G. A., & Ritchie, B. (2009). Supply chain risk management - developments, issues and challenges. In G. A. Zsidisin & B. Ritchie (Eds.), Supply chain risk - a handbook of assessment, management and performance. New York. Springer. http://dx.doi.org/10.1007/978-0-387-79934-6_1.
http://dx.doi.org/10.1007/978-0-387-7993...
) or strategies (Rice & Cainato, 2003Rice, B., & Cainato, F. (2003). Building a secure and resilient supply network. Supply Chain Management Review, 7(5), 22-30.) for risk mitigation. Mitigation activities use the data collected at the risk assessment stage to deal with potential risks with appropriate actions. This includes mitigation strategies as well as contingency plans (Manuj & Mentzer, 2008Manuj, I., & Mentzer, J. T. (2008). Global supply chain risk management strategies. International Journal of Physical Distribution & Logistics Management, 38(3), 192-223. http://dx.doi.org/10.1108/09600030810866986.
http://dx.doi.org/10.1108/09600030810866...
).
The stage of risk monitoring and assessment of the impact of risk mitigation on performance results (Zsidisin & Ritchie, 2009Zsidisin, G. A., & Ritchie, B. (2009). Supply chain risk management - developments, issues and challenges. In G. A. Zsidisin & B. Ritchie (Eds.), Supply chain risk - a handbook of assessment, management and performance. New York. Springer. http://dx.doi.org/10.1007/978-0-387-79934-6_1.
http://dx.doi.org/10.1007/978-0-387-7993...
) is the last stage of risk management. Regarding monitoring, Mullai (2009)Mullai, A. Risk management system: a conceptual model. (2009). In G. A. Zsidisin & Ritchie, B. (Eds.), Supply chain risk: a handbook of assessment, management and performance. New York: Springer. http://dx.doi.org/10.1007/978-0-387-79934-6_6.
http://dx.doi.org/10.1007/978-0-387-7993...
emphasizes two alternative measures: 1) effectiveness, which is the effect of suppression or mitigation of risks as a consequence of the actions proposed in the stage of risk control; and 2) efficiency of the suggested propositions, and can be measured by the financial loss (if action was not taken) in relation to the financial expense avoided by the retention of risk.
2.1 AHP – Analytic Hierarchy Process
The Analytic Hierarchy Process (AHP) has been used in the evaluation of supply chain risks by promoting greater consistency in the classification of risk factors (Gaudenzi & Borghesi, 2006Gaudenzi, B., & Borghesi, A. (2006). Managing risks in the supply chain using the AHP method. International Journal of Logistics Management, 17(1), 114-136. http://dx.doi.org/10.1108/09574090610663464.
http://dx.doi.org/10.1108/09574090610663...
; Guimarães et al., 2015Guimarães, L. G. A., Carmona, C. U. D. M., Guimarães Júnior, F. R. F., & Nodari, C. H. (2015). Modelo de análise de riscos logísticos em tríade de empresas. Revista ESPACIOS, 36(24),16.; Karakaya & Karakaya, 2017Karakaya, E., & Karakaya, G. (2017) Developing a risk management framework and risk assessment for non-profit organizations: a case study. In H. Dinçer & Ü. Hacioğlu (Eds.), Risk management, strategic thinking and leadership in the financial services industry. Contributions to management science. Cham: Springer. http://dx.doi.org/10.1007/978-3-319-47172-3_20.
http://dx.doi.org/10.1007/978-3-319-4717...
; Osorio Gómez et al., 2017Osorio Gómez, J. C., Manotas Duque, D. F., Rivera, L., & García-Alcaraz, J. L. (2017) Decision support system for operational risk management in supply chain with 3PL providers. In G. Alor-Hernández & Valencia-García R. (Eds.), Current trends on knowledge-based systems. Intelligent systems reference library (Vol. 120). Cham: Springer. http://dx.doi.org/10.1007/978-3-319-51905-0_10.
http://dx.doi.org/10.1007/978-3-319-5190...
; Sharma & Pratap, 2013Sharma, S., & Pratap, R. (2013). A case study of risks optimization using Ahp method. International Journal of Scientific and Research Publications, 3(10)).
AHP method was developed by Saaty in the mid-1970s. The acronym AHP incorporates its characteristics, which are especially directed at overcoming the cognitive limitations of decision makers. The method is characterized by its simplicity and robustness, allowing its application to develop in several areas: manufacturing process, logistics, bioenergy, construction, etc. (Ho et Ma, 2017Ho, W., & Ma, X. (2017). The state-of-the-art integrations and applications of the analytic hierarchy process. European Journal of Operational Research, Wang et al., 2014Wang, J. Q., Zhang, Z. T., Chen, J., Guo, Y. Z., Wang, S., Sun, S. D., Qu, T., & Huang, G. Q. (2014). The TOC-based algorithm for solving multiple constraint re- sources: A re-examination. IEEE Transactions on Engineering Management, 61(1), 138-146. http://dx.doi.org/10.1109/TEM.2013.2264830.
http://dx.doi.org/10.1109/TEM.2013.22648...
, Yeo et al., 2010Yeo, G. T., Song, D. W., Dinwoodie, J., & Roe, M. (2010). Weighting the competitive- ness factors for container ports under conflicting interests. The Journal of the Operational Research Society, 61(8), 1249-1257. http://dx.doi.org/10.1057/jors.2009.88.
http://dx.doi.org/10.1057/jors.2009.88...
; Scott et al., 2015Scott, J. A., Ho, W., Dey, P. K., & Talluri, S. (2015). A decision support system for supplier selection and order allocation in stochastic, multi-stakeholder and multi-criteria environments. International Journal of Production Economics, 166, 226-237. http://dx.doi.org/10.1016/j.ijpe.2014.11.008.
http://dx.doi.org/10.1016/j.ijpe.2014.11...
; Rabelo et al., 2007Rabelo, L., Eskandari, H., Shaalan, T., & Helal, M. (2007). Value chain analysis using hybrid simulation and AHP. International Journal of Production Economics, 105(2), 536-547. http://dx.doi.org/10.1016/j.ijpe.2006.05.011.
http://dx.doi.org/10.1016/j.ijpe.2006.05...
).
Characterized as a support tool, the application of AHP in decision problems is done in two phases: the construction of the hierarchy and the evaluation in which the first phase involves the structuring of the problem in levels and AHP allows decision makers to model of complex problems in a hierarchical structure (Kim et al., 2014Kim, M., Hong, K. S., & Lee, C. (2014). Analysis of the risks of overseas advancement by logistics companies applying AHP. In J. Park, I. Stojmenovic, M. Choi & F. Xhafa (Eds.), Future information technology (pp. 391-398). Berlin, Heidelberg: Springer. http://dx.doi.org/10.1007/978-3-642-40861-8_55.
http://dx.doi.org/10.1007/978-3-642-4086...
; Chan et al., 2006Chan, F. T., Chan, H. K., Lau, H. C., & Ip, R. W. (2006). An AHP approach in benchmarking logistics performance of the postal industry. Benchmarking, 13(6), 636-661. http://dx.doi.org/10.1108/14635770610709031.
http://dx.doi.org/10.1108/14635770610709...
). In order to decide in an organized way and generate consistent priorities, following steps should be followed (Saaty, 1987Saaty, T. L. (1987). Risk—its priority and probability: the analytic hierarchy process. Risk Analysis, 7(2), 159-172. http://dx.doi.org/10.1111/j.1539-6924.1987.tb00980.x.
http://dx.doi.org/10.1111/j.1539-6924.19...
; Saaty, nineteen ninety; Saaty, 1991Saaty, T. L. (1991). Método de análise hierárquica (Tradução e revisão técnica Wainer da Silveira e Silva). São Paulo: Makron Books.; Saaty, 2008Saaty, T. L. (2008). Decision making with the analytic hierarchy process. International Journal of Services Sciences, 1(1), 83-98. http://dx.doi.org/10.1504/IJSSCI.2008.017590.
http://dx.doi.org/10.1504/IJSSCI.2008.01...
):
1. Define the problem and determine the type of knowledge sought; 2. Decomposition of the problem: researching, dividing and structuring the problem forming a hierarchy. Hierarchy forms a structure that allows visualizing the problem in terms of objectives, criteria and alternatives; 3. Construct a matrix of judgments between the pairs of criteria and another matrix of judgments for the considered alternatives. Each element of the upper level is used in the comparison of the elements immediately below it; 4. From the matrix of judgments will be obtained the values of the priorities for each criterion and for each alternative.
Analysis is initiated by assessing the importance of the criteria, following the Saaty Fundamental Scale (Table 1) comparing how much one element is more dominant than the other. The decision maker should be able to make comparisons and make their choices according to their preferences. The intensity of these preferences should satisfy the reciprocal condition: If A is X times more preferred than B, then B is times of A preference (Nunes Junior, 2006Nunes Junior, L. F. (2006). Tomada de decisão com múltiplos critérios: pesquisa-ação sobre o método AHP em pequenas empresas (Dissertação de mestrado). Universidade de Taubaté, Taubaté.).
Then, the matrix of judgments is normalized by dividing each element of the matrix (Aij) by the sum total of the values of the respective column in the judgment matrix.
The normalized eigenvector (w) is calculated using the line means of the normalized matrix elements, it is responsible for determining the importance of each criterion. The maximum eigenvalue (λmax) is calculated by multiplying the matrix of judgments A by the vector of priorities W, followed by the division of this new vector, Aw, by the first vector w, reaching the value of λmax (Saaty, 1990Saaty, T. L. (1990). How to make a decision: the analytic hierarchy process. European Journal of Operational Research, 48(1), 9-26. http://dx.doi.org/10.1016/0377-2217(90)90057-I.
http://dx.doi.org/10.1016/0377-2217(90)9...
; Saaty, 2003Saaty, T. L. (2003). Decision-making with the AHP: why is the principal eigenvector necessary. European Journal of Operational Research, 145(1), 85-91. http://dx.doi.org/10.1016/S0377-2217(02)00227-8.
http://dx.doi.org/10.1016/S0377-2217(02)...
).
It is noteworthy that Aw = λ we, that in the hierarchical analysis, Aw = λmax w. Calculation of λ max, Equation 1 below is used:
Procedures for calculating the Consistency Index (CI) and Consistency Ratio (CR) are presented in Equations 2 and 3
With:
CI = Consistency Index
λ max = Maximum eigenvalue
n = Matrix size
With:
CR = Consistency Ratio
CI = Consistency Index
n = Matrix size
CR calculation indicates the consistency of the two-to-two evaluations carried out in the judgment matrix. The lower the index, the greater the consistency. In order to reach CR, it is enough to divide the CI by the Average Random Index. The Average Random Index is a constant whose value will depend on the size of the matrix being analyzed. Table 2 presents the Average Random Index of AHP method for different values of n (matrix size). As a general rule, if the consistency index (CI) is less than 0.1, then there is consistency to proceed with the AHP calculations (Guimarães et al., 2015Guimarães, L. G. A., Carmona, C. U. D. M., Guimarães Júnior, F. R. F., & Nodari, C. H. (2015). Modelo de análise de riscos logísticos em tríade de empresas. Revista ESPACIOS, 36(24),16.).
3 Case study
The company studied is a subsidiary of a multinational present in eleven countries, a precursor in the aluminum industry in 1988 and a world leader in the production of primary aluminum, processed aluminum and alumina. The subsidiary studied, Itapissuma unit, is located 35 kilometers from the capital of Pernambuco.
Data used to identify the risks were the experience and the perception of the employees of the warehouse sector. At the first moment, brainstorming was carried out to identify the main risks inherent in inventory management, then each participating employee made the hierarchy of risks according to their probability of occurrence using a form considering the financial risk / problem in stock management, in order to categorize the causes relating to the problems experienced in the day-to-day. At the end, it was suggested that suggestions be filled out if they were identified.
Risks were grouped in relation to the criteria of the categories and identified 12 (twelve) risks inherent to the inventory management in order to map and treat them. To facilitate analysis and understanding, they were divided into three categories of performance. In the first one, the risks inherent in the demand for the material, in the second, the risks involved in supplying the items and finally in the third one, where the risks were measured, are related to the handling of the material inside the warehouse, as shown in Table 3.
After identifying the risks related to stock management and its categorization, two experienced analysts were interviewed in order to rank the risks through AHP method. The first analyst, who specialized in purchasing planning, answered about demand risks and the second analyst specialized in receiving and receiving the warehouse responded to the risks of supply and risks of material handling. Both analyzed and answered the question: which of the criteria is more important and stronger? They expressed according to Table 4.
Analysis began with the A4x4 matrix, where the criteria are compared to each other. For example, by comparing the criterion “Surplus Stock” with itself, the value of the judgment is it A33 is equal to 1, since the criteria have the same dominance with each other.
4 Proposed risk assessment using the AHP method
After brainstorming, twelve risks inherent to inventory management were identified: excess consumption, control of perishable materials, surplus stock, outdated parameters, stock obsolescence, supplier delay, nonconformity resolution time, reference change / update, inventory divergence, lack of items / shelf tagging, undue confirmation / cancellation of requisitions, and nonconforming stock material. The following are details of each identified risk:
-
Excess consumption - unexpected changes in day-to-day manufacturing end up generating excess consumption of many items, not only of inputs, but often in the consumption of spare parts, during the performance of preventive maintenance, for example, the maintenance ends up finding some problems at the moment that some sub-parts of the machines open and the need arises to change all the parts because of some unexpected anomaly.
-
Control of Perishable Materials - the current system does not allow perishable materials to be managed by the due date. Then, an Excel spreadsheet tracking job is done to prevent material from being overdue and at the time of need cannot be used.
-
Excess inventory - variations in demand may cause shortage of materials as well as surplus stocks may occur, as they end up generating incorrect consumption prospects, this is the case with materials linked to production, such as packaging, since each type of product has packaging and depending on the order backlog the quantities will vary. When demand declines, stocks become surplus.
-
Outdated parameters - failure to revise inventory parameters or even sudden change in material consumption can leave minimum and maximum inventories outdated.
-
Stock obsolescence - when a product ceases to be useful, even when it is in perfect working order.
-
Supplier delay - the supplier delivers after the stipulated deadline.
-
Nonconformity resolution time - when the time taken to resolve a non-compliance exceeds the expected time.
-
Reference change / update - being a very large company and already over 30 years old, and so part of the old machinery, many items undergo change / change of reference, as it is not possible to receive anything out of specification, it is necessary consult the user of the material to evaluate if the change in the registration of the item can be made.
-
Inventory divergence - happens when the amount of material is different than the one entered in the system, which can be higher or lower.
-
Lack of labeling on items / shelf - although not frequently occurring, this problem can cause considerable financial impact, since a material can be shipped incorrectly and cause production to be damaged.
-
Incorrect confirmation / cancellation of requisitions - undue confirmations or cancellations of requisitions may occur which may lead to divergences of stock. When the attendant or user checks the error, for undue confirmations a return of the material is made and for the cancellations, the users redo the requisition of the material upon the request of the service of the warehouse. Errors when not immediately verified are detected by the cyclic inventory.
-
Inventory nonconformity - some factors contribute to this risk, among them is the low turnover of items made from some materials that react with the weather or even some damage caused in the handling, but only perceived at the time of use.
From this identification, a questionnaire was applied to identify the frequency. The nine employees of the warehouse were instructed to assess the frequency of risks according to their own day-to-day perceptions, as shown in Table 5.
For employees, the most frequent risks were, the supplier's delay with the average of 4.1, second, the excess of consumption with 3.9 of average and, thirdly, the time of resolution of non-compliance with the average of 3.4. It was noticed during the application of the questionnaire that depending on the area of action of some employees, they were not able to accurately answer the frequency of some risks. From this observation, it was noted that it would be necessary to create a more effective way to assess and prioritize the risks of Inventory Management. To facilitate the analysis, the risks were grouped into three categories referring to the areas of activity, according to Table 3.
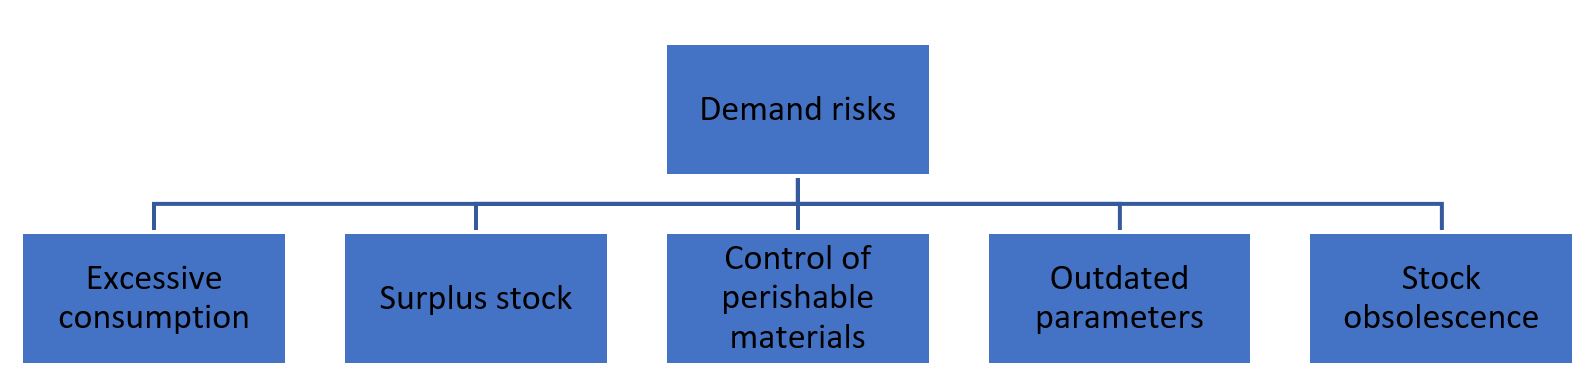
After the initial analyzes, Analytic Hierarchy Process (AHP) was used to evaluate the identified risks. For the category of demand risks, the procurement officer responsible for the planning of the inputs of the warehouse was interviewed, and consequently, more accurate evaluations. The demand risks have been divided as shown in Figure 2 in order to hierarchize them.

The company analyst of the company investigated the risks using the AHP method, based on the fundamental scale of Saaty, according to Table 1. Risk hierarchization was performed through the construction of a judgment matrix as shown in Table 6.
In the next step, the judgment matrix was normalized in order to match all the criteria to the same unit, so the matrix value is divided by the total of its respective column, for example, column A12 is equal to 9, to find the normalized value is only divided by the total of the column, in case, divide by 13, then we will find the result 0.69. Table 7 shows the complete normalized judgment matrix.
Using the judgment matrix, the Consistency Index (CI) was calculated, as well as the consistency ratio, according to Table 6. The random index used was 1.12, since the Matrix of Risk inherent to the stock demand has n equal to 5, as shown in Table 2.
To calculate the normalized eigenvector (w) it is necessary to add the averages of the lines of the elements of the normalized matrix. The relative importance of each criterion is determined by the eigenvector.
Table 8 shows the result of the consistency ratio of this category had a value of 0.05. Since the value of the judgment consistency condition is that the CR is less than 0.10 the hierarchy is adequate with the consistency index and the Consistency Ratio values.
It is verified in Figure 3 that in the company in question, the greatest perceived risk in inventory management is the excess consumption, with 62% incidence, this is a difficult risk to manage and very frequently, since the instability of consumption it makes it difficult to predict the demands of material to be programed, as a countermeasure, once the inventory is broken, the planning of purchases consults the user by e-mail to know if the demand was punctual or if the consumption will increase. If so, immediately the stock parameters are changed, and a schedule is made to supply the need of the user area.

Secondly, in hierarchy, there is a surplus stock that also derives from the oscillations of stock demands. And it has as a countermeasure an analysis of the items monthly, where the highest values are evaluated verifying the demand and the reasons for the increase of the stock and finally decisions are made regarding the surplus stocks, for example, they can be transferred to other units of the productive chain of the aluminum or may have future schedules postponed or canceled.
In the other categories, the analyst of Acquisition & Logistics of the Warehouse also made the analyzes by AHP method. In the category Supply Risks, three types of risks were identified, according to Figure 4.

The analyst specialized in receiving and receiving the warehouse related risks using AHP method, based on the Saaty fundamental scale, as shown in Table 1. Risk hierarchization was performed through the construction of a judgment matrix as shown in Table 9.
In the second step, the judgment matrix was normalized in order to match all the criteria to the same unit, so the value of the matrix is divided by the total of its respective column, such as column A11 is equal to 1, to find the normalized value is only divided by the total of the column, in case, divide by 1.36, then we will find the result 0.73. Table10 shows the complete normalized judgment matrix.
Using the judgment matrix, the Consistency Index (CI) was calculated, as well as the consistency ratio, according to Table 2. The random index used was 0.58, since the risk assessment matrix inherent to the stock demand has n equal to 3, as shown in Table 11.
Result of the consistency ratio of this category had a value of 0.06. To achieve the value of the judgment consistency condition, the CR must be less than 0.10 so that the hierarchy is considered adequate with the consistency index and the Consistency Ratio values.
In Supply Risks category, it is possible to verify that in Figure 5, that in the company, the delay of the supplier is a problem that hinders the management of inventories and that can cause other problems / risks. It has as countermeasures a follow-up team that verifies if the deadlines agreed with the suppliers at the time of the negotiation will be met, if the material has already been invoiced, this team follows the arrival of the product until the final receipt. Another monitoring is to monitor absences daily by analyzing the cause of the stock out, at the end of the month if the number of absences is higher than the service target, an analysis of the main causes is made, and a plan of action is created to be worked with suppliers, all with the participation of buyers responsible for the contracts.

The second-highest risk category was the Nonconformity Resolution Time. As a countermeasure, we have an indicator to follow the Non-Conformities of the month that has the purpose of intervening in cases more difficult to solve.
In the Manual Handling Risks category four types of risks were identified:
Figure 6 shows that Material Handling Risks category contains 4 sub criteria, where the service analyst / Receipt of the metal chain production chain related the risks using the AHP method, based on the Saaty fundamental scale, as shown in Table 1. Risk hierarchization was performed through the construction of a judgment matrix according to Table 12.

In the second step, the judgment matrix was normalized in order to match all the criteria to the same unit, so the matrix value is divided by the total of its respective column, for example, column A11 equals 1, to find the normalized value is only divided by the total of the column, in case, divide by 1.56, then we will find the result 0.64. Table13 shows the complete normalized judgment matrix.
Result of the consistency ratio of this category had a value of 0.098, as shown in Table 14. To achieve the value of the judgment consistency condition, the CR must be less than 0.10 so that the hierarchy is considered adequate with the consistency index and the Consistency Ratio values.
In the Material Handling Risks category, we can verify that in Figure 7, that in the company surveyed, the stock divergence represents 60% of the risk, this problem happens when the quantity of material is different from the one informed in the system, or for less. The countermeasure the company adopted was to use the cyclical inventory where the process is divided into inventory of items and shelf inventory, the rule is to inventory 100% of the items in the year, however, items A are inventoried three times a year due to financial value, items B are inventoried twice a year and C items once a year.

Secondly, the nonconforming material appears with 21%, it is not always possible to detect this problem, but when identified, the material is segregated and evaluated by the user area. As long as the reuse is not possible, the item is downloaded from the stock and sold as scrap and as needed a new purchase is made.
By analyzing the above calculations, we can verify that the excess of consumption (Demand), delay of suppliers (Supply) and Divergence of stock (Material handling) were highlighted as the main risks in their categories. Analyzing Table 13, inventory frequency risk surveys and comparing with the results obtained in AHP analysis by categories, it was verified that results were very similar as observed in the Table 15.
It was verified that the analysis made according to the staff of the warehouse was very consistent with the results. Regarding the main causes for the supply of categories delay the supplier was the first risk with greater frequency index, excess consumption that was second in the overall analysis, but checking by category, was also the first of demand categories and lastly in the Handling category, although it ranked fifth overall, ranked first when analyzed by categories.
5 Conclusions
This study aimed at identifying and measuring the degree of importance of the main problems encountered in the inventory sector of the aluminum production chain in a company in Pernambuco, in order to identify failures, avoid wastage and prevent errors, that is, to offer management healthy and reliable materials.
In this research, emphasis was placed on the first two steps (risk identification and assessment) in risk management in the organization. In addition, an initial part of the third stage was carried out through suggestions for mitigation activities and contingency plans, which support the third stage of risk management in the company.
From the treatment of the data acquired in the brainstorming and questionnaire applied to the employees of the warehouse were identified the main risks / problems occurred in the day to day. Twelve risks were identified: excess of consumption, control of perishable materials, surplus stock, outdated parameters, inventory obsolescence, supplier delay, nonconformity resolution time, reference change / update, stock divergence, lack of item labeling / shelf, undue confirmation / cancellation of requisitions and nonconforming material in stock. These risks were divided into categories, forming three groups: demand risks, supply risks and material handling risks.
As a sequence of research strategy, a risk hierarchy model was elaborated, which is based on the hierarchy of risk criteria inherent to stock management subdivided into categories and later analyzed through AHP method carried out by the employees of the company studied. Finally, results of the research are presented, from risk categorization, hierarchy, measurement and presentation of the risk assessment model inherent to stock management. In addition, suggestions were made for each assessed risk. They can then be used posteriori in the stage of risk control by the organization.
Moreover, our results have revealed that in the category of demand risks, excess consumption was identified as the most critical risk, in the supply category, the supplier delay was identified as the highest risk and finally in the material handling category, the risk stock divergence obtained the highest percentage relative to the other problems.
As a recommendation for future work, we suggest an inventory management analysis based on the use of new technological tools, such as sensors, application of the Internet of Things techniques, and electronic labels, observing the frank growth of the use of the internet and business virtualization in order to better manage inventory risks.
-
Financial support: None.
-
How to cite: Sales, A. C. M., Guimarães, L G. A., Veiga Neto, A. R., El-Aouar, W. A., & Pereira, G. R. (2020). Risk assessment model in inventory management using the AHP method. Gestão & Produção, 27(3), e4537. https://doi.org/10.1590/0104-530X4537-20
References
- Cavinato, J. L. (2004). Supply chain logistics risks: from the back room to the board room. International Journal of Physical Distribution & Logistics Management, 34(5), 383-387. http://dx.doi.org/10.1108/09600030410545427
» http://dx.doi.org/10.1108/09600030410545427 - Chan, F. T., Chan, H. K., Lau, H. C., & Ip, R. W. (2006). An AHP approach in benchmarking logistics performance of the postal industry. Benchmarking, 13(6), 636-661. http://dx.doi.org/10.1108/14635770610709031
» http://dx.doi.org/10.1108/14635770610709031 - Chang, W., Ellinger, A. E., & Blackhurst, J. (2015). A contextual approach to supply chain risk mitigation. International Journal of Logistics Management, 26(3), 642-656. http://dx.doi.org/10.1108/IJLM-02-2014-0026
» http://dx.doi.org/10.1108/IJLM-02-2014-0026 - Ching, H. Y. (1999). Gestão de estoques na cadeia de suprimentos São Paulo: Atlas.
- Chopra, S., & Meindl, P. (2004). Gerenciamento da cadeia de suprimentos: estratégia, planejamento e operação. In S. Chopra & P. Meindl. Gerenciamento da cadeia de suprimentos: estratégia, planejamento e operação Nova Jersey: Pearson Prentice Hall.
- DRK Research and Consulting. (2007). Supply risk assessment process Retrieved in 2018, September 21, from http://www.drkresearch.org/
» http://www.drkresearch.org/ - Fernandes, F. C., Wrubel, F., & Dallabona, L. F. (2015). Gerenciamento de riscos na cadeia de suprimentos de micro e pequenas empresas têxteis: discussão exploratória sobre oportunidades de pesquisa. REGEPE-Revista de Empreendedorismo e Gestão de Pequenas Empresas, 4(1), 125-151. http://dx.doi.org/10.14211/regepe.v4i1.172
» http://dx.doi.org/10.14211/regepe.v4i1.172 - Gaudenzi, B., & Borghesi, A. (2006). Managing risks in the supply chain using the AHP method. International Journal of Logistics Management, 17(1), 114-136. http://dx.doi.org/10.1108/09574090610663464
» http://dx.doi.org/10.1108/09574090610663464 - Ghadge, A., Dani, S., & Kalawsky, R. (2012). Supply chain risk management: present and future scope. International Journal of Logistics Management, 23(3), 313-339. http://dx.doi.org/10.1108/09574091211289200
» http://dx.doi.org/10.1108/09574091211289200 - Guimarães, L. G. A., Carmona, C. U. D. M., Guimarães Júnior, F. R. F., & Nodari, C. H. (2015). Modelo de análise de riscos logísticos em tríade de empresas. Revista ESPACIOS, 36(24),16.
- Hallikas, J., Virolainen, V. M., & Tuominen, M. (2002). Risk analysis and assessment in network environments: a dyadic case study. International Journal of Production Economics, 78(1), 45-55. http://dx.doi.org/10.1016/S0925-5273(01)00098-6
» http://dx.doi.org/10.1016/S0925-5273(01)00098-6 - Handfield, R., & McCormack, K. P. (2007). Supply chain risk management: minimizing disruptions in global sourcing New York: Taylor & Francis. http://dx.doi.org/10.1201/9781420013306
» http://dx.doi.org/10.1201/9781420013306 - Harland, C., Brenchley, R., & Walker, H. (2003). Risk in supply networks. Journal of Purchasing and Supply Management, 9(2), 51-62. http://dx.doi.org/10.1016/S1478-4092(03)00004-9
» http://dx.doi.org/10.1016/S1478-4092(03)00004-9 - Ho, W., & Ma, X. (2017). The state-of-the-art integrations and applications of the analytic hierarchy process. European Journal of Operational Research
- Jereb, B., Ivanusa, T., & Rosi, B. (2013). Systemic thinking and requisite holism in mastering logistics risks: the model for identifying risks in organisations and supply chain. Amfiteatru Economic, 15(33), 56.
- Karakaya, E., & Karakaya, G. (2017) Developing a risk management framework and risk assessment for non-profit organizations: a case study. In H. Dinçer & Ü. Hacioğlu (Eds.), Risk management, strategic thinking and leadership in the financial services industry. Contributions to management science Cham: Springer. http://dx.doi.org/10.1007/978-3-319-47172-3_20
» http://dx.doi.org/10.1007/978-3-319-47172-3_20 - Kim, M., Hong, K. S., & Lee, C. (2014). Analysis of the risks of overseas advancement by logistics companies applying AHP. In J. Park, I. Stojmenovic, M. Choi & F. Xhafa (Eds.), Future information technology (pp. 391-398). Berlin, Heidelberg: Springer. http://dx.doi.org/10.1007/978-3-642-40861-8_55
» http://dx.doi.org/10.1007/978-3-642-40861-8_55 - Kleindorfer, P. R., & Saad, G. H. (2005). Managing disruption risks in supply chains. Production and Operations Management, 14(1), 53-68. http://dx.doi.org/10.1111/j.1937-5956.2005.tb00009.x
» http://dx.doi.org/10.1111/j.1937-5956.2005.tb00009.x - Manuj, I., & Mentzer, J. T. (2008). Global supply chain risk management strategies. International Journal of Physical Distribution & Logistics Management, 38(3), 192-223. http://dx.doi.org/10.1108/09600030810866986
» http://dx.doi.org/10.1108/09600030810866986 - Matook, S., Lasch, R., & Tamaschke, R. (2009). Supplier development with benchmarking as part of a comprehensive supplier risk management framework. International Journal of Operations & Production Management, 29(3), 241-267. http://dx.doi.org/10.1108/01443570910938989
» http://dx.doi.org/10.1108/01443570910938989 - Mullai, A. Risk management system: a conceptual model. (2009). In G. A. Zsidisin & Ritchie, B. (Eds.), Supply chain risk: a handbook of assessment, management and performance New York: Springer. http://dx.doi.org/10.1007/978-0-387-79934-6_6
» http://dx.doi.org/10.1007/978-0-387-79934-6_6 - Nunes Junior, L. F. (2006). Tomada de decisão com múltiplos critérios: pesquisa-ação sobre o método AHP em pequenas empresas (Dissertação de mestrado). Universidade de Taubaté, Taubaté.
- Osorio Gómez, J. C., Manotas Duque, D. F., Rivera, L., & García-Alcaraz, J. L. (2017) Decision support system for operational risk management in supply chain with 3PL providers. In G. Alor-Hernández & Valencia-García R. (Eds.), Current trends on knowledge-based systems. Intelligent systems reference library (Vol. 120). Cham: Springer. http://dx.doi.org/10.1007/978-3-319-51905-0_10
» http://dx.doi.org/10.1007/978-3-319-51905-0_10 - Peck, H. (2005). Drivers of supply chain vulnerability: an integrated framework. International Journal of Physical Distribution & Logistics Management, 36(4), 210-232. http://dx.doi.org/10.1108/09600030510599904
» http://dx.doi.org/10.1108/09600030510599904 - Rabelo, L., Eskandari, H., Shaalan, T., & Helal, M. (2007). Value chain analysis using hybrid simulation and AHP. International Journal of Production Economics, 105(2), 536-547. http://dx.doi.org/10.1016/j.ijpe.2006.05.011
» http://dx.doi.org/10.1016/j.ijpe.2006.05.011 - Rice, B., & Cainato, F. (2003). Building a secure and resilient supply network. Supply Chain Management Review, 7(5), 22-30.
- Ritchie, B., & Brindley, C. (2007). Supply chain risk management and performance: a guiding framework for future development. International Journal of Operations & Production Management, 27(3), 303-322. http://dx.doi.org/10.1108/01443570710725563
» http://dx.doi.org/10.1108/01443570710725563 - Saaty, T. L. (1987). Risk—its priority and probability: the analytic hierarchy process. Risk Analysis, 7(2), 159-172. http://dx.doi.org/10.1111/j.1539-6924.1987.tb00980.x
» http://dx.doi.org/10.1111/j.1539-6924.1987.tb00980.x - Saaty, T. L. (1990). How to make a decision: the analytic hierarchy process. European Journal of Operational Research, 48(1), 9-26. http://dx.doi.org/10.1016/0377-2217(90)90057-I
» http://dx.doi.org/10.1016/0377-2217(90)90057-I - Saaty, T. L. (1991). Método de análise hierárquica (Tradução e revisão técnica Wainer da Silveira e Silva). São Paulo: Makron Books.
- Saaty, T. L. (2003). Decision-making with the AHP: why is the principal eigenvector necessary. European Journal of Operational Research, 145(1), 85-91. http://dx.doi.org/10.1016/S0377-2217(02)00227-8
» http://dx.doi.org/10.1016/S0377-2217(02)00227-8 - Saaty, T. L. (2008). Decision making with the analytic hierarchy process. International Journal of Services Sciences, 1(1), 83-98. http://dx.doi.org/10.1504/IJSSCI.2008.017590
» http://dx.doi.org/10.1504/IJSSCI.2008.017590 - Sanchez-Rodrigues, V., Potter, A., & Naim, M. M. (2010). Evaluating the causes of uncertainty in logistics operations. International Journal of Logistics Management, 21(1), 45-64. http://dx.doi.org/10.1108/09574091011042179
» http://dx.doi.org/10.1108/09574091011042179 - Scott, J. A., Ho, W., Dey, P. K., & Talluri, S. (2015). A decision support system for supplier selection and order allocation in stochastic, multi-stakeholder and multi-criteria environments. International Journal of Production Economics, 166, 226-237. http://dx.doi.org/10.1016/j.ijpe.2014.11.008
» http://dx.doi.org/10.1016/j.ijpe.2014.11.008 - Sharma, S., & Pratap, R. (2013). A case study of risks optimization using Ahp method. International Journal of Scientific and Research Publications, 3(10)
- Silva, A. L. B., Ladeira, M. B., & Oliveira, M. D. (2008). A aplicação do modelo de redes bayesianas para o Gerenciamento de risco de ruptura em cadeias de suprimento. In Anais do XI Simpósio de Administração da Produção, Logística e Operações Internacionais São Paulo: FGV-EAESP.
- Tomas, R. N., & Alcantara, R. L. C. (2013). Modelos para gestão de riscos em cadeias de suprimentos: revisão, análise e diretrizes para futuras pesquisas. Gestão & Produção, 20(3), 695-712. http://dx.doi.org/10.1590/S0104-530X2013000300014
» http://dx.doi.org/10.1590/S0104-530X2013000300014 - Tummala, R., & Schoenherr, T. (2011). Assessing and managing risks using the Supply Chain Risk Management Process (SCRMP). Supply Chain Management, 16(6), 474-483. http://dx.doi.org/10.1108/13598541111171165
» http://dx.doi.org/10.1108/13598541111171165 - Wang, J. Q., Zhang, Z. T., Chen, J., Guo, Y. Z., Wang, S., Sun, S. D., Qu, T., & Huang, G. Q. (2014). The TOC-based algorithm for solving multiple constraint re- sources: A re-examination. IEEE Transactions on Engineering Management, 61(1), 138-146. http://dx.doi.org/10.1109/TEM.2013.2264830
» http://dx.doi.org/10.1109/TEM.2013.2264830 - Yeo, G. T., Song, D. W., Dinwoodie, J., & Roe, M. (2010). Weighting the competitive- ness factors for container ports under conflicting interests. The Journal of the Operational Research Society, 61(8), 1249-1257. http://dx.doi.org/10.1057/jors.2009.88
» http://dx.doi.org/10.1057/jors.2009.88 - Zsidisin, G. A., & Ritchie, B. (2009). Supply chain risk management - developments, issues and challenges. In G. A. Zsidisin & B. Ritchie (Eds.), Supply chain risk - a handbook of assessment, management and performance New York. Springer. http://dx.doi.org/10.1007/978-0-387-79934-6_1
» http://dx.doi.org/10.1007/978-0-387-79934-6_1 - Zsidisin, G. A., Ellram, L. M., Carter, J. R., & Cavinato, J. L. (2004). An analysis of supply risk assessment techniques. International Journal of Physical Distribution & Logistics Management, 34(5), 397-413. http://dx.doi.org/10.1108/09600030410545445
» http://dx.doi.org/10.1108/09600030410545445
Publication Dates
-
Publication in this collection
15 June 2020 -
Date of issue
2020
History
-
Received
06 Mar 2018 -
Accepted
12 Sept 2018