Abstract
Several topics were analyzed to produce this article, such as Evaluation Engineering, Data Modeling, Data Mining and Big Data. Although the literature on these theories is extensive, there is no record of their simultaneous use in favor of conducting an analysis of the real estate market in a city or region. The present work aims to use these theories to elaborate and implement quantitative criteria which group real estate projects according to their sale speed in order to classify them as high or low demand in the market. Thus, a database was used to develop the proposal, containing the number of units sold from 268 real estate developments in Goiânia with a launch date between January 2016 to December 2019, recorded month by month, generating a total of 4746 entries in the database. Data Mining and Big Data techniques were used to determine the database to perform the research and enable direct comparison between the analyzed enterprises. It was possible to accurately define the greatest market opportunities by studying the characteristics of the number of bedrooms, private square footage, price per square meter, apartment price and location.
Keywords:
Real Estate Market; Data mining; Big data
Resumo
Apesar da literatura a respeito das teorias sobre Engenharia de Avaliações, Modelagem de Dados, Data Mining e Big Data ser vasta, não há registro de seu uso simultâneo na realização de uma análise de mercado imobiliário de uma cidade ou região. Diante disto, o presente trabalho tem por objetivo de analisar os fatores que influenciam na velocidade de venda de empreendimentos residenciais em Goiânia e Aparecida de Goiânia, classificar estes empreendimentos de acordo com sua aceitação pelo mercado e mapear quais as principais características presentes nos empreendimentos de maior sucesso na região. Para o desenvolvimento da proposta foi utilizado um banco de dados, contendo o número de unidades vendidas de 268 empreendimentos imobiliários de Goiânia, com data de lançamento entre janeiro de 2016 a dezembro de 2018, contabilizadas mês a mês, gerando um total de 4746 entradas no banco de dados. Para a realização da pesquisa foram utilizadas técnicas de Data Mining e Big Data para apurar o banco de dados e possibilitar a comparação direta entre os empreendimentos analisados. Como resultados, foi possível definir as maiores oportunidades de mercado estudando as características de número de dormitórios, metragem quadrada privativa, preço do metro quadrado, preço do apartamento e localização. Dentre as variáveis estudadas, a localização, número de dormitórios, valor por unidade, metragem quadrada privativa e preço por metro quadrado têm grande influência na recepção do imóvel pelo mercado. Já a data de lançamento do imóvel não tem grande relevância no sucesso de vendas do empreendimento.
Palavras-chave:
Mercado imobiliário; Data mining; Big Data
1 Introduction
Market analysis is an essential activity to help reduce risk when launching new real estate developments. However, the launch is often carried out based on simplified or subjective criteria defined by the companies (González & Formoso, 2008González, M. A. S., & Formoso, C. T. (2008). Construção de modelos do mercado imobiliário para análise de viabilidade com regressão e sistemas de regras difusas. Ambiente Construído, 6(4), 19-31.). Identifying which factors influence the price and sale of real estate is a way to understand market behavior.
In the task of selecting the best projects to be launched, the company must identify the characteristics which most influence the customer’s decision when purchasing a project, the price range, location, apartment standard, among other aspects. The data required is often accessible to companies operating in any industry, requiring only proper analytics.
Data on companies, the individual characteristics of buildings and the number of units sold are generally available from associations of companies operating in the real estate sector. These organizations use databases to organize the information provided. In turn, managers of member companies analyze the database in order to identify market trends in order to make better management decisions.
With so many companies operating in the market, many projects are launched in a short period of time. Identifying the factors which influence the price and speed of sales becomes essential for understanding the real estate sector in the region and creating sales strategies.
The real estate market dynamics must additionally be considered, in which the behavior variability of the real estate market over time is sensitive to the volatility of a country’s economic and social system or to global economic changes that may occur. Given this, these factors pose difficulties in being able to traditionally and statically analyze how the approaches focused on estimating the property value and its static covariates over time have been.
Thus, more static analyzes can lead to greater uncertainty about the forecasts of trends in the fundamental real estate market for entrepreneurs in the construction industry. A more dynamic analysis such as the liquidity of a property can lead to better understanding of the behavior and forecasts of real estate market trends. However, measuring the liquidity of a property is complex and requires longitudinal data consolidated within Big Data.
However, some difficulties arise with implementing big data. The size of the information collected continuously creates unique computational and statistical challenges, including the data reception and storage, the accumulation of “noisy data” (non-significant data), the occurrence of spurious correlations, accidental endogeneity and measurement errors (Fan et al., 2014Fan, J., Han, F., & Liu, H. (2014). Challenges of Big Data analysis. National Science Review, 1(2), 293-314. http://dx.doi.org/10.1093/nsr/nwt032. PMid:25419469.
http://dx.doi.org/10.1093/nsr/nwt032...
). Thus, new approaches and new methods or techniques of quantitative analysis are required.
One of the processes which help to solve this problem is Data Mining (DM). It consists of filtering and treating large databases, extracting data considered important and relevant which present value to the interested party, and in turn transforming what was filtered into information which was generally unknown (Cai et al., 2016Cai, F., Le-Khac, N.-A., & Kechadi, T. (2016). An integrated classification model for financial data mining. New York: arXiv.). This often results in a significantly smaller database, but with very high information quality.
The justification for developing this work lies in the need for entrepreneurs in the construction industry to follow the real estate market dynamics in the region, which brings a discussion about the most sought characteristics by the market in residential projects. In addition, being able to identify trends in the dynamic behavior of the market considering liquidity aspects.
Given this need, this work aims to develop and implement quantitative criteria which classify real estate projects as high and low demand by the market in order to group them according to their sales speed and to identify in an exploratory way which characteristics are often present in prominent developments, such as location, private area, price per square meter and number of bedrooms.
It is also intended to find opportunities for companies to invest in the real estate market in the Goiânia region, meaning to find characteristics of properties which are most sought after by the city’s consumer market, but are little explored by local builders and developers.
Given the above, the present work is structured as follows: first, the theoretical framework will be presented in which a systematic literature review was applied to analyze the real estate market, Big Data and Data Mining. Second, the method applied in this work is presented. Third, the main results and discussion about the work performed are presented.
2 Theoretical reference
The real estate market (or defined as the housing market by other authors) is of paramount importance for the economic system, for the generation of jobs and work income, as well as for the housing product which is of social importance, and constitutes a key sector of the economy in any country (Dantas, 2003Dantas, R. A. (2003). Modelos espaciais aplicadas ao mercado habitacional um estudo de caso para cidade do Recife (Tese de doutorado). Universidade Federal de Pernambuco, Recife. Retrieved in 2021, June 15, from https://repositorio.ufpe.br/handle/123456789/3833
https://repositorio.ufpe.br/handle/12345...
). In this sense, understanding housing demand must not only be considered in analyzing the real estate market for the civil construction sector, but also for urban or regional planning (Dantas, 2003Dantas, R. A. (2003). Modelos espaciais aplicadas ao mercado habitacional um estudo de caso para cidade do Recife (Tese de doutorado). Universidade Federal de Pernambuco, Recife. Retrieved in 2021, June 15, from https://repositorio.ufpe.br/handle/123456789/3833
https://repositorio.ufpe.br/handle/12345...
; Nunes et al., 2019Nunes, D. B., Barros, J., No., & Freitas, S. M. (2019). Modelo de regressão linear múltipla para avaliação do valor de mercado de apartamentos residenciais em Fortaleza, CE. Ambiente Construído, 19(1), 89-104. http://dx.doi.org/10.1590/s1678-86212019000100295.
http://dx.doi.org/10.1590/s1678-86212019...
).
One of the approaches for analyzing housing demand is to estimate the value of properties offered on the market. This is part of the hedonic pricing model proposed by Rosen (1974)Rosen, S. (1974). Hedonic prices and implicit markets: product differentiation in pure competition. Journal of Political Economy, 82(1), 34-55. http://dx.doi.org/10.1086/260169.
http://dx.doi.org/10.1086/260169...
, in which housing is treated as a good composed of a set of other goods represented by their individual characteristics, such as location, built area, age, and amenities in the neighborhood, among others, whose prices implicitly contribute to forming its market price.
There is unanimity within the literature in the use of the linear regression model for modeling and estimating hedonic property prices, in which the price or value of the property is linearized as a function of individual characteristics. In this linear approach, there are applications from classical models such as multi-variable models (Nunes et al., 2019Nunes, D. B., Barros, J., No., & Freitas, S. M. (2019). Modelo de regressão linear múltipla para avaliação do valor de mercado de apartamentos residenciais em Fortaleza, CE. Ambiente Construído, 19(1), 89-104. http://dx.doi.org/10.1590/s1678-86212019000100295.
http://dx.doi.org/10.1590/s1678-86212019...
). However, care must be taken with the basic assumptions of the model.
According to Dantas (2003)Dantas, R. A. (2003). Modelos espaciais aplicadas ao mercado habitacional um estudo de caso para cidade do Recife (Tese de doutorado). Universidade Federal de Pernambuco, Recife. Retrieved in 2021, June 15, from https://repositorio.ufpe.br/handle/123456789/3833
https://repositorio.ufpe.br/handle/12345...
, non-compliance with these assumptions can be one of the expressive factors for the great volatility observed in the estimates of the price income elasticities of housing demand. This is because issues such as lack of normality, heteroscedasticity and spatial autocorrelation are quite common in real estate data and the presence of these effects can generate biased, inefficient or inconsistent estimates in relation to the model parameters. In addition, another of the existing complexities is the heterogeneity of the projects as individual characteristics, which then forces data to be processed in order to homogenize the sample.
The other approach to analyzing housing demand is the analysis of liquidity in the housing market. The concept of liquidity is, by definition, a complex concept. According to Zheng et al. (2015)Zheng, X., Chau, K. W., & Hui, E. C. M. (2015). Liquidity risk and cross-sectional return in the housing market. Habitat International, 49, 426-434. http://dx.doi.org/10.1016/j.habitatint.2015.06.012.
http://dx.doi.org/10.1016/j.habitatint.2...
, a liquid market can be defined as the market in which a larger amount of assets can be sold quickly with limited price impacts at a low transaction cost. Liquidity is a desirable feature of real estate investing, because homeowners can make capital gains when the property price rises, or they can reduce losses before the price drops further (Ho & McCauley, 2003Ho, C., & McCauley, R. N. (2003). Living with flexible exchange rates: issues and recent experience in inflation targeting emerging market economies (SSRN Scholarly Paper ID 845487). Social Science Research Network. https://doi.org/10.2139/ssrn.845487.
https://doi.org/10.2139/ssrn.845487...
).
The degree of liquidity in the real estate market varies considerably over time. It is observed that realized house prices do not fall enough in falling markets and do not rise enough in rising markets, or house prices do not adjust enough to liquidate with available properties on the market (Clayton et al., 2008Clayton, J., MacKinnon, G., & Peng, L. (2008). Time variation of liquidity in the private real estate market: an empirical investigation. Journal of Real Estate Research, 30(2), 125-160. http://dx.doi.org/10.1080/10835547.2008.12091217.
http://dx.doi.org/10.1080/10835547.2008....
; Zheng et al., 2015Zheng, X., Chau, K. W., & Hui, E. C. M. (2015). Liquidity risk and cross-sectional return in the housing market. Habitat International, 49, 426-434. http://dx.doi.org/10.1016/j.habitatint.2015.06.012.
http://dx.doi.org/10.1016/j.habitatint.2...
). In this sense, market liquidity is an approach which enables better understanding of the dynamic behavior of the real estate market.
Several measures proposed to quantify market liquidity were identified in the literature. However, these proposed measurements only capture one dimension of market liquidity. One of the liquidity measurements used depends on the trading activity in the real estate market, meaning that the volume and billing allege that real estate turnover is a more appropriate indicator to measure real estate sales than the number of real estate transactions (Krainer, 2001Krainer, J. (2001). A theory of liquidity in residential real estate markets. Journal of Urban Economics, 49(1), 32-53. http://dx.doi.org/10.1006/juec.2000.2180.
http://dx.doi.org/10.1006/juec.2000.2180...
; Anglin et al., 2003Anglin, P. M., Rutherford, R., & Springer, T. M. (2003). The trade-off between the selling price of residential properties and time-on-the-market: the impact of price setting. The Journal of Real Estate Finance and Economics, 26(1), 95-111. http://dx.doi.org/10.1023/A:1021526332732.
http://dx.doi.org/10.1023/A:102152633273...
; Zheng et al., 2015Zheng, X., Chau, K. W., & Hui, E. C. M. (2015). Liquidity risk and cross-sectional return in the housing market. Habitat International, 49, 426-434. http://dx.doi.org/10.1016/j.habitatint.2015.06.012.
http://dx.doi.org/10.1016/j.habitatint.2...
). Another measure of liquidity popular in private real estate markets is time to market or the selling speed of a property, as illiquid markets are those in which the expected time to sell is long.
In this work, the selling speed of a property will be adopted as the liquidity indicator. The proposed hypothesis is that the selling speed of a property allows for analyzing the market behavior through high or low demand compared to the behavior of high or low market supply. This allows us to identify how saturated the market is, when there are business opportunities or when the market is in equilibrium.
However, the sale speed indicator for a property is not always directly available in the databases. Furthermore, it is necessary to extract it through calculations as it is an indicator which depends on time. Considering that the database available to analyze this indicator is longitudinal and extensive, it is necessary to apply methods such as Data Mining to obtain an efficient extraction of a database which allows the analysis of this indicator.
2.1 Empirical studies of the real estate market in Brazil
Most of the empirical work found within the national literature has been focused on the approach of analyzing housing demand in terms of hedonic price models. The linear regression model has been the most used quantitative method for this analysis, with the exception of the study of Dantas (2003)Dantas, R. A. (2003). Modelos espaciais aplicadas ao mercado habitacional um estudo de caso para cidade do Recife (Tese de doutorado). Universidade Federal de Pernambuco, Recife. Retrieved in 2021, June 15, from https://repositorio.ufpe.br/handle/123456789/3833
https://repositorio.ufpe.br/handle/12345...
. In addition, cross-sectional data with treatments were used to be able to homogenize the sample.
Avila (2010)Avila, F. M. (2010). Regressão linear múltipla: ferramenta utilizada na determinação do valor de mercado de imóveis (Trabalho de Diplomação). Universidade Federal do Rio Grande do Sul, Porto Alegre. Retrieved in 2021, June 15, from https://lume.ufrgs.br/handle/10183/28569
https://lume.ufrgs.br/handle/10183/28569...
managed to use databases of properties in the city of Porto Alegre, RS, to determine a multiple regression equation which related the variables of each property with its sale price. The cluster analysis technique was used in addition to the regression itself, in which “similar” properties in terms of attributes were grouped.
In using the Analytic Hierarchy Process (AHP) and Fuzzy Logic methods, both multiple decision-making criteria techniques, Brandalise et al. (2019)Brandalise, N., Pereira, A. S. A., & Mello, L. C. B. B. (2019). Aid application multicriteria the decision based on AHP Method and Fuzzy Logic in commercial land selection. Gestão & Produção, 26(3), e3243. http://dx.doi.org/10.1590/0104-530x3243-19.
http://dx.doi.org/10.1590/0104-530x3243-...
were able to select land for commercial buildings in the city of Rio de Janeiro. They carried out an opinion survey with a market expert to select valuation factors and alternatives for commercial land to apply this method. These methods were chosen because of their flexibility, functionality and remarkable application in engineering problems for decision making.
According to Nunes et al. (2019)Nunes, D. B., Barros, J., No., & Freitas, S. M. (2019). Modelo de regressão linear múltipla para avaliação do valor de mercado de apartamentos residenciais em Fortaleza, CE. Ambiente Construído, 19(1), 89-104. http://dx.doi.org/10.1590/s1678-86212019000100295.
http://dx.doi.org/10.1590/s1678-86212019...
, having a database with samples of the characteristics of real estate projects makes it possible to represent the market value of a property through a linear regression equation. In the same line of thought, a multiple regression model was created in the study developed by Correa (2019)Correa, S. R. (2019). Avaliação de preços e vendas no setor imobiliário utilizando o Big Data. Retrieved in 2021, June 15, from http://tede2.pucgoias.edu.br:8080/handle/tede/4362
http://tede2.pucgoias.edu.br:8080/handle...
which proposed to forecast prices and sales quantity in the real estate market in Goiânia and Aparecida de Goiânia.
On the other hand, the study by Dantas (2003)Dantas, R. A. (2003). Modelos espaciais aplicadas ao mercado habitacional um estudo de caso para cidade do Recife (Tese de doutorado). Universidade Federal de Pernambuco, Recife. Retrieved in 2021, June 15, from https://repositorio.ufpe.br/handle/123456789/3833
https://repositorio.ufpe.br/handle/12345...
applied spatial statistics to create a hedonic price model in the city of Recife. Modeling based on the spatially weighted regression model is able to alleviate the problems of heteroscedasticity and spatial autocorrelation found in the linear regression model. The results found by the author showed that the spatially weighted regression model presents results with less bias and errors than the traditional linear regression model in estimating property value.
Most of the results in the empirical studies have satisfactory adjustment indicators which also informed of some treatments needed to be performed due to the limitations of the linear regression model, yet the analyzes are dependent on the set of cross-sectional data used. However, this does not allow a behavioral analysis of the real estate market dynamics, as it is static in time.
2.2 The real estate market in Goiânia
The city of Goiânia is the state capital of Goiás (GO), and has a population of 1,302,001 inhabitants according to the 2010 census of the Brazilian Institute of Geography and Statistics (IBGE). The main economic activities developed are trade, public services, agriculture and industry, with a per capita Gross Domestic Product of R$32,209.01 (IBGE, 2010Instituto Brasileiro de Geografia e Estatística – IBGE (2010). PIB dos Municípios: agropecuária representa mais da metade da atividade econômica em 1.135 municípios. Rio de Janeiro: IBGE. Retrieved in 2021, June 15, from https://censo2010.ibge.gov.br/noticias-censo.html?busca=1&id=1&idnoticia=3343&t=pib-municipios-agropecuaria-representa-mais-metade-atividade-economica-1-135&view=noticia
https://censo2010.ibge.gov.br/noticias-c...
).
According to a global survey carried out in 54 countries by the Bank for International Settlements (BIS) carried out after the great real estate crisis in the United States, real estate appreciation of 121% was observed in the sector at a national level between 2008 and 2013 (Nakagawa, 2014Nakagawa, F. (2014, janeiro 17). Valorização de imóvel no Brasil foi a maior do mundo nos últimos 5 anos-Economia. Estadão. Retrieved in 2021, June 15, from https://economia.estadao.com.br/noticias/geral,valorizacao-de-imovel-no-brasil-foi-a-maior-do-mundo-nos-ultimos-5-anos,175663e
https://economia.estadao.com.br/noticias...
).
This appreciation was accompanied by a significant expansion in credit for the acquisition of these properties. According to data from the Brazilian Association of Real Estate Credit and Savings Entities (ABECIP), there was an increase of 42% in the volume of financing for construction and purchase of real estate only between 2010 and 2011, totaling R$79.9 billion (Castelo, 2011Castelo, A. M. (2011). Crescimento com moderação. Conjuntura da Construção, 9(2), 18-19.).
However, the economy began to show signs of a slowdown as of 2013, starting a new downward scenario that worsened in 2015 driven by the weakening of the national economy and political uncertainties. “If at first there was cheaper real estate credit and high demand in a growing economic cycle, now there has been a reversal of these factors as interest rates are high and credit is scarcer”, reveals Eduardo Zylberstajn, coordinator of the FipeZap Index (Lima, 2017Lima, B. S. (2017). Ascensão e queda nos preços do Mercado Imobiliário: análise comparativa no período de 2010 a 2017 no caso brasileiro (Projeto de Graduação). Universidade Federal do Rio de Janeiro, Rio de Janeiro.).
Regarding the local real estate market, Goiânia is one of the capitals with the cheapest square meter in Brazil, which is why it has been recovering with good prospects for the future. According to the March 2019 Residential Sales Report, the average selling price of residential properties was R$7,176/m2 among the 50 cities monitored by the FipeZap Index. In addition, the following state capitals with the lowest average residential sale value per square meter stood out: Campo Grande (R$4,038/m2), Goiânia (R$4,267/m2) and João Pessoa (R$4,501/m2) (FIPEZAP, 2019FIPEZAP. (2019). Informe de março de 2019. https://fipezap.zapimoveis.com.br/wp-content/uploads/2019/04/fipezap-201903-residencial-venda.pdf
https://fipezap.zapimoveis.com.br/wp-con...
)
According to the vice president of the Association of Companies in the Real Estate Market of Goiás (ADEMI-GO), the real estate crisis at the beginning of the decade has come to an end. Consumer market confidence is gradually returning. The reduction in the interest rate lowers the cost of capital and improves loan conditions for construction, improving the sector’s prospects (Sibin et al., 2016Sibin, B. H., Silva, L. A., Fo., & Ballini, R. (2016). Financiamento habitacional e seus impactos sobre os preços na construção civil brasileira. Revista ESPACIOS, 37(20), 1-24. Retrieved in 2021, June 15, from https://www.revistaespacios.com/a16v37n20/16372026.html
https://www.revistaespacios.com/a16v37n2...
).
3 Method
3.1 Database selection
The database provided by ADEMI-GO was chosen to analyze the projects in Goiânia and Aparecida de Goiânia. A database was used to develop the proposal, limiting the analysis of 268 real estate projects sold in Goiânia with a launch date between January 2016 and December 2018, accounted for month by month, generating a total of 4746 entries in the database.
This database was chosen because it presents a set of desirable characteristics for research, among which being collected by an Association and not by a Developer or Construction Company, thus guaranteeing an impartial source of the collected data. Another relevant feature is consistency in obtaining information: ADEMI has a tradition of keeping its database updated every month since 1986, the date of its foundation. And finally, the possibility of accessing the data using ADEMI, thus enabling the research to be carried out.
The information received needed adjustments to become a cohesive database in order to be numerically analyzed. The formatting of this database was done manually to achieve the desired precision. Thus, the database provided by ADEMI became easy to analyze after treatment. It was possible to draw conclusions from the data collected which so far had not been used in the decision-making of the developers which compose ADEMI.
3.2 Definition of research period and variables
It was first defined that the data analysis should be carried out from January 2016 in order to obtain results that were relevant to the current situation of the real estate market in Goiânia. The criteria excluded data from the years 2014 and 2015 crisis years to generate a representative survey of the current market in region. The Brazilian crisis which began in 2014 and intensified in 2015 was based on the economic area and negatively reflected the results of civil construction companies (Andrade, 2018Andrade, G. S. (2018). O impacto da crise econômica de 2014-2017 nas empresas de construção civil (Projeto de Graduação). Universidade Federal do Rio de Janeiro, Rio de Janeiro.). Data from the crisis period could create a statistical bias if it were included in the study, as it is a period of impact on people’s purchasing power and on the real estate market.
Next, the variables to be analyzed were selected after defining and adapting the database used in the research. First, all the variables which were not raised in all the enterprises during the research period were eliminated, so that all data had the same type of variables. Then, the variables that were considered irrelevant to the research objectives were eliminated. Finally, the name of the analyzed project and the developer responsible for it were hidden in order to protect the privacy of the developers regarding their sales results.
This selection resulted in the following list of variables that were analyzed in this research: type of development (vertical residential, horizontal residential, commercial, etc.), neighborhood, city, month of launch, number of bedrooms, price per unit, private m2 per unit, value per m2, number of available units, inventory in the month, and month of analysis.
The research was limited to evaluating only one type of development: vertical residential, since a direct comparison of projects with a fundamentally different character leads to very different results from reality. The minimum number of project units was also limited to 10 units, as it was identified that very small projects also generated discrepant results in the research (projects with less than 10 units often did not have an elevator, which significantly impacted the final price of the real estate project). Finally, the launch month limit was set for December 2018, so that the most recent project analyzed could have at least six months between the research date and the launch date.
3.3 Data processing
A master spreadsheet was created for data processing, in which all data from every month of 268 projects provided by ADEMI with a launch date in the first half of 2016 until the second half of 2018, completing 6 months of launch data from the project’s launch date to May 2019 were entered, Filters were applied to visualize how sales progressed month by month from the launch of each of these projects.
After applying these filters, it was noted that several projects appeared more than once in the same month of analysis. This was because some projects had more than one type of apartment. Despite being in the same development, different apartments have different attractions. We chose to differentiate each type of apartment and treat them as independent projects in order to obtain a more precise analysis of the most sought-after typology. For this purpose, a letter A, B, C, D or E was assigned to each different type of apartment in the same development.
Some inconsistencies were identified in the data provided by ADEMI soon after this process, in which some projects showed significant changes in their stock from one month to the next, and then the original number of available units reappeared in the following month. These errors are possibly typos caused by ADEMI researchers.
It was also noticed that some projects did not have values in their inventory in a few months, just a gap with a blank cell. In addition, some projects had stocks with a high degree of randomness throughout all of the analysis months, showing variations which did not respect any chronological logic. Thus, the method suggested by Hair et al. (2014)Hair, J. F., Black, W. C., & Babin, B. J. (2014). Multivariate data analysis: a global perspective (7th ed.). Upper Saddle River: Prentice Hall. was implemented to process these data in which high randomness patterns are excluded from the analysis.
3.4 Classification of projects in high and low demand by the market
Next, a preliminary criterion for classifying these projects was necessary after organizing all the projects in chronological order month by month, so that only those with the greatest demand could be analyzed. Thus, unstructured interviews were conducted with directors from the development, commercial and marketing areas of two traditional developers in the real estate market in Goiás to define this criterion. There was a consensus among professionals in the area that successful projects are in high demand soon after their launch, and a relevant percentage may have been sold in the first few months and even before the start of the project’s execution. Therefore, it was defined that the projects with the highest percentage sold six months after their launch would be classified as “high demand”. Similarly, projects with a lower percentage sold after these six months would be classified as “low demand”. At first, it was thought to define a period of one year to analyze this percentage, but it was noticed that the difference between successes and failures was more accentuated at six months.
Then, the standard deviation of the percentage sold in the sample was calculated, as well as the average of this percentage sold. Standard deviation is a measure of dispersion and its value reflects the variability of observations in relation to the mean (Lunet et al., 2006Lunet, N., Severo, M., & Barros, H. (2006). Desvio padrão ou erro padrão. Arquivos de Medicina, 20(1-2), 55-59.).
The dispersion of observations that constitute a sample can be characterized by the deviations of each observation in relation to the mean, which can take positive or negative values, and the sum of the deviations of each observation in relation to the sample mean is zero. However, squared deviations always take a positive value, and their mean is the sample variance. If there is a large dispersion of observations, the variance is large. If the values of each of the observations are close to the mean, the variance is small. The standard deviation is the square root of the variance (Formula 1) (Lunet et al., 2006Lunet, N., Severo, M., & Barros, H. (2006). Desvio padrão ou erro padrão. Arquivos de Medicina, 20(1-2), 55-59.).
In which:
SD: standard deviation
∑: summation symbol. Indicates that we have to add all terms, from the first position (i=1) to position n
xi: value at position i in the dataset
AM: arithmetic mean of data
n: amount of data
It was defined that projects classified as “intermediate” would be between the S and I limits, where S is the upper limit (arithmetic mean plus standard deviation) and I the lower limit (arithmetic mean minus standard deviation). Ventures with a percentage sold after 6 months above S were defined as “high demand” and below I would be defined as “low demand”. This classification was inspired by the definition of standard deviation presented by Lunet et al. (2006)Lunet, N., Severo, M., & Barros, H. (2006). Desvio padrão ou erro padrão. Arquivos de Medicina, 20(1-2), 55-59., and was developed in this work.
Next, an example was chosen in each of these two categories in order to verify the quality of the distinction between high and low demand developments proposed in this work. These two example projects were chosen so that there was the greatest amount of information and the least amount of noisy data in the months of analysis.
The sales progression curves of chosen examples were plotted month by month from their launch. The number of months elapsed since the launch was placed on the abscissa axis, starting at 0. The percentage already sold of the project was placed on the ordinate axis, also starting at 0%.
3.5 Analysis
An innovative method of results analysis was proposed for this work, being different from the commonly used linear regression. Due to the pioneering nature of the work, it was necessary to develop a method which could be useful in future analyzes in different areas (not only in the real estate market), in addition to satisfying the specific needs of this work.
It was decided to carry out a graphical analysis of the distribution of each characteristic, both among the total of 107 projects analyzed and among the projects with high demand. This method was chosen because unlike the others, it allows to determine characteristics categorized as “market opportunities”. This determination is of great value to companies in the sector, but had not yet been explored in scientific works on the subject.
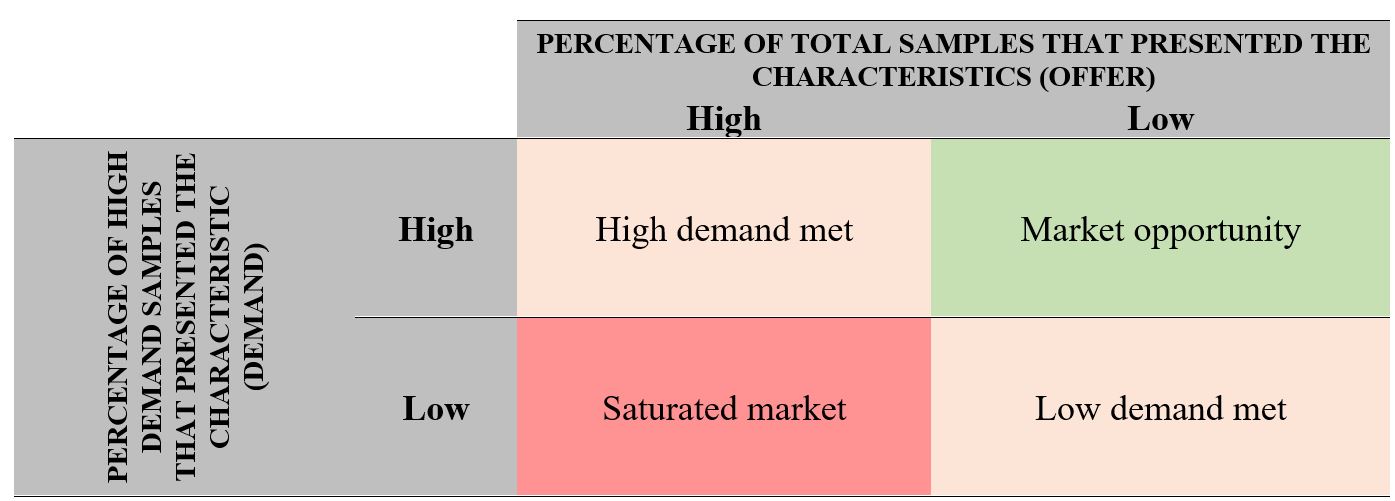
The characteristics of high demand samples are an indication of market demand. This means that when a feature is present in a high percentage of high demand projects, it tends to be a feature that is in great demand by the consumer market. Similarly, the characteristics present in the total number of samples offered are an indication of the offer. In other words, when a characteristic is present in a high percentage of the total analyzed projects, it tends to be a characteristic that is widely offered by the market.
Although observed in a similar way, the supply and demand indicators are not mutually dependent. The offer is analyzed by observing the total number of projects offered. On the other hand, demand is analyzed by observing only the most demanded projects. Thus, it is possible to classify each category analyzed according to these indicators.
If the characteristic in question is present in a large part of the high demand samples (indicative of high demand), it can fit into two categories: “high demand met” or “market opportunity”. The first refers to a characteristic which in addition to being indicative of high demand, also has an indication of high supply. Thus, this feature is desired by the market, but this demand is met by the high supply in the region. The second, “market opportunity”, refers to a feature that is very much in demand, but little offered in the market, meaning that there is an unexplored demand in the region.
However, if the characteristic has an indicator of low demand, meaning that it is not present in most of the high demand samples, it can fit into two other categories: “saturated market” or “low demand met”. The first, “saturated market”, refers to a feature that despite being highly supplied, is not much in demand in the region. This means that there are more offers of apartments with this feature than there is demand. The second refers to a characteristic that is not very much in demand and therefore offers little in the region. As in the “high demand met” category, in this case the supply followed the demand. This market analysis method developed herein can be used in several sectors and is shown in Figure 1.

Classification of property characteristics to identify market opportunities. Source: The authors.
The opportunity and market saturation gaps can be identified by overlaying the graphs of the total analyzed samples and the graph of high demand samples, which are illustrated in Figure 2.

4 Discussion and results
At the end of the process of eliminating spurious data and verifying and processing the database, 107 property records were found that served the purpose of this research. These properties had a launch date between January 2016 and the second half of 2018, completing 6 months of data releases from the project launch date to May 2019.
4.1 Classifying high and low demand
The standard deviation using the standard deviation formula (Formula 1) in the variable “percentage sold 6 months after launch” of the 107 data series relevant to the research was found to be 26%. The arithmetic mean of the sample for the period was 52% of units sold.
It was then found that the upper and lower limits for a project to be classified as “intermediate” were 78% and 26% of units sold, respectively, and 65 intermediate projects were found.
Next, 22 projects with a percentage sold below 26% at 6 months after launch were found and classified as “low market demand”. Then, 20 projects with a percentage sold above 78% at 6 months after the launch were found and classified as “high market demand”. The division is illustrated in Figure 3.

The records of high and low demand projects are represented in Tables 1 and 2, respectively.
4.2 Progression curves
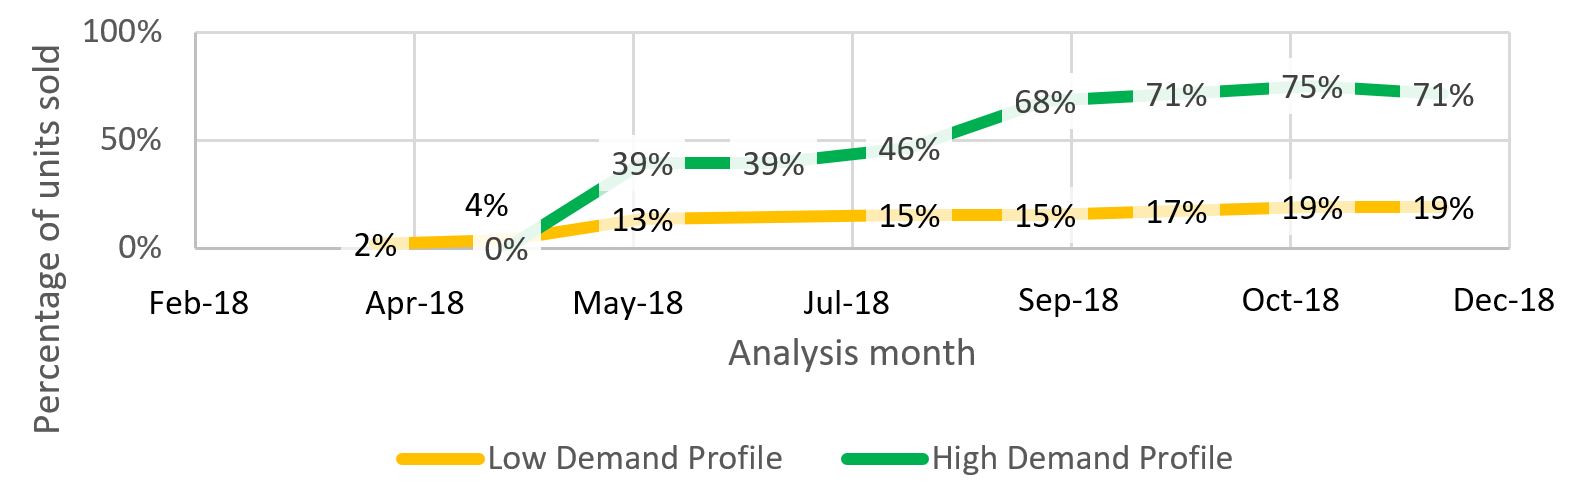
Next, two properties (one in each category) were chosen for the quality of the classification of projects between high and low demand to compare the progression of their percentage sold. To choose these projects, examples were sought which presented little or no spurious data and had close launch dates in order to minimize external factors such as variations in the city’s economy and differences in competition. The curves are represented in Figure 4.

Progression of sales of two projects, one with high demand and the other with low demand.Source: The authors.
The progression curve is a time series analysis of two profiles which enables a better visualization of the project’s sales speed. The faster a development is sold, the faster the return on investment and the lower the cost of capital. Apartments with a high demand profile are more likely to be sold in the first month, which equates to greater liquidity. In this sense, the hypothesis is raised that the characteristics of the high demand profile can be related to the greater liquidity of the projects, and can be tested in individual analyses, applying methods of panel data or time series.
The project classified as high demand had a high number of units sold (39%) in the first month after launch (May), with a very sharp curve at the beginning (from 0% in April to 39% of units sold in May) which stabilizes at the end of the first year (percentage of units sold approximately stable between 68% and 75% as of September 2018). The low demand development presented an approximately stable curve (with a variation of only 19%) throughout the period. The curves were sufficiently different from each other, and the classification of projects between high and low demand was considered as satisfactory by sampling.
4.3 Location (Neighborhood)
The distribution by neighborhoods in Goiânia of the projects analyzed in this research was compared with the distribution of high demand properties in Figure 5.

Percentage of high demand developments compared to the total percentage of developments analyzed by neighborhood.Source: The authors.
From the analysis of Figure 5, it is possible to see that the Marista and Bueno Sector are saturated with property offers, with a much higher percentage of total launches (21% of the total projects launched in the period were in the Marist Sector) than the percentage sought by clients (only 10% of the high demand developments were in the Marist Sector). Sector Parque Amazônia, Leste Universitário, Airway, Progresso and Jardim Atlântico represent market opportunities. Despite the low percentage of property launches, these properties were highly sought after by the market, reaching a higher demand percentage than the launch percentage. The geographic positions of the neighborhoods where the successful developments are located are illustrated in Figure 6.

Geographical positions of neighborhoods of high demand developments in satellite imagery. Source: The authors.
The satellite image allows to analyze the position of each neighborhood where the high demand developments are located, and the darker the filling of the neighborhood, the greater the sum of the sales percentages in the first six months after launch of all the projects in high demand located in the neighborhood.
4.4 Launch date
The semester distribution of launching projects in Goiânia analyzed in this research was compared with the distribution of high demand properties in Figure 7.

Percentage of high demand developments compared to the total percentage of projects analyzed by launch semester from 2016 to 2018. Source: The authors.
When analyzing the graph, it is not possible to observe a market preference for a specific launch period, as the percentage of high demand projects followed the percentage of total projects, showing little variation.
However, it was possible to observe that there was a significant decrease in the volume of projects launched in 2017, particularly in the first half. One hypothesis is that this decrease comes from the political and economic moment experienced by Brazil at the end of 2016.
In August of that year there was the impeachment of President Dilma Rouseff and the recovery speed from the crisis that negatively reflected on the results of construction companies in 2015 decreased (Andrade, 2018Andrade, G. S. (2018). O impacto da crise econômica de 2014-2017 nas empresas de construção civil (Projeto de Graduação). Universidade Federal do Rio de Janeiro, Rio de Janeiro.). Increased risk aversion and absolute preference for liquidity are common in times of crisis (Freitas, 2009Freitas, M. C. (2009). Os efeitos da crise global no Brasil: aversão ao risco e preferência pela liquidez no mercado de crédito. Estudos Avançados, 23(66), 125-145. http://dx.doi.org/10.1590/S0103-40142009000200011.
http://dx.doi.org/10.1590/S0103-40142009...
).
This set of factors may have influenced companies not to invest in new ventures at that time.
4.5 Number of bedrooms
The distribution of the number of bedrooms in the enterprises analyzed in this research was compared with the distribution of high demand properties in Figure 8.

Percentage of high demand developments compared to the total percentage of developments analyzed by number of bedrooms. Source: The authors.
Three-bedroom apartments are the most sought after in the Goiânia market (45% of high demand apartments have this feature). The offer follows this demand, since 47% of the apartments offered also have three bedrooms.
From looking at Figure 8, it is concluded that apartments with only one bedroom represent a market opportunity, as it is a characteristic present in 20% of the projects classified as “high demand”, but represent only 6% of the total projects. This difference indicates a gap between supply and demand, in which the consumer market seeks this type of apartment more than what is offered in Goiânia.
4.6 Private area
The distribution of square footage of private area of the projects analyzed in this research was compared with the distribution of high demand properties in Figure 9.

Percentage of high demand developments compared to the total percentage of developments analyzed by private area ranges. Source: The authors.
It is noticed that 11% of the apartments launched in Goiânia in the period from 2016 to 2018 had an area greater than 200m2. However, none of the apartments in this size was well received by the market. On the other hand, smaller apartments with an area of less than 50m2 represent a market opportunity, as they were more sought after than offered. This result is in line with the previous result in which one-bedroom apartments also characterized a market opportunity.
However, apartments from 50 to 100 m2 are the most sought after by Goiânia’s consumer market, as 45% of the high demand developments analyzed had this characteristic.
4.7 Price per m2 of private area
The price distribution per square meter of the projects analyzed in this research was compared with the distribution of high demand properties in Figure 10.

Percentage of high demand developments compared to the total percentage of developments analyzed by private square meter price range. Source: The authors.
Through the graph, it is clear that there are market opportunities for apartments in the price range of R$3,500.00 to R$4,500, and in the range of R$6,000.00 to R$6,500.00. This does not mean that a property advertised at R$6,500.00 per square meter would be less sought after if it were advertised at R$5,500.00. Thus, it is concluded that in the sample analyzed for the same property, the lower the price per square meter, the greater the demand.
What happens is that the price per square meter is directly linked to the quality of finish and the standard of the apartment in general. It can then be said that there are market opportunities in both medium-low standard (value considered) and in high standard (value considered).
4.8 Apartment price
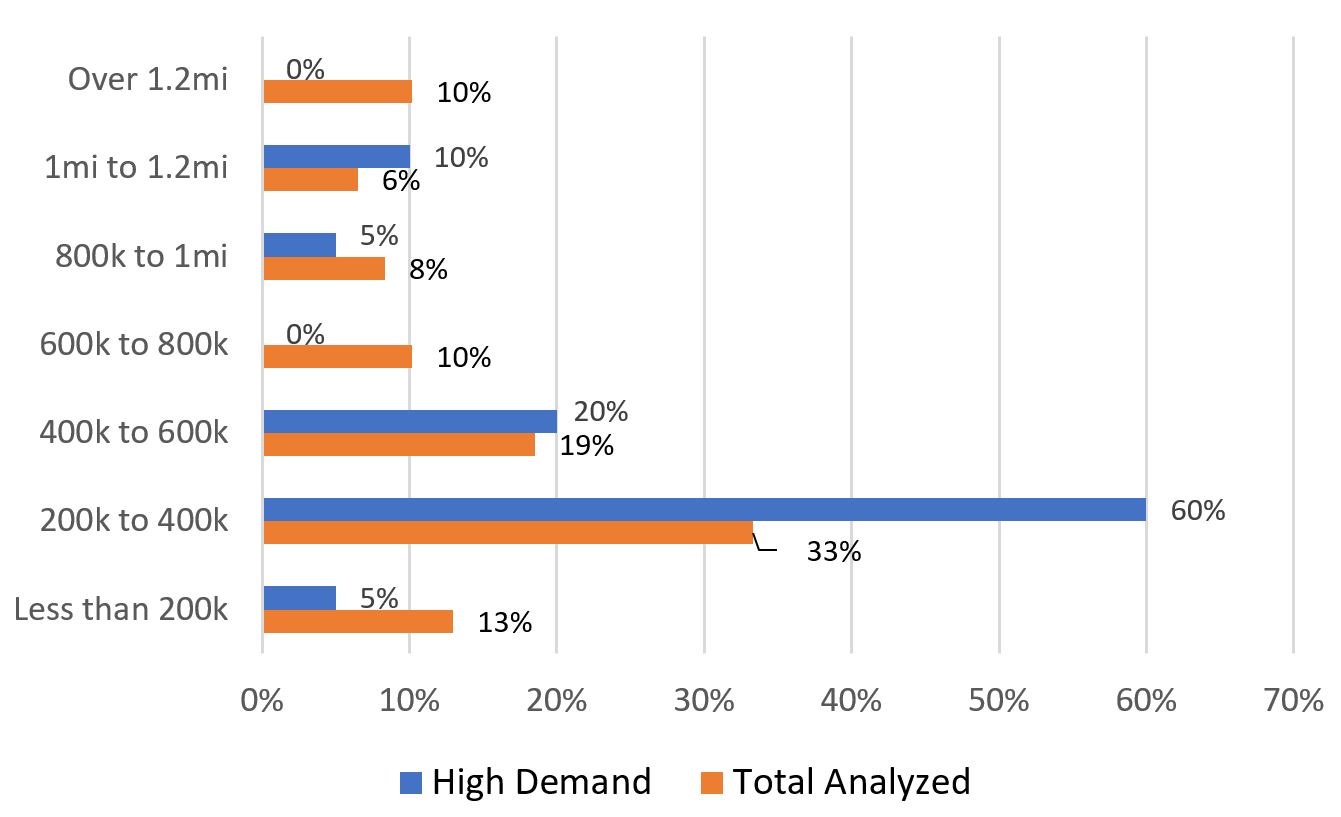
The price distribution of the apartments analyzed in this research was compared with the distribution of high demand properties in Figure 11.

Percentage of high demand developments compared to the total percentage of developments analyzed by apartment price ranges. Source: The authors.
It is possible to see a great investment opportunity in apartments priced between R$200,000 and R$400,000. Although 60% of high demand developments have prices in this range, only 33% of offers were in this category. Therefore, the demand for this type of apartment is greater than the offer (60% of successful developments have this characteristic, while only 33% of offers).
4.9 Summary of results
Through the analysis of data provided by ADEMI-GO, it was possible to identify that location, number of bedrooms, value per unit, private square footage and price per square meter have an influence among the studied variables on the reception of the property by the market. The property’s launch date is not relevant to the project’s sales success.
In observing the demand indicators, the most sought after apartments have three bedrooms, 50 to 100 m2 of private area and are located in Setor Oeste and Parque Amazônia. The price of the most demanded m2 is between R$3,500.00 and R$4,000.00, and the total price of the apartments in greater demand is in the range of R$200,000 to R$400,000.
However, taking into account the gaps in supply, the greatest market opportunities are found in single-bedroom developments of less than 50 m2, in the Progresso, Aeroviário and Parque Amazônia sectors. The price of the m2 which has higher demand than the offer is also in the range of R$3,500.00 to R$4,000.00, and the total price of the apartment with the greatest investment opportunity by developers is between R$200,000 and R$400,000 per unit.
5 Conclusions
The main objective of the work to develop and implement quantitative criteria that classify real estate projects in high and low demand by the market, group them according to their sales speed and identify them according to the characteristics present in successful projects was achieved.
The characteristics in the outstanding developments are related to location, private area, price per square meter and number of bedrooms. The outstanding projects for the analyzed sample were located in the Western Sector and Parque Amazônia; they have three bedrooms; with private area between 50m2 and 100m2; with a m2 price between R$3,500.00 and R$4,000.00; and with an apartment price between R$200,000 and R$400,000.
The projects were divided into high demand, medium demand and low market demand using the definition of standard deviation. The quality of this division was sampled verified through the progression curves of these projects.
After this classification using the method developed in this work, the variables of location, number of bedrooms, value per unit, private square footage and price per square meter, which all influence the acceptance of the property by the market, were analyzed. The launch date of the property was also analyzed, but it was found that it does not have great relevance in the project’s selling success.
The secondary objective of characterizing the investment opportunities of companies in the real estate market in the Goiânia region through analyzing supply and demand indicators was also achieved. The representative characteristics of the companies’ investment opportunities were: location in the Setor Progresso, Setor Aeroviário and Parque Amazônia neighborhoods; single bedroom; private area less than 50m2; m2 price between R$3,500.00 and R$4,000.00; apartment price between R$200,000 and R$400,000.
With the same database and using the common linear regression method for the analysis of results, Correa's work (2019) was inconclusive, with regard to the profiles of opportunity and high demand, due to the limitations of the traditional methodology.
That said, this work demonstrates the effectiveness of obtaining a successful enterprise profile using the developed methodology. Nevertheless, the analysis method is simple, it can be used for databases organized in different ways, including more variables than what was analyzed herein, such as the number of parking spaces and the proportion between private area and leisure area. The number of variables studied in this work was limited to the number of variables present for the study period in the ADEMI database, which is considered the best information source for the real estate market in Goiás.
Companies that have competition analysis departments will be able to use the methodology used in this work to identify market trends and investment opportunities, both in Goiânia and in other regions of the country. This is possible in many markets, not just real estate.
For future work, it is suggested to expand the studied sample, analyze the influence of the economic crisis on the behavior of the real estate market and use the method developed in this work in other types of market in order to verify its applicability.
References
- Andrade, G. S. (2018). O impacto da crise econômica de 2014-2017 nas empresas de construção civil (Projeto de Graduação). Universidade Federal do Rio de Janeiro, Rio de Janeiro.
- Anglin, P. M., Rutherford, R., & Springer, T. M. (2003). The trade-off between the selling price of residential properties and time-on-the-market: the impact of price setting. The Journal of Real Estate Finance and Economics, 26(1), 95-111. http://dx.doi.org/10.1023/A:1021526332732
» http://dx.doi.org/10.1023/A:1021526332732 - Avila, F. M. (2010). Regressão linear múltipla: ferramenta utilizada na determinação do valor de mercado de imóveis (Trabalho de Diplomação). Universidade Federal do Rio Grande do Sul, Porto Alegre. Retrieved in 2021, June 15, from https://lume.ufrgs.br/handle/10183/28569
» https://lume.ufrgs.br/handle/10183/28569 - Brandalise, N., Pereira, A. S. A., & Mello, L. C. B. B. (2019). Aid application multicriteria the decision based on AHP Method and Fuzzy Logic in commercial land selection. Gestão & Produção, 26(3), e3243. http://dx.doi.org/10.1590/0104-530x3243-19
» http://dx.doi.org/10.1590/0104-530x3243-19 - Cai, F., Le-Khac, N.-A., & Kechadi, T. (2016). An integrated classification model for financial data mining New York: arXiv.
- Castelo, A. M. (2011). Crescimento com moderação. Conjuntura da Construção, 9(2), 18-19.
- Clayton, J., MacKinnon, G., & Peng, L. (2008). Time variation of liquidity in the private real estate market: an empirical investigation. Journal of Real Estate Research, 30(2), 125-160. http://dx.doi.org/10.1080/10835547.2008.12091217
» http://dx.doi.org/10.1080/10835547.2008.12091217 - Correa, S. R. (2019). Avaliação de preços e vendas no setor imobiliário utilizando o Big Data Retrieved in 2021, June 15, from http://tede2.pucgoias.edu.br:8080/handle/tede/4362
» http://tede2.pucgoias.edu.br:8080/handle/tede/4362 - Dantas, R. A. (2003). Modelos espaciais aplicadas ao mercado habitacional um estudo de caso para cidade do Recife (Tese de doutorado). Universidade Federal de Pernambuco, Recife. Retrieved in 2021, June 15, from https://repositorio.ufpe.br/handle/123456789/3833
» https://repositorio.ufpe.br/handle/123456789/3833 - Fan, J., Han, F., & Liu, H. (2014). Challenges of Big Data analysis. National Science Review, 1(2), 293-314. http://dx.doi.org/10.1093/nsr/nwt032 PMid:25419469.
» http://dx.doi.org/10.1093/nsr/nwt032 - FIPEZAP. (2019). Informe de março de 2019 https://fipezap.zapimoveis.com.br/wp-content/uploads/2019/04/fipezap-201903-residencial-venda.pdf
» https://fipezap.zapimoveis.com.br/wp-content/uploads/2019/04/fipezap-201903-residencial-venda.pdf - Freitas, M. C. (2009). Os efeitos da crise global no Brasil: aversão ao risco e preferência pela liquidez no mercado de crédito. Estudos Avançados, 23(66), 125-145. http://dx.doi.org/10.1590/S0103-40142009000200011
» http://dx.doi.org/10.1590/S0103-40142009000200011 - González, M. A. S., & Formoso, C. T. (2008). Construção de modelos do mercado imobiliário para análise de viabilidade com regressão e sistemas de regras difusas. Ambiente Construído, 6(4), 19-31.
- Hair, J. F., Black, W. C., & Babin, B. J. (2014). Multivariate data analysis: a global perspective (7th ed.). Upper Saddle River: Prentice Hall.
- Ho, C., & McCauley, R. N. (2003). Living with flexible exchange rates: issues and recent experience in inflation targeting emerging market economies (SSRN Scholarly Paper ID 845487). Social Science Research Network. https://doi.org/10.2139/ssrn.845487
» https://doi.org/10.2139/ssrn.845487 - Instituto Brasileiro de Geografia e Estatística – IBGE (2010). PIB dos Municípios: agropecuária representa mais da metade da atividade econômica em 1.135 municípios Rio de Janeiro: IBGE. Retrieved in 2021, June 15, from https://censo2010.ibge.gov.br/noticias-censo.html?busca=1&id=1&idnoticia=3343&t=pib-municipios-agropecuaria-representa-mais-metade-atividade-economica-1-135&view=noticia
» https://censo2010.ibge.gov.br/noticias-censo.html?busca=1&id=1&idnoticia=3343&t=pib-municipios-agropecuaria-representa-mais-metade-atividade-economica-1-135&view=noticia - Krainer, J. (2001). A theory of liquidity in residential real estate markets. Journal of Urban Economics, 49(1), 32-53. http://dx.doi.org/10.1006/juec.2000.2180
» http://dx.doi.org/10.1006/juec.2000.2180 - Lima, B. S. (2017). Ascensão e queda nos preços do Mercado Imobiliário: análise comparativa no período de 2010 a 2017 no caso brasileiro (Projeto de Graduação). Universidade Federal do Rio de Janeiro, Rio de Janeiro.
- Lunet, N., Severo, M., & Barros, H. (2006). Desvio padrão ou erro padrão. Arquivos de Medicina, 20(1-2), 55-59.
- Nakagawa, F. (2014, janeiro 17). Valorização de imóvel no Brasil foi a maior do mundo nos últimos 5 anos-Economia Estadão. Retrieved in 2021, June 15, from https://economia.estadao.com.br/noticias/geral,valorizacao-de-imovel-no-brasil-foi-a-maior-do-mundo-nos-ultimos-5-anos,175663e
» https://economia.estadao.com.br/noticias/geral,valorizacao-de-imovel-no-brasil-foi-a-maior-do-mundo-nos-ultimos-5-anos,175663e - Nunes, D. B., Barros, J., No., & Freitas, S. M. (2019). Modelo de regressão linear múltipla para avaliação do valor de mercado de apartamentos residenciais em Fortaleza, CE. Ambiente Construído, 19(1), 89-104. http://dx.doi.org/10.1590/s1678-86212019000100295
» http://dx.doi.org/10.1590/s1678-86212019000100295 - Rosen, S. (1974). Hedonic prices and implicit markets: product differentiation in pure competition. Journal of Political Economy, 82(1), 34-55. http://dx.doi.org/10.1086/260169
» http://dx.doi.org/10.1086/260169 - Sibin, B. H., Silva, L. A., Fo., & Ballini, R. (2016). Financiamento habitacional e seus impactos sobre os preços na construção civil brasileira. Revista ESPACIOS, 37(20), 1-24. Retrieved in 2021, June 15, from https://www.revistaespacios.com/a16v37n20/16372026.html
» https://www.revistaespacios.com/a16v37n20/16372026.html - Zheng, X., Chau, K. W., & Hui, E. C. M. (2015). Liquidity risk and cross-sectional return in the housing market. Habitat International, 49, 426-434. http://dx.doi.org/10.1016/j.habitatint.2015.06.012
» http://dx.doi.org/10.1016/j.habitatint.2015.06.012
Publication Dates
-
Publication in this collection
21 Mar 2022 -
Date of issue
2022
History
-
Received
15 June 2021 -
Accepted
22 Oct 2021