Abstract
Abstract - The gas balance technique applied to batch cultures of the aerobic microorganism Aspergillus awamori NRRL3112 results in respiratory coefficient,RQ, values as high as 1.4 for glucose concentrations around 50g/L and no nutrients or oxygen concentration limitation. RQ decreases during the culture to values around 1.0 for glucose concentrations lower than 10g/L. Besides of an indication of drastic metabolic changes, these data suggest the need for some care when utilizing the RQ value for process control purposes. This RQ variability also has influence on the determination mode of the specific oxygen uptake rate, qO2 (mmol/gh). If the RQ value is constant, qO2 can be determined through a carbon dioxide (CO2) gas balance. This determination mode gives more reliable results than the one based on the oxygen gas balance since CO2 determination via a spectrophotometer of infrared gives accurate results and is a fast response relative to fluctuations in the CO2. In the case of this process however, reliable values of specific oxygen uptake rate, qO2, can be obtained only through the oxygen gas balance
Gas balance technique; catabolic metabolism; respiratory quotient; Aspergillus sp.
The Gas Balance Technique and the Respiratory Coefficient Variability in Cultures of Aspergillus awamori NRRL 3112
B.V. Kilikian* * To whom correspondence should be addressed and C.H. Jurkiewicz
Departamento de Engenharia Química da Escola Politécnica da USP
CP 61548 - CEP 05424-970 São Paulo, SP - Brazil - Fax: 55-11-2113020
E-mail: Kilikian@usp.br
(Received: October 22, 1996; Accepted: February 24, 1997)
ABSTRACT - The gas balance technique applied to batch cultures of the aerobic microorganism Aspergillus awamori NRRL3112 results in respiratory coefficient,RQ, values as high as 1.4 for glucose concentrations around 50g/L and no nutrients or oxygen concentration limitation. RQ decreases during the culture to values around 1.0 for glucose concentrations lower than 10g/L. Besides of an indication of drastic metabolic changes, these data suggest the need for some care when utilizing the RQ value for process control purposes. This RQ variability also has influence on the determination mode of the specific oxygen uptake rate, qO2 (mmol/gh). If the RQ value is constant, qO2 can be determined through a carbon dioxide (CO2) gas balance. This determination mode gives more reliable results than the one based on the oxygen gas balance since CO2 determination via a spectrophotometer of infrared gives accurate results and is a fast response relative to fluctuations in the CO2. In the case of this process however, reliable values of specific oxygen uptake rate, qO2, can be obtained only through the oxygen gas balance.
KEYWORD: Gas balance technique, catabolic metabolism, respiratory quotient, Aspergillus sp.
INTRODUCTION
The gas balance technique is widely utilized for kinetics and metabolic studies of cell activity as well as for control purposes (OConnor et al., 1992; Zabriskie and Humphrey, 1978). The specific respiration rate, qO2 (mmol/gh), and the respiratory quotient, RQ, are the main variables determined through gas balance data treatment. Estimated values of cellular concentration can also be achieved through the oxygen yield factor, YX/O, (Zabriskie and Humphrey, 1978) or by the association with a mass balance for C, H, N and O, provided that the elemental composition of the cell is known (Bailey and Ollis, 1986).
RQ values for complete oxidation of some carbon sources to CO2 and H2O, are reported on the basis of the stoichiometry of the reaction (Zabriskie, 1985). The simplification allows qO2 determination only with the carbon dioxide molar fraction analysis in the outlet gas, provided that the composition of the inlet gas is known. It is an advantage because fluctuations in O2 molar fraction values are more significant than those observed for CO2 on account of the analytical principles commonly used. In addition, a defined RQ value is fundamental for process control purposes on the basis of the gas balance technique as, for example, for maximization of yeast growth yield on glucose (Wang et al., 1977).
The Embden-Meyerhof-Parnas pathway, EMP, and the pentose phosphate pathway, HMP, are the two main routes of the catabolic metabolism of glucose. Through a series of reactions glucose6-phosphate is converted to ribose5-phosphate, a five carbon molecule sugar, yielding one molecule of carbon dioxidefor each molecule of glucose in the HMP pathway. This pathway is an important form of ribose production for subsequent synthesis of nucleotides and several coenzymes. It also yields NADPH which has reductive capacity outside the mitochondria, a fundamental ability for synthesis reactions. In a culture medium without nutrient limitations, Aspergillus sp metabolizes two molecules of glucose through the EMP, while one goes to the HMP pathway (Rohr and Christian, 1983; Lehninger et al., 1993). The variable level of utilization of both of these main metabolic routes leads to RQ values greater than 1.0.
Taking into account that there is some carbon dioxide production in the tricarboxylic acid cycle (TCA), the different levels of molecules of this cycle used for cell component synthesis also have an influence on the RQ value. For instance, the growth of Aspergillus niger in glucose excess and Fe limitation leads to an overproduction of citric acid with RQ values as low as 0.4 (Clark and Lentz, 1961).
In this paper, values of RQ which are variable and significantly higher than 1.0 are shown in batch cultures of the aerobic microorganism Aspergillus awamori NRRL 3112 with glucose as the carbon source, although the literature reports RQ values very close to one in this situation (Zabriskie, 1985). The assumption of RQ equal to one allows an useful simplification in the determination of the oxygen uptake rate, qO2, which can be done only on the basis of the carbon dioxide molar fraction in the outlet gas. The error level for the qO2 is determined when RQ is fixed at 1.0 relative to that for variable RQ values.
MATERIALS AND METHODS
Microorganism and inoculum
Spores of Aspergillus awamori NRRL 3112 stored in tubes with sterile soil (Greene and Fred, 1934) were used. The strain was cultivated in a 1 liter Erlenmeyer flask with 200 mL of culture medium for 24h, 250 rpm at 35° C.
Culture medium
The medium for inoculum growth has an initial total reducing sugar concentration (TRSO) of 20 g/L. The medium for bioractor runs 1 and 3 had 80 g/L of TRSO and for run 2 it was 60 g/L. The TRSO was adjusted adding an adequate volume of cassava flour syrup (Aguero et al., 1990). The composition of the medium was (g/gTRS): yeast extract - 0.005; (NH4)2SO4 - 0.25; Na2HPO4.12H2O - 0.19; KH2PO4 - 0.18 and MgSO4.7H2O was 0.025. For run 3, the nutrients proportion relative to TRS was four times smaller.
Culture conditions
The runs were performed in a 15-L bioreactor (LSL Biolafitte SA France). The operation conditions were as follows: reaction volume =10L; inoculum fraction (v/v)=10%; agitation rate=700 rpm; air supply rate=10L/min; head pressure=0.2atm; pH=4.0; temperature=35°C. The calibration was done each 6h for both equipments through the flow of nitrogen gas for the zero adjustment and through the flow of a gas containing 21% oxygen and 4.7% carbon dioxide.
Analytical techniques
Samples were periodically taken from the bioreactor cultivations in order to analyze dry cell weight (X) by drying filtered and washed cells at 850C (Schmidell and Fernandes, 1976) and glucose concentration by the glucose-oxidase method (Merck, Darmstadt, Germany). The oxygen molar fraction, yO2,out, was determined through a paramagnetic analyzer and the carbon dioxide fraction, yCO2,out, through an infrared-type spectrophotometer. Both variables were registered each 30 minutes.
TREATMENT OF GAS BALANCE DATA
Figure 1 shows the experimental arrangement for the gas balance applied to the batch cultures.
The inlet molar air flow rate, Nin, was determined through the volumetric flow rate read on the flowmeter-type tri-flat variable area of Fisher & Porter Co. The temperature and the pressure values were registered each 30 minutes for further conversion of the volumetric flow into molar flow.
The molar rate of the outlet gas, Nout, can be determined by the mass balance on N2 in the gas streams, taking into account that it is inert in the system. This balance leads to the first equation:
(1)
The specific oxygen uptake rate is then determined from equation 2 which results from a mass balance for the oxygen in the gas streams. The oxygen mass in the liquid phase can be neglected due to its very low solubility (Heinzle and Dunn, 1992). The culture volume, V, resulted from a volume balance in the reactor.
(2)
The third equation shows the respiratory quotient, RQ, which is the ratio between the carbon dioxide evolution rate, CER ( mmol/h ), and the oxygen uptake rate, OUR ( mmol/h).
(3)
Figure 1: Experimental set-up for the gas balance.
The term Ninyin,CO2 can be neglected in equation 3 which can be simplified as follows:
(4)
When the RQ value is 1.0, OUR is equal to CER which means that each mol of oxygen consumption results in one mol of carbon dioxide evolution and, thus, the inlet and outlet gas molar flow rates are the same. Neglecting the yin,CO2, qO2 can be determined by equation 5, which simply needs the molar flow rate of the inlet air and the carbon dioxide fraction in the outlet gas.
(5)
For known RQ values, equation 6 exhibits a more generalized way to determine qO2 relative to equation 5.
(6)
RESULTS AND DISCUSSION
The yin,CO2 measured in the air was 5x10⁻⁴. This value exerts no significant influence on RQ when yout,CO2 is higher than 0.002. For the following correlations obtained in run 3, RQ and RQ¢ were determined according to equations 3 and 4, respectively.
RQ¢ = 1.036 RQ for yout,CO2 >0.002 (7)
RQ¢ = 1.355 RQ for yout,CO2 < 0.002 (8)
In accordance with equation 7, the difference between RQ and RQ¢ is only 3.6% for yout,CO2 values higher than 0.002, but is ten times greater when the outlet gas stream exhibits a value lower than 0.002 for the molar fraction of carbon dioxide. The error reduction for a yout,CO2 value greater than 0.002 is on account of the more significant difference between inlet and outlet molar fraction values, and thus, CER becomes more reliable, leading to more stable RQ and qO2 values. The reduction of inlet air flow rate can reduce this error, even in the beginning of the culture, in the same way as for the OUR value (Heinzle and Dunn, 1992).
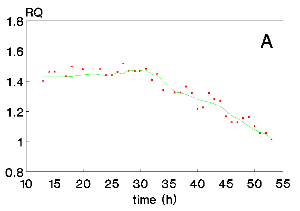
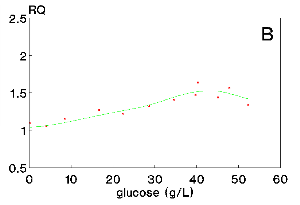
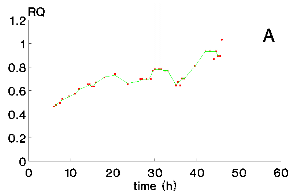
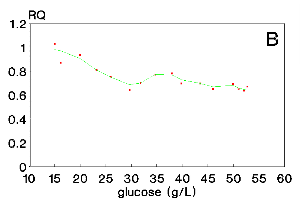
Figures 2 and 3 show RQ and glucose concentrations during the cultures. The glucose concentration in the medium results from polysaccharide hydrolysis and cellular consumption. The hydrolysis is catalysed by glucoamylase, which is one of the major products of Aspergillus sp. In account of this process, glucose concentration is not as high as the initial total reducing sugars concentration, TRSo , reported in Materials and Methods. In addition, data on gas balance were considered only from 10h, owing to the instability observed in the gas analysis data before this culture time.
Figures 2A and 3A show maximum RQ values around 1.4 for runs 1 and 2, thus, significantly higher than 1.0. The RQ values are also variable reaching the value of 1.0 only by the end of the culture. In Figures 2B and 3B, some correlation of RQ values with glucose concentrations is observed such that the respiratory quotient tends to 1.0 only when the carbon source concentration is lower than 10 g/L.
The broad range of RQ values clearly indicates significant metabolic changes. Although the determination of the nature of these changes was not the purpose of this work, its possible to make some suppositions. The carbon dioxide production relative to the glucose consumption depends on the proportion of glucose metabolization via EMP and HMP and, thus, these RQ values may suggest a variable ratio of utilization of both routes. Another source of RQ variation is relative to the TCA cycle. The unique irreversible step in the TCA cycle is catalysed by a -ketoglutarate dehydrogenase which is repressed by glucose and NH4. This repression can be gradually reduced as glucose and NH4 concentrations were reduced in the culture medium (Rohr and Christian, 1983). Besides this and as stated before, the TCA cycle is an amphibolic way of producing some precursors of cellular components resulting in practice RQ values slightly higher than 1.0.
Figure 4 shows RQ values for run 3. They are lower than 1.0 and, therefore, typical for citric acid production because the culture medium presents a nutrient/glucose relation (g/g) four times smaller than that for runs 1 and 2. This result advertises that the RQ pathway is not only glucose concentration dependent, as figures 2 and 3 could suggest. Both concentrations, glucose and nutrients, influence RQ together.
Figure 5 exhibits the values of the specific oxygen uptake rate for run 1, determined by equation 2, qO2, and equation 5, q¢ O2. The difference between qO2 and q¢ O2 is high in the beginning of the culture, around 100% for 10h and 45% for 13h, becoming gradually smaller with RQ decrease, until both values are almost equal by the end of the culture. These significant differences indicates that confident values of qO2 only can be obtained from equation 2.
However, as equation 2 is based on the oxygen balance, it needs reliable yout,O2 values which is somewhat difficult to access in highly dinamic processes through polarographic or paramagnetic principles frequently utilized. Therefore if RQ is known, its a good practice to determine qO2 through the carbon dioxide molar fraction, as equation 6 stated. The yCO2 determination by spectrophotomety supplies more stable and reliable values. Nevertheless, for unknown RQ behaviour, the oxygen gas balance is the best choice, provided that the oxygen gas analyzer is calibrated.


Figure 3: Respiratory quotient, RQ, as a function of time (A) and as a function of glucose concentration (B) for run 2.


Figure 5: Specific oxygen uptake rate, qO2 , on the basis of the experimental OUR value or the CER value with RQ fixed at 1.0.
CONCLUSIONS
The respiratory coefficient, RQ, for the aerobic microorganism Aspergillus awamori NRRL3112 exhibits extremely variable values (higher and lower than 1.0) accordingly to glucose and other nutrients concentrations in the culture medium. Therefore, reliable values of specific oxygen uptake rate, qO2, can be obtained only through the oxygen gas balance.
NOMENCLATURE
CER Carbon dioxide evolution rate, mmol h-1
Nin Molar rate of the inlet gas, mmol h-1
Nout Molar rate of the outlet gas, mmol h-1
OUR Oxygen uptake rate, mmol h-1
qo2 Specific oxygen uptake rate, mmol g-1 h-1
RQ Respiratory quotient
V Volume of culture medium in the reactor, L
X Cell concentration, g L-1
yin,o2 Oxygen molar fraction in the inlet gas
yout,o2 Oxygen molar fraction in the outlet gas
yin,co2 Carbon dioxide molar fraction in the inlet gas
yout,co2 Carbon dioxide molar fraction in the outlet gas
REFERENCES
Aguero, J.M.Z.; Macêdo, G.R.; Facciotti, M.C.R. and Schmidell, W., Influência do pH na Síntese e Liberação de Glicoamilase por Aspergillus awamori NRRL3112 e Aspergillus awamori NRRL337. Rev. Microbiol. 21 (4): 355-360 (1990).
Bailey, J.E. and Ollis, D.F., Biochemical
Engineering Fundamentals. McGraw Hill Chemical Engineering Series, New York (1986).
Clark, D.S. and Lentz, C.P., Submerged Citric Acid Fermentation of Sugar Beet Molasses: Effect of Pressure and Recirculation of Oxygen. Can. J. Microbiol. 7:447-453 (1961).
Greene, H.C. and Fred, E.B., Maintenance of Vigorous Mold Stock Cultures. Ind. Eng. Chem. 26: 1297-1299 (1934).
Heinzle, E. and Dunn, I.J., Methods and instruments in fermentation gas analysis. In: Biotechnology IV, Measuring, Modelling and Control ( Rehm H J and G Reed, eds.), pp 27-173, VCH, Berlim (1992).
Lehninger, A.L.; Nelson, D.L. and Cox, M.M. (eds.), Principles of Biochemistry. Worth Publishers, New York (1993).
O¢ Connor, G.M.; Sanchez-Riera, F. and Conney, C.L., Design and Evaluation of Control Strategies for High Cell Density Fermentations. Biotechnol. Bioeng. 39: 293-304 (1992).
Rohr, M. and Christian, P.K., Citric Acid. In: Biotechnology A Comprehensive Treatise in 8 Volumes (Dellweg H, ed.), pp 419-454, Verlag Chemie, Weinheim (1983).
Schmidell, W. and Fernandes, M.V., The Measurement of Cellular Protein Content as a Method for Determining Mold Concentration. J. Ferment. Technol. 54: 2225-2228 (1976).
Zabriskie, D.W. and Humphrey, A.E., Real Time Estimation of Aerobic Batch Fermentation: Biomass Concentration by Component Balancing. AICHE J. 24 (1): 138-146 (1978).
Zabriskie, D.W., Bioreactor Design, Operation and Control. In: Comprehensive Biotechnology II (Moo-Young M, ed.), pp. 175-189, Pergamon Press, New York (1985).
Wang, H.Y.; Cooney, C.L. and Daniel, I.C., Computer-aided Baker¢ s Yeast Fermentation. Biotechnol. Bioeng. 19:69-86 (1977).
- Aguero, J.M.Z.; Macędo, G.R.; Facciotti, M.C.R. and Schmidell, W., Influęncia do pH na Síntese e Liberaçăo de Glicoamilase por Aspergillus awamori NRRL3112 e Aspergillus awamori NRRL337. Rev. Microbiol. 21 (4): 355-360 (1990).
- Clark, D.S. and Lentz, C.P., Submerged Citric Acid Fermentation of Sugar Beet Molasses: Effect of Pressure and Recirculation of Oxygen. Can. J. Microbiol. 7:447-453 (1961).
- Greene, H.C. and Fred, E.B., Maintenance of Vigorous Mold Stock Cultures. Ind. Eng. Chem. 26: 1297-1299 (1934).
- O˘ Connor, G.M.; Sanchez-Riera, F. and Conney, C.L., Design and Evaluation of Control Strategies for High Cell Density Fermentations. Biotechnol. Bioeng. 39: 293-304 (1992).
- Schmidell, W. and Fernandes, M.V., The Measurement of Cellular Protein Content as a Method for Determining Mold Concentration. J. Ferment. Technol. 54: 2225-2228 (1976).
- Zabriskie, D.W. and Humphrey, A.E., Real Time Estimation of Aerobic Batch Fermentation: Biomass Concentration by Component Balancing. AICHE J. 24 (1): 138-146 (1978).
- Wang, H.Y.; Cooney, C.L. and Daniel, I.C., Computer-aided Baker˘ s Yeast Fermentation. Biotechnol. Bioeng. 19:69-86 (1977).
Publication Dates
-
Publication in this collection
09 Oct 1998 -
Date of issue
June 1997
History
-
Accepted
24 Feb 1997 -
Received
22 Oct 1996


