Abstract
The aim of this study was to evaluate the physical and physicochemical properties of different brands of traditional (A, B and E), low calorie (C) and sugar-free (D) guava preserves. The results of these analysis indicated that there are differences in the physical and physicochemical properties of the different brands studied, and the partial and/or total exclusion of sugar from guava alters its physical and physicochemical properties, making the product redder; even added body and sweetening agents are incapable of conferring properties similar to those of conventional products. Regarding the relaxation test, the Maxwell model was the best for sample discrimination. The results also showed that the samples have a traditional standardization and that the sample labeled "low calorie" has a tendency to exhibit a composition similar to the conventional sample, which is evidence that brand (C) cannot be considered to be low calorie.
Color parameters; Texture profile analysis; Stress relaxation test
FLUID DYNAMICS; HEAT AND MASS TRANSFER; AND OTHER TOPICS
Physical and physicochemical evaluation of different brands of traditional, low calorie and sugar-free guava preserves
P. A. P. Pereira* * To whom correspondence should be addressed ; V. R. Souza; J. D. S. Carneiro; S. V. Borges; L. O. Ferreira; F. Queiroz
Universidade Federal de Lavras (UFLA), Departamento de Ciência dos Alimentos, Fone: + (55) (35) 8435-6446, Rua Horácio de Carvalho 401, Centro, CEP: 37200-000, Lavras - MG, Brasil. * * To whom correspondence should be addressed E-mail: pattyap2001@yahoo.com.br E-mail: vanessardsouza@gmail.com; joaodedeus@dca.ufla.br; sborges@dca.ufla.br; larioliv@hotmail.com; fqueiroz@dca.ufla.br
ABSTRACT
The aim of this study was to evaluate the physical and physicochemical properties of different brands of traditional (A, B and E), low calorie (C) and sugar-free (D) guava preserves. The results of these analysis indicated that there are differences in the physical and physicochemical properties of the different brands studied, and the partial and/or total exclusion of sugar from guava alters its physical and physicochemical properties, making the product redder; even added body and sweetening agents are incapable of conferring properties similar to those of conventional products. Regarding the relaxation test, the Maxwell model was the best for sample discrimination. The results also showed that the samples have a traditional standardization and that the sample labeled "low calorie" has a tendency to exhibit a composition similar to the conventional sample, which is evidence that brand (C) cannot be considered to be low calorie.
Keywords: Color parameters; Texture profile analysis; Stress relaxation test.
INTRODUCTION
Guava is exceptional not only in its aroma and flavor, but also in its rich nutritional composition. It contains high levels of vitamin C, minerals, fiber, beta-carotene and lycopene (Queiroz et al., 2007) and is an important raw material with a high market acceptance in industry juices, pulps and nectars (Brunini et al., 2002).
Guava preserve is a product resulting from processing the edible parts of healthy guava, disintegrated, with sugar, with or without the addition of water, gelling agent, pH adjustment and other ingredients and permissible additives until the desired consistency is reached. It is thermally processed and packaged to ensure preservation and retain the normal color characteristics of the product, which range from yellowish red to brownish red. Its normal smell and taste are similar to those of guava, and it forms a gelatinous solid so that it can be cut (Brasil, 1978).
In recent decades, changing dietary habits in Brazil have resulted in a decreased consumption of processed products such as fruit preserves and jellies. Among other reasons, there is concern about calorie consumption and children and adolescent consumers who do not habitually consume products made with fruits, combined with a preference for the consumption of sweets and confectioneries. There are several technological problems that accompany the replacement of sugar in food, as sugar has many functions other than the development of sweet taste in the desired product. In the production of preserves, sugar contributes to the formation of gels and colors and lowers the water activity of the product, flavor, viscosity and desired texture, supporting the conservation of the product (Licodiedoff, 2008). The reduction and / or exclusion of sugar in these products cause chemical, physical and physical-chemical changes, and the physical changes are the most evident (Sandrou and Arvanitoyannis, 2000).
Many instrumental methods have been developed to determine the textural properties of food. The method of texture profile analysis (TPA) is still widely used; it simulates the process of chewing, allowing us to obtain several parameters (Funami, 2011, Rahman and Al-farce, 2005). However, the use of other instrumental methods can provide important information about the rheological behavior of food. The stress relaxation test was employed by several authors for the evaluation of the viscoelastic properties of gels (Bellido and Hatcher, 2009; Nobile et al., 2007; Rodriguez-Sandoval et al., 2009, Tang et al., 1998).
The objective of this study was to evaluate the physical and physicochemical properties of different brands of traditional, low calorie and sugar-free guava preserves and to identify correlations between them.
MATERIALS AND METHODS
Materials
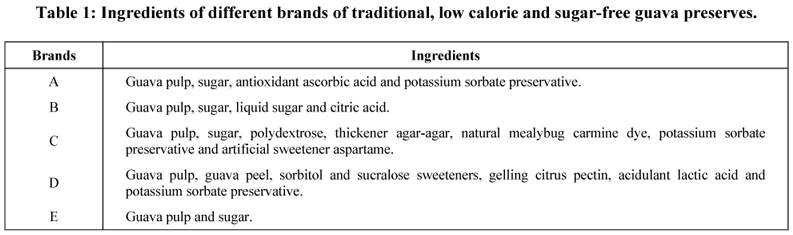
Five brands of guava preserves were tested: three traditional (A, B and E), a low calorie (C) and a sugar-free (D), and were acquired in the local market in the city of Lavras, State of Minas Gerais, Brazil. Table 1 shows the ingredients specified on the label of each product.
Table 1 Ingredients of different brands of traditional, low calorie and sugar-free guava preserves.
Methods
Physicochemical Analysis
The physicochemical properties (titratable acidity, pH, moisture, water activity, total sugar and total soluble solids) of different brands of traditional, low calorie and sugar-free guava preserves were determined using the methods described by the Analytical Association of Official Chemists (AOAC) (AOAC, 1992) and the Adolfo Lutz Institute (IAL) (IAL, 1985). The analyses were performed in triplicate.
Physical Analysis
Color Parameters
The instrumental technique used for the evaluation of color was the spectrophotometer (Musell, Hunter, CIE, CIELAB). The color space was set in the rectangular coordinates (L*, a* and b*). The color of the guava preserves was determined according to the methodology proposed by Lau et al. (2000). The values of L*, a* and b* were determined with a Minolta CR model unit 400 colorimeter, working with D65 (daylight) and using the standard CIELab, where L* ranges from 0 (black) to 100 (white), a* varies from green (-) to red (+) and b* ranges from blue (-) to yellow (+). The measurements were made in triplicate.
Texture Profile Analysis
The texture profile analyses (TPA) were performed under the following conditions: pre-test speed of 5.0 mm/s, test speed of 2.0 mm/s, post-test speed of 2.0 mm/s, a distance of 10.0 mm and compression with a cylindrical aluminum probe of 6.0 mm in a texturometer using the Stable Micro Systems Model TA - XT2i (Goldaming, England). The parameters analyzed were hardness, fracturability, adhesiveness, gumminess, springiness, cohesiveness and resilience. The samples were cut into rectangular shapes with a size of 3.0 cm in length, 2.0 cm wide and 2.0 cm high. The test was performed in duplicate with six measurements in each repetition.
Stress Relaxation Test
There are several mathematical models suitable to describe viscoelastic food products, but the Maxwell and Peleg models are used most frequently.
The Maxwell model involves two simple elements combined in series to represent different behaviors. These two elements are the ideal elastic element, which can be represented as a spring and has a behavior defined by an elastic constant E, and the ideal viscous element, which is represented by means of a dashpot and has a behavior defined by its viscosity η (Campus et al., 2010).
In the Maxwell model with a constant strain (ε0), σ describes the tension applied from σ0 for σ(t) after a time t (Nobile et al., 2007), given as follows:

where E is the elastic modulus of the material, Ee is the equilibrium elastic modulus and λ is the relaxation time, given by η/E. Some foods do not follow the Maxwell simplified viscoelastic model, requiring more complex models to describe their behavior. An example of this case is the generalized Maxwell model, which consists of an infinite number of Maxwell models in parallel over a spring.
The stress relaxation curves (stress versus time) can be adjusted by means of Equation (2), which provides the viscoelastic parameters of the generalized Maxwell model.
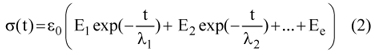
where E1, E2 ... are the elastic moduli of the ideal elastic body, Ee is the equilibrium elastic modulus and λ1, λ2 ... are the relaxation times.
In the Peleg model, stress relaxation data can be interpreted in accordance with the stress normalized according to Equation (3) (Peleg and Normand, 1983):

where σ(t) is the stress at any time during the test, σ0 is initial relaxation stress, k1 and k2 are constants. The reciprocal k1 represents the initial decay rate, whereas k2 is a hypothetical value of the asymptotic normalized force (Rodriguez-Sandoval et al., 2009, Tang et al., 1998).
According to Peleg (1979), there are difficulties in interpreting the relaxation results in the form of Equation (2). However, according to Bellido and Hatcher (2009), the main advantage of using Equation (2) is that it is open to interpretation in terms of rheological models. Therefore, these two mathematical models were chosen for use in the present study.
The stress-relaxation test was performed in a Stable Micro Systems Model TA - XT2i texturometer. The samples were cut into cylindrical shapes 2.0 cm in height and 2.0 cm in diameter and compressed to 5.0% of their original height with a speed of 7.0 mm/s. The deformation was kept constant for 10.0 minutes, allowing the stress to reach equilibrium. During that time, it was noted that the relaxation of the tension was measured at a rate of 1.0 per second. A cylindrical probe 7.0 cm in diameter, which was lubricated to eliminate the influence of friction between the sample and the equipment, was used. Three measurements were performed for each treatment. The nonlinear regression program SAS for Windows, version 5.0, was used to determine the constants of the Maxwell model. A generalized model of the two Maxwell elements can be fitted. This model was chosen because it presented a better fit than the Maxwell model and because there wasn't a considerable improvement when the generalized model of Maxwell's three elements and spring in parallel was used. The determination of the constants of the Peleg model was also performed using the nonlinear regression program SAS for Windows, version 5.0.
Statistical Analyses
This study used a completely randomized design to evaluate the physicochemical and physical properties of different brands of traditional, low calorie and sugar-free guava preserves. The analysis of variance and Tukey's test at 5% probability were performed with the Sisvar software (Ferreira, 2000), and principal component analysis was performed to correlate the physical and physicochemical properties using MATLAB and the Pearson's correlation in SAS for Windows, version 5.0.
RESULTS AND DISCUSSION
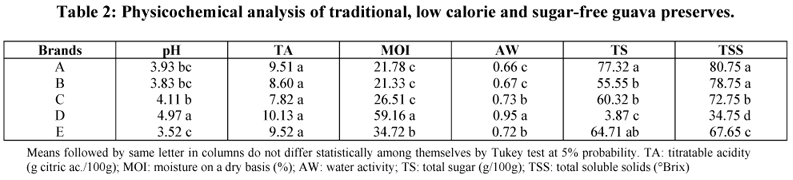
The results obtained for the physicochemical properties of traditional (brands A, B and E), low calorie (brand C) and sugar-free (brand D) guava preserves are shown in Table 2.
Table 2 Physicochemical analysis of traditional, low calorie and sugar-free guava preserves.
The pH of guava preserve D (sugar-free) had a higher average (Table 2). This may be due to the addition of lactic acid, which was unable to lower the pH to the pH of the other guava preserves analyzed. Guava preserve D also showed a higher water activity. According to Sandrou and Arvanitoyannis (2000), there are several technological problems that accompany sugar replacement, including increased water activity, loss of flavor, viscosity and desired texture.
Regarding the titratable acidity, no significant difference was observed at 5% probability in the analyzed samples.
Regarding the moisture of the sugar-free guava preserve, (D) showed a higher mean than the others. This is because products that do not require time for sugar processing are softer that the traditional product and undergo less exposure to heat, allowing them to retain more moisture (Zambiazi et al., 2006). The water activity in the guava preserve increased in D due to the high moisture content of the product and the low concentration of total sugars, which exert an osmotic effect.
In relation to the total sugar in guava preserves, C (low calorie) did not differ significantly from traditional guava preserves (B and E). Because a 25% reduction of total sugars did not occur in guava preserve (C) compared with the conventional product (brand B) of the same brand, (C) does not meet the rules for low calorie products (Brasil, 1998).
It was observed that only the color component L* shows no significant difference at 5% probability (Table 3), indicating that all the brands have the same luminosity. Regarding the component a*, brands (C) and (D) (low calorie and sugar-free, respectively) were significantly different from (A), (B) and (E) (traditional), with higher values. This higher value is probably due to the greater presence of lycopene in these samples, which is responsible for the red color of the guavas, or even the use of dyes and shells in the preparation of these products. According to Freire et al. (2009), lycopene (the main carotenoid found in red guava) is degraded by the effects of concentration and cooking time. In traditional guava preserves, the cooking time is long, indicating the loss of lycopene and a consequent decrease in red color. In a study of tomato ketchup preparation, Gama (2008) observed a 92% loss of lycopene due to high temperatures and long time of processing. Despite the significant differences among the samples, the component b* is not an important parameter in the properties of guava preserves because according to Padula and Rodriguez-Amaya (1987) and Menezes et al. (2009), guava is a fruit rich in lycopene and the value of a* is much more representative of the color parameter than b*. Nonetheless, brand (D) showed a higher value of this parameter, indicating that this product had a tendency to yellow.
Table 3 averages of the color parameters (L* and a*) for the five brands of traditional, low calorie and sugar-free guava preserves.
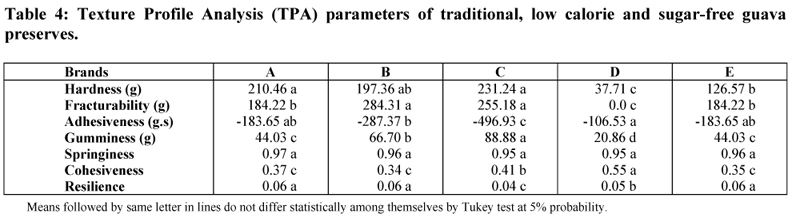
The hardness parameter did not significantly differ at a 5% significance level between guava preserve brands (A), (B) (traditional) and (C) (low calorie), and between guavas preserve brands (B) and (E) (traditional) (Table 4). Along with pectin, sugar is responsible for the ideal texture of fruit preserves. According to Moraes (2000), guava is classified as a fruit with average pectin content. This means that, in the presence of sugar, there is no need to add pectin in the preparation of preserves. However, when sugar is reduced or even excluded from the product, the formulation tends to exhibit a brittle texture (Licodiedoff, 2008). To avoid this problem, technologies of thickeners, gelling agents, and even fiber (polydextrose) are employed, which all improve the texture. Therefore, the preserve (C) (low calorie) resembles (A) and (B) (traditional) preserves significantly in relation to hardness. The preserve brand (D) (sugar-free) differed significantly from the others, presenting the lowest mean hardness. This is because the total exclusion of sugar in sugar-free preserves and jellies (Granada et al., 2005) means that even the addition of a gelling agent was unable to ensure a hardness similar to that of traditional preserves.
Table 4 Texture Profile Analysis (TPA) parameters of traditional, low calorie and sugar-free guava preserves.
There was no significant difference in fracturability between brands (B) and (C) and between brands (A) and (E) (Table 4). According to Tang et al. (1998), a gel that easily fractures in the compression cycle is considered to be more brittle than one that breaks at a later time point. A high degree of hardness and low degree of cohesiveness is related to brittleness (Extralab, 2010). Therefore, there was no fracture in sugar-free guava preserve (D).
The adhesion depends on the combined effect of the forces of adhesion and cohesion (Huang et al., 2007). The low calorie guava preserve (C) was the most adhesive (higher absolute adhesive value). This may be due to the type of thickener used in making the product and the presence of bulking agents (polydextrose). The sugar-free guava preserve had the least degree of adhesion; there were no differences between the adhesiveness of guavas preserves (A), (B), (D) and (E), and between (B) and (E).
The characteristic of gumminess describes the force required to chew a semi-solid food (Oliveira et al., 2009). The guava preserve with the lowest mean gumminess was brand (D) (sugar-free), followed by brands (A) and (E), which did not differ significantly. The similarity between brands (A) and (E) may be because the two brands use practically the same ingredients. The brand (C) had a higher gumminess; it is the brand with the highest hardness value because, in addition to the natural pectin in guava, both pectin and sugar were added during its preparation to form a stable gel and the thickener agar-agar.
There was no significant difference between the samples in relation to the springiness parameter. This result indicates that all the samples showed the same behavior during the initial compression, as springiness measures the breaking of the gel structure by the initial compression. Huang et al. (2007) showed that with high springiness the gel structure is broken into a few large pieces; however, a low springiness results in a brittle gel that breaks into many small pieces.
The traditional samples (A, B, and E) did not differ significantly with respect to cohesiveness, presenting the lowest values. Cohesiveness represents how well a sample resists deformation in the second compression cycle compared with the first compression cycle (Ahmed and Ramaswamy, 2006), indicating that in the traditional guava preserve, less work was required for deformation in the second cycle, i.e., the resistance to deformation was lower in the second cycle.
Resilience describes how well a product struggles to regain its original position (deformation) (Yilmaz et al,. 2011). Brands (A), (B) and (E) (traditional) had the highest values, exhibiting no significant differences among the brands.
Regarding the relaxation times (λ1 and λ2), the brands were not significantly different from one another at 5% significance (Table 5).
With regard to the elastic modulus (Ee, E1 and E2) and viscosity (η1 and λ2), there were no significant differences between brands (B) and (C) or among brands (A), (D) and (E) (Table 5). Brands (B) and (C) are more elastic than the other brands, as all their elasticity parameters had higher averages, meaning that the brands are more rigid than the others, since the parameters of elasticity quantify the rigidity of the material (Peleg, 1987; Rodríguez-Sandoval et al., 2009). Brands (A), (D) and (E) had low values of the constants of elastic moduli and viscosity and were a softer product. According to Peleg (1980), the residual stress after a period of relaxation of the test (e.g., 10 min) suggests a measure of the degree of solid food, which is stress related to the value of Ee. The elastic moduli are parameters that can be used to quantify the hardness of a material; therefore, the samples with higher elastic modulus values are the hardest materials. Toledo (2004) studied the rheological properties of banana preserves to test different formulations employing relaxation in which the two-element Maxwell model and a spring in parallel best fit the experimental data. According to the author, the presence of sucrose in the formulation makes the product less elastic and more plastic, noting lower values of the parameters of elasticity for the sucrose formulations. This behavior is observed in this study upon comparing the brands (A) and (E) with brand (D) (without sugar).
It is observed that, although the Peleg model gives a high correlation coefficient (Table 6), the Peleg model is not suitable to discriminate the behavior of the viscoelastic properties of the different samples because there was no significant difference among the brands with respect to k1 and k2. According to Rodriguez-Sandoval et al. (2009), the inverse of the parameter k1 is related to the rate of decay of the initial stress and is a measure of how easily the material deforms.
Table 6 Parameters of stress relaxation of the Peleg model for different brands of traditional, low calorie and sugar-free guava preserves.
There was no significant difference among the brands with respect to the parameter k2 at 5% significance (Table 6). The higher the value of k2, the greater the elastic behavior of the body (Rodriguez-Sandoval et al., 2009).
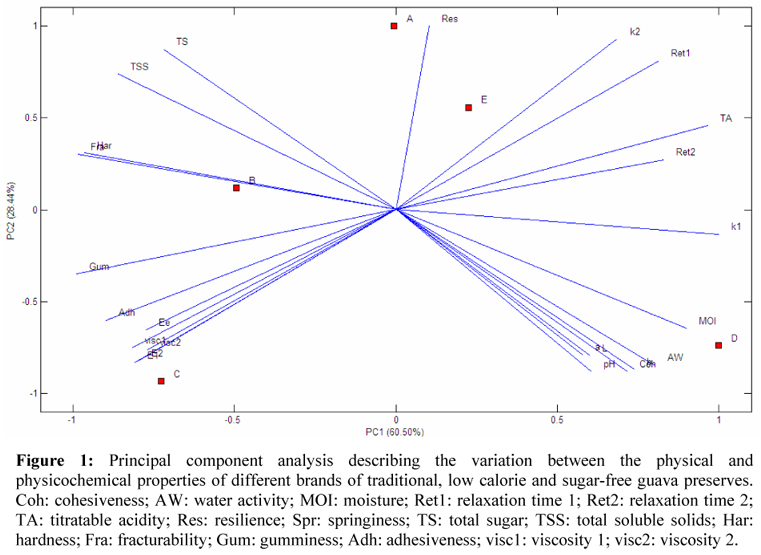
To better understand the differentiation of the samples, a study of multivariate data was conducted. A principal component analysis was chosen to allow a discussion of the results expressed when considering the weight of all the measurements obtained experimentally. Figure 1 presents the graphical results that demonstrate the separation of the samples and the most important variables in this separation.
Figure 1 Principal component analysis describing the variation between the physical and physicochemical properties of different brands of traditional, low calorie and sugar-free guava preserves.
The first principal component (PC1) explains 60.50% of the variance of the model, and the second (PC2) explains 28.44%. Therefore, one can observe three groups (based on the proximity of the brands). First, there is a traditional group of samples (A, B and E), where vectors of parameters of hardness (Har), fracturability (Fra), resilience (Res), springiness (Spr), total soluble solids (TSS), total sugars (TS), k1, k2, relaxation times (and ret1 ret2) and titratable acidity (TA) are in their direction. The second group contains the sample (C) and vectors of viscoelastic properties (Ee, E1, E2, visc1, visc2, Gum and Adh) are in its direction. It is observed that the parameters of viscosity (visc1 and visc2) behave similarly to the parameters of the elastic modulus (Ee, E1 and E2). The final group contains the sample (D), the vectors of the cohesiveness, pH, water activity (aw), moisture (Moi), L*, a* and b* are in its direction and corroborate Tukey's test results.
Table 7 shows that the total titratable acidity (TA) is the physicochemical property that most affects the physical properties because it has the greatest number of significant correlations. The TA was highly negatively correlated with the module of adhesion (adhesiveness is a negative magnitude, so in this study, its absolute value was used to better understand the correlations), gumminess, E1, E2 and η1, indicating that the increased total acidity makes the product more adhesive and less gummy, with more plastic properties. λ1 and k1 were highly positively correlated with the TA, showing that an increase in acidity increases the relaxation time and reduces the k1 elastic characteristics of the products. According to Wang et al. (2002), treatment with acid affects the viscoelastic characteristics of the gels and reduces the elasticity and viscosity parameters in studies of the dynamic viscoelasticity of gels.
Table 7 Pearson correlation coefficients between the physical and physicochemical properties of different traditional, low calorie and sugar-free guava preserves.
CONCLUSION
It can be concluded that there are differences in the physical and physicochemical properties of the different brands studied, and the partial and/or total exclusion of sugar from guava alters its physical and physicochemical properties, making the product redder; even added body and sweetening agents are incapable of conferring properties similar to those of conventional products. Brand D prepared without sugar in the formulation had lower values for the parameters of hardness, adhesiveness and gumminess; absence of fracturability and characterized as soft and low values of the modulus of elasticity and viscosity. Regarding the relaxation test, the Maxwell model was the best for sample discrimination. The results also showed that the samples have a traditional standardization and that the sample labeled "low calorie" has a composition similar to the conventional sample, which is evidence that brand (C) cannot be considered to be low calorie.
(Submitted: December 19, 2011 ; Revised: May 14, 2012 ; Accepted: June 2, 2012)
- Ahmed, J. and Ramaswamy, H. S., physico-chemical properties of commercial date pastes (Phoenix dactylifera). Journal of Food Engineering, 76, 348-352 (2006).
- Association of Official Analytical Chemistry, Official methods of analysis of the association of analytical chemistry. 11th, Ed., p. 115, Washington (1992).
- Bellido, G. G. and Hatcher, D. W., Stress relaxation behaviour of yellow alkaline noodles: Effect of deformation history. Journal of Food Engineering, 93, 460-467 (2009).
- Brasil, Ministério da Saúde, Resolução de Diretoria Colegiada n. 12, de 24 de julho de 1978. Normas Técnicas Relativas a Alimentação e Bebidas. Diário Oficial [da] Republica Federativa do Brasil, Brasília, p. 1-75, 24 dez. (1978). Seção 1. Available at: <http://www.anvisa.gov.br/e-legis/>. (Accessed in: June 21, 2011). (In Portuguese).
- Brasil, Agência Nacional de Vigilância Sanitária – ANVISA. Portaria nº 27, de 13 de janeiro de 1998. Regulamento técnico referente à informação nutricional complementar. Diário Oficial da União, Poder Executivo, de 13 de janeiro de 1998. Available at: http://www.anvisa.gov.br/e-legis/ (Accessed in: July 08, 2011). (In Portuguese).
- Brunini, M. A., Oliveira, A. L. and Varanda, D. B., Quality evaluation of 'Paluma' guava pulp stored at -20 şC. Revista Brasileira de Fruticultura, Jaboticabal, 25(3), 201-207 (2002).
- Campus, M., Addis , M. F., Cappuccinelli, R., Porcu, M. C., Pretti, L., Tedde, V. N., Secchi, N., Stara, G. and Roggio, T., Stress relaxation behaviour and structural changes of muscle tissues from Gilthead Sea Bream (Sparus aurata L.) following high pressure treatment. Journal of Food Engineering, 96, 192-198 (2010).
- Extrabab, B., Program Exponent Lite Express: Version 5.0. Jarinú: TEE32, (2010).
- Ferreira, D. F., Programa Sisvar: Versão 3,04. Lavras: UFLA/DEX (2000). (In Portuguese).
- Freire, M. T. A., Petrus, R. R., Hashida, J. C. and Favaro-Trindade, C. S., Physical, chemical and sensory evaluation of guava sweetened puree in plastic squeezable packaging. Brazilian Journal of Food Technology, 12(3), 172-180 (2009).
- Funami, T., Next target for food hydrocolloids studies: Texture design of foods using hydrocolloids technology. Food Hydrocolloids, 25, 1904-1914 (2011).
- Gama, J. J. T., Efeito do processo de obtenção do catchup sobre seus compostos antioxidantes, capacidade sequestrante do radical DPPH e cor. Tese (Doutorado em Alimentos e Nutrição), Universidade Estadual Paulista, Araraquara, p. 180 (2008). (In Portuguese).
- Granada, G. G., Zambiazi, R. C., Mendonça, C. R. B. and Silva, E., Physical, chemical, microbiological and sensory characterization of light jellies of pineapple. Ciência e Tecnologia de Alimentos, Campinas, 25(4), 629-635 (2005).
- Huang, M., Kennedy, J. F., Li, B., Xu, X. and Xie, B. J., Characters of rice starch gel modified by gellan, carrageenan and glucomannan: A texture profile analysis study. Carbohydrate Polymers, Barking, 69(3), 411-418 (2007).
- Instituto Adolfo Lutz, Normas Analíticas do Instituto Adolfo Lutz: Métodos químicos e físicos para análise de alimentos. 3Ş, Ed. São Paulo, p. 533 (1985). (In Portuguese).
- Jackix, M. H., Doces, Geléias e Frutas em Calda. São Paulo, Ícone, p. 158 1988). (In Portuguese).
- Lau, M. H., Tang, J. and Swanson, B. G., Kinetics of textural and colour changes in green asparagus during thermal treatments. Journal of Food Engineering, 45(4), 231-236 (2000).
- Licodiedoff, S., Influência do teor de pectinas comerciais nas características físico-químicas e sensoriais da geléia de abacaxi (Ananas comosus (L.) Merrill). Dissertação (Mestrado em Tecnologia de Alimentos), Universidade Federal do Paraná, Curitiba, p. 119 (2008). (In Portuguese).
- Menezes, C. C., Borges, S. V., Cirillo, M. A., Ferrua, F. Q., Oliveira, L. F. and Mesquita, K. S., Physical and physicochemical characterisation of different formulations of guava preserve (Psidium guajava, L.) from Pedro Sato cultivar. Ciência e Tecnologia de Alimentos, 29(3), 618-625 (2009).
- Moraes, J. A., Como montar e operar uma pequena fábrica de doces e geléias. Viçosa, MG, Centro de Produções Técnicas, (Manual, n. 207) p. 101 (2000). (In Portuguese).
- Nobile, M. A., Chillo, S., Mentana, A. and Baiano, A., Use of the generalized Maxwell model for describing the stress relaxation behavior of solid-like foods. Journal of Food Engineering, 78, 978-983 (2007).
- Oliveira, L. F., Borges, S. V., Nascimento, J., Cunha, A. C., Jesus, T. B., Pereira, P. A. P., Pereira, A. G. T., Figueiredo, L. P. and Valente, W. A., Use of banana peel in the manufacture of sweet banana-mass quality assessment. Alimentos e Nutrição, Araraquara, 20(4), 581-589 (2009).
- Padula, M. and Rodriguez-Amaya, D. B., Changes in individual carotenoids and vitamin C on processing and storage of guava juice. Acta Alimentaria, 16(3), 209-216 (1987).
- Peleg, M., Characterization of the stress relaxation curves foods. Journal of Food Science, 44, 277-281 (1979).
- Peleg, M., Linearization of relaxation and creep curves curves of solid biological materials. Journal of Rheology, 24, 451-463 (1980).
- Peleg, M., The basics of solid foods rheology. In: H. R. Moskowitz, (Ed.), Food Texture: Instrumental and Sensory Measurement. New York, NY, Marcel Dekker Inc., 3-33 (1987).
- Peleg, M. and Normand, M. D., Comparison of two methods for stress relaxation data presentation of solid foods. Rheological Acta, 22, 108-113 (1983).
- Queiroz, V. A. V., Berbert, P. A., Molina, A. B. de, Gravina, G. A., Queiroz, L. R. and Deliza, R., Osmotic dehydration and convective drying of guava. Pesquisa Agropecuária Brasileira, Brasília, 42(10), 1479-1486 (2007).
- Rahman, M. S. and Al-Farsi, S. A., Instrumental texture analysis (TPA) of date flesh as a function of moisture content. Journal of Food Engineering, 66, 505-511 (2005).
- Rodríguez-Sandoval, E., Fernández-Quintero, A. and Cuvelier, G., Stress relaxation of reconstituted cassava dough. Food Science and Technology, 42, 202-206 (2009).
- Sandrou, D. K. and Arvanitoyannis, I. S., Low fat/calorie foods: Current state and perspectives. Critical Reviews in Food Science and Nutrition, 40(5), 427-447 (2000).
- Tang, J., Tung, M. A. and Zeng, Y., Characterization of gellan gels using stress relaxation. Journal of Food Engineering, 38, 279-295 (1998).
- Toledo, P. F., Propriedades reológicas de doce de banana. Dissertação (Mestrado em Engenharia de Alimentos), Universidade Estadual de Campinas, Campinas, p. 76 (2004). (In Portuguese).
- Yilmaz, M. T., Karaman, S., Dogan, M., Yetim, H. and Kayacier, A., Characterization of O/W model system meat emulsions using shear creep and creep recovery tests based on mechanical simulation models and their correlation with texture profile analysis (TPA) parameters. Journal of Food Engineering, DOI: 10.1016/j.jfoodeng. 2011.08.005 (2011).
- Wang, Y. J., Truong, V. D. and Wang, L., Structures and rheological properties of corn starch as affected by acid hydrolysis. Carbohydrate Polymers, 52, 327-333 (2002).
- Zambiazi, R. C., Chim, J. F. and Bruscatto, M., Evaluation of characteristics and stability of light strawberry jam. Alimentos e Nutrição, 17(2), 165- 170 (2006).
Publication Dates
-
Publication in this collection
03 Sept 2013 -
Date of issue
Sept 2013
History
-
Received
19 Dec 2011 -
Accepted
02 June 2012 -
Reviewed
14 May 2012