Abstract
The correlation of thermodynamic properties of nonaqueous electrolyte solutions is relevant to design and operation of many chemical processes, as in fertilizer production and the pharmaceutical industry. In this work, the Q-electrolattice equation of state (EOS) is used to model vapor pressure, mean ionic activity coefficient, osmotic coefficient, and liquid density of sixteen methanol and ten ethanol solutions containing single strong 1:1 and 2:1 salts. The Q-electrolattice comprises the lattice-based Mattedi-Tavares-Castier (MTC) EOS, the Born term and the explicit MSA term. The model requires two adjustable parameters per ion, namely the ionic diameter and the solvent-ion interaction energy. Predictions of osmotic coefficient at 298.15 K and liquid density at different temperatures are also presented.
Keywords:
Methanol; Ethanol; Electrolytes; Equation of state
INTRODUCTION
Electrolyte solutions are broadly found in many natural and industrial processes. Most of them deal with solutions containing salts dissolved in water, such as seawater desalination and wastewater treatment. However, in fertilizer production, pharmaceutical industries, and in equipment such as absorption, distillation, and extraction, nonaqueous electrolyte solutions play an important role. The correlation and prediction of their thermodynamic properties are essential to the design and operation of these equipments and processes.
There are few publications about models applied to correlate thermodynamic properties of nonaqueous single salt solutions, possibly because of the limited experimental data available for such systems. Some of the available models are based on the Gibbs excess energy. Chou and Tanioka (1997)Chou, T.-J. and Tanioka, A., A vapor pressure model for aqueous an non-aqueous solutions of single and mixed electrolyte systems. Fluid Phase Equilib., 137, 17-32 (1997). used a modified Debye-Hückel equation to account for long-range interactions and the concept of solvation to account for short-range interactions. The two-parameter model was used to correlate vapor pressure of twenty-four single salt solutions containing solvents such as methanol, ethanol, 2-propanol, acetonitrile, and isopentyl alcohol; Ge et al. (2008)Ge, X., Zhang, M., Guo, M. and Wang, X., Correlation and prediction of thermodynamics properties of electrolytes by the modified TCPC model. J. Chem. Eng. Data, 53, 149-159 (2008). applied the three-characteristic-parameter correlation (TCPC) model to 46 single salts in methanol, ethanol, 2-propanol, N-methyformamide, and acetonitrile in order to correlate mean ionic activity coefficient, osmotic coefficient, and solvent activity.
On the other hand, equations of state (EOSs) have also been used to determine thermodynamic properties of electrolyte solutions in nonaqueous solvents. Zuo and Fürst (1997)Zuo, Y.-X. and Fürst, W., Prediction of vapor pressure for nonaqueous electrolyte solutions using an electrolyte equation of state. Fluid Phase Equilib., 138, 87-104 (1997). applied an EOS constituted of four terms (one repulsive term, two attractive short-range terms, and one long-range term) to correlate vapor pressures and mean ionic activity coefficients of single salts in methanol, ethanol, 2-propanol, and acetonitrile solutions. Held et al. (2012)Held, C., Prinz, A., Wallmeyer, V. and Sadowski, G., Measuring and modeling alcohol/salt systems. Chem. Eng. Sci., 68, 328-339 (2012). employed the ePC-SAFT EOS in order to correlate liquid densities, osmotic coefficients, and mean ionic activity coefficients at 298.15 K of single salts in methanol and ethanol solutions, presenting also new experimental data for many electrolyte systems.
In this work, the Q-electrolattice EOS, which has been successfully applied to aqueous single and mixed salt solutions (Zuber et al., 2014Zuber, A., Checoni, R. F. and Castier, M., Thermodynamic properties of aqueous solutions of multiple salts using the Q-electrolattice equation of state. Fluid Phase Equilib., 362, 268-280 (2014).), is used to correlate thermodynamic properties of single salts in methanol and ethanol solutions. This model consists of the lattice-based Mattedi-Tavares-Castier (MTC) EOS, along with the Born and explicit MSA terms. In this EOS, the cation and anion diameters are fitted, as well as the energetic effects presented by interactions between solvent - cations, or - anions. A model performance analysis is presented based on the correlations of the thermodynamics properties of sixteen methanol and ten ethanol solutions containing single strong 1:1 and 2:1 salts.
Q-ELECTROLATTICE EQUATION OF STATE
The Q-electrolattice EOS was developed considering a methodology proposed by Myers et al. (2002)Myers, J. A., Sandler, S. I. and Wood, R. H., An equation of state for electrolyte solutions covering wide ranges of temperature, pressure, and composition. Ind. Eng. Chem. Res., 41, 3282-3297 (2002).. For that, the interactions between species in an electrolyte mixture are taken into account by adding the contribution of different terms to the Helmholtz energy. This sum is the result of a thermodynamic path suitable to describe the behavior of electrolyte solutions accurately. The residual Helmholtz energy ( AR ) to form an electrolyte solution along the mentioned path is:

in which the ΔAMTC term is the contribution to the Helmholtz energy related to the repulsive and attractive effects proposed originally by Mattedi et al. (1998)Mattedi, S., Tavares, F. W. and Castier, M., Group contribution equation of state based on the lattice fluid theory: Alkane-alkanol systems. Fluid Phase Equilib., 142, 33-54 (1998).; the ΔABorn term represents the contribution to the short-range interactions associated with the solvation effects; and the ΔAMSA term represents the long-range interactions due to the presence of electrolytes in the solution (Blum, 1988Blum, L., Simple method for the computation of thermodynamic properties of electrolytes in the mean spherical approximation. J. Phys. Chem., 92, 2969-2970 (1988).; Clarke and Bishnoi, 2004Clarke, M. A. and Bishnoi, P. R., Development of a new equation of state for mixed salt and mixed solvent systems, and application to vapour-liquid and solid (hydrate)-vapour-liquid equilibrium calculations. Fluid Phase Equilib., 220, 21-35 (2004).; Baseri and Lotfallahi, 2011Baseri, H. and Lotfollahi, M. N., Modification of Peng Robinson EOS for modelling (vapor + liquid) equilibria with electrolyte solutions. J. Chem. Thermodyn., 43, 1535-1540 (2011).). The complete development of each term of the Q-electrolattice EOS can be found in detail elsewhere (Zuber et al., 2014Zuber, A., Checoni, R. F. and Castier, M., Thermodynamic properties of aqueous solutions of multiple salts using the Q-electrolattice equation of state. Fluid Phase Equilib., 362, 268-280 (2014).).
The dielectric constant is present in both Born and MSA terms in the Q-electrolattice EOS. Its evaluation is performed by coupling the Pottel model for dielectric constant presented by Zuo and Fürst (1997)Zuo, Y.-X. and Fürst, W., Prediction of vapor pressure for nonaqueous electrolyte solutions using an electrolyte equation of state. Fluid Phase Equilib., 138, 87-104 (1997). to the EOS. This model takes into account the change in the dielectric constant of the solvent due to the presence of electrolytes. The dielectric constant of the solvent is expressed in the form of a polynomial equation, for temperatures in Kelvin, as follows:

in which DS is the pure solvent dielectric constant, and d1- d5 are parameters.
The parameters of Eq. (2) are presented in Table 1. For ethanol, the parameters are equal to those presented by Zuo and Fürst (1997)Zuo, Y.-X. and Fürst, W., Prediction of vapor pressure for nonaqueous electrolyte solutions using an electrolyte equation of state. Fluid Phase Equilib., 138, 87-104 (1997).. For methanol, new parameters have been obtained based on the experimental dielectric constant presented by Davidson (1957)Davidson, D. W., The dielectric properties of methanol and methanol-D. Can. J. Chem., 35, 458-473 (1957). and Shirke et al. (2000)Shirke, R. M., Chaudhari, A., More, N. M. and Patil, P. B., Dielectric measurements on methyl acetate + alcohol mixtures at (288, 298, 308, and 318) K using the time domain technique. J. Chem. Eng. Data, 45, 917-919 (2000)., in a temperature range from 176.60 to 318.15 K. The average absolute relative deviation (AARD(%)) for dielectric constant of methanol obtained with the new set of parameters is 1.81%.
RESULTS AND DISCUSSION
Pure Solvents
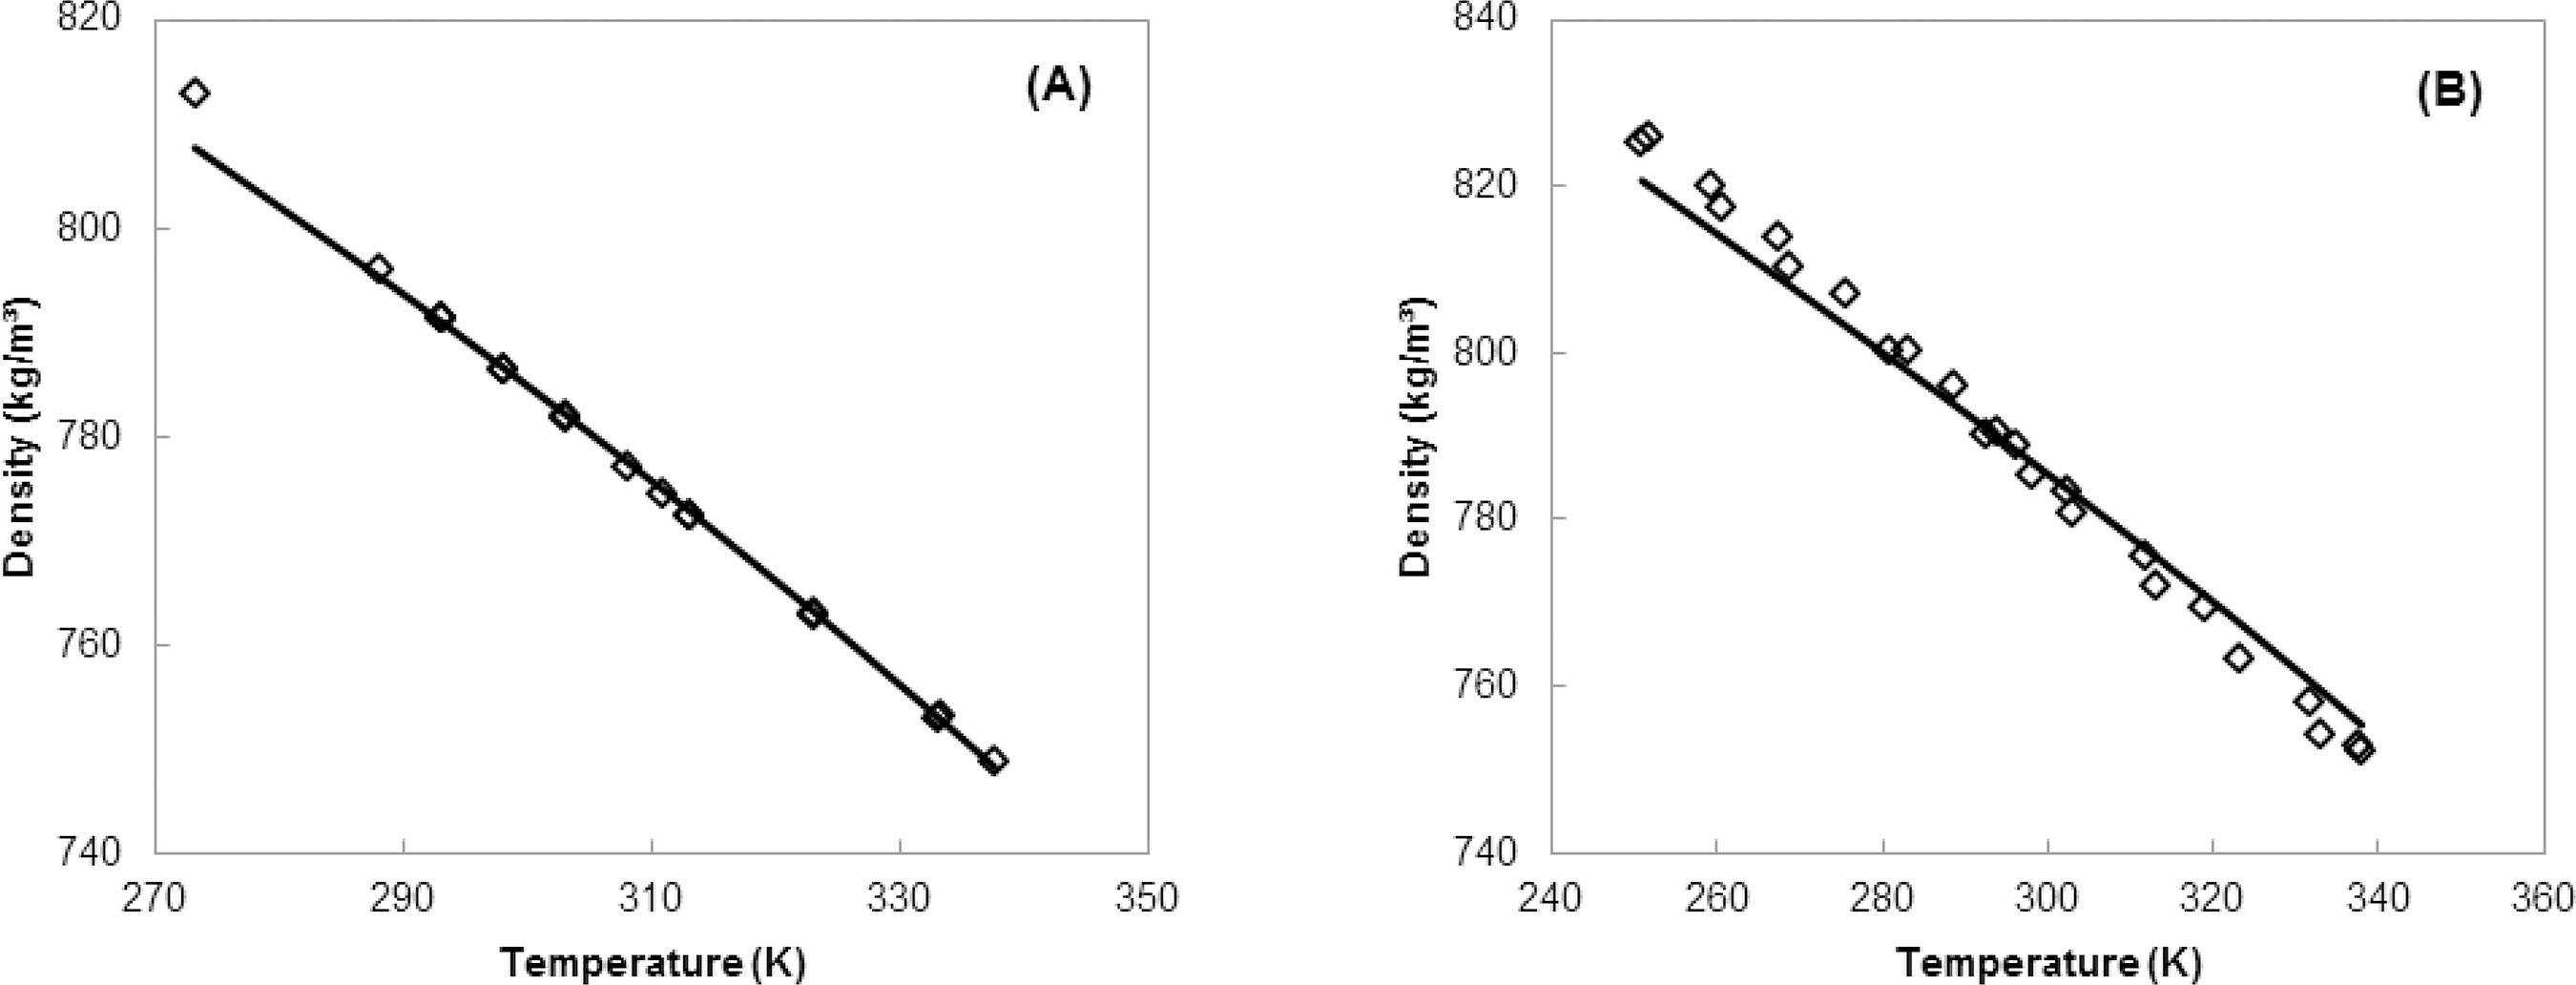
The methanol and ethanol representations applied in this work are similar to the water representation used by Zuber et al. (2014)Zuber, A., Checoni, R. F. and Castier, M., Thermodynamic properties of aqueous solutions of multiple salts using the Q-electrolattice equation of state. Fluid Phase Equilib., 362, 268-280 (2014)., in which the solvent molecule is divided into three regions: an electrondonor (α), an electron-acceptor (β), and a dispersion group (D). The solvent parameters were obtained by simultaneous regression of vapor pressure and liquid density data using the MTC EOS. It is important to stress that these parameters were obtained in this way because the Q-electrolattice EOS reduces to the MTC EOS in the absence of electrolytes. The average absolute relative deviations of vapor pressure for methanol and ethanol are 0.60% (258.54 - 513.15 K) and 2.25% (269.85 - 507.49 K), respectively; the deviations for liquid density are 0.07% (273.15 - 337.65 K) and 0.35% (250.85 - 337.95 K), respectively. Table 2 presents the solvent parameters. Figures 1 and 2 also present the behavior correlated by the MTC EOS for such properties for both pure solvents.
Correlation of vapor pressure of pure methanol (A) and pure ethanol (B): MTC EOS (-) and experimental data (○).
Correlation of liquid density of pure methanol (A) and pure ethanol (B): MTC EOS (-) and experimental data (○).
Figure 1 shows that the vapor pressures of pure methanol (Ramsay and Young, 1887Ramsay, W. and Young, S., Studien über verdampfung A. Zuber, R. F. Checoni and M. Castier und dissociation. Z. Phys. Chem., (Leipzig) 1, 237258 (1887). (In German).; Young, 1909Young, S., The vapour-pressures, specific volumes, heats of vaporization, and critical constants of thirty pure substances. Sci. Proc. Roy. Dublin Soc., 522, 374-443 (1909).) and pure ethanol (Richardson, 1886Richardson, A., Determinations of vapour-pressures of alcohols and organic acids, and the relations existing between the vapour-pressures of the alcohols and organic acids. J. Chem. Soc. London, 19, 761-776 (1886).; Kalafati et al., 1967Kalafati, D. D., Rasskazov, D. S. and Petrov, E. K., Experimental study of p,v,t - dependence of ethanol. Teploenergetika, 638, 77-81 (1967).; Mousa, 1987Mousa, A. H. N., Critical properties, heat of vaporization and vapour pressure of ethanol from 20 kPa to the critical point. J. Chem. Eng. Japan, 52, 635-637 (1987).; Diogo et al. 1995Diogo, H. P., Santos, R. C., Nunes, P. M. and Piedade, M. E. P., Ebulliometric apparatus for the measurement of enthalpies of vaporization. Thermochim. Acta, 315, 113-120 (1995).; Khoiroh and Lee, 2011Khoiroh, I. and Lee, M.-J., Isothermal (vapour + liquid) equilibrium for binary mixtures of polyethylene glycol mono-4-nonylphenyl ether (PEGNPE) with methanol, ethanol, or 2-propanol.J. Chem. Thermodyn., 155, 1417-1423 (2011).) are in good agreement with the experimental data in the studied temperature range. Figure 2 shows that the methanol liquid density (Gmehling, 2012Gmehling, J. Dortmund Data Bank. Software. Version 2012.) tends to be underestimated at temperatures below 290 K, while for the ethanol (Gmehling, 2012Gmehling, J. Dortmund Data Bank. Software. Version 2012.) this occurs below 280 K. In addition, the ethanol liquid density is slightly overestimated above 300 K.
Single Salt Nonaqueous Solutions
The Q-electrolattice EOS uses two adjustable parameters per ion to calculate many thermodynamic properties of electrolyte solutions. These parameters are the ion-solvent interaction energy and the ionic diameter. Many assumptions lead to reducing the number of parameters of the Q-electrolattice to only two. One of them is that the interactions between solvent regions (α, β, D) and a given ion are equivalent. A complete description of the assumptions is available elsewhere (Zuber et al., 2014Zuber, A., Checoni, R. F. and Castier, M., Thermodynamic properties of aqueous solutions of multiple salts using the Q-electrolattice equation of state. Fluid Phase Equilib., 362, 268-280 (2014).). They are also used in this work to fit the parameters of nonaqueous electrolyte solutions.
Three thermodynamic properties are used to fit the adjustable parameters of the Q-electrolattice EOS: experimental mean ionic activity coefficients and liquid densities, both at 298.15 K, and vapor pressure data at various temperatures, of single strong electrolytes in methanol or ethanol solutions.
The fitting procedure is based on the simultaneous correlation of these three thermodynamic properties of several single salt solutions. For methanol, sixteen systems (salt + solvent) formed by six cations (Li+, Na+, K+, Rb+, Cs+, Ca2+) and five anions (Cl-, Br-, I-, NO3-, ClO4-) are used; for ethanol, 10 systems formed by four cations (Li+, Na+, K+, Ca2+) and four anions (Cl-, Br-, I-, NO3-) are considered. The adjustable parameters of the Q-electrolattice EOS are determined by minimizing the objective function (OF):

in which Picalc, yi±calc, ρicalc denote the calculated values of vapor pressure, mean ionic activity coefficient, and density, respectively, Piexp, yi±exp, ρiexp are the values of their experimental counterparts, and Np is the number of points.
Table 3 presents the Q-electrolattice adjustable parameters for the ions in the investigated solutions. For both solvents, the diameters of alkali ions increase according to the sequence in the periodic table. It is also noteworthy that the alkali ions in ethanol are larger than in methanol. For monoatomic anions, only the diameters in ethanol follow the trend of the periodic table. For the polyatomic anion NO3-, it can be observed that its fitted diameter is larger in ethanol than in methanol. Also, the energy interaction parameters increase with increasing diameters for alkali ions in both solvents.
Table 4 shows the Pauling's bare ion diameters, and the fitted ionic diameters for use with the Q-electrolattice EOS in aqueous solutions (Zuber et al., 2014Zuber, A., Checoni, R. F. and Castier, M., Thermodynamic properties of aqueous solutions of multiple salts using the Q-electrolattice equation of state. Fluid Phase Equilib., 362, 268-280 (2014).) and in methanol or ethanol solutions (present work). The diameters of alkali metals increase in the order (Li+<Na+<K+) in all cases. Similar trend is observed for halides (Cl-<Br-<I-), with exception of I- in methanol, whose diameter is smaller than Br-.
Comparison of fitted diameters of some solvated ions in water (Zuber et al., 2014Zuber, A., Checoni, R. F. and Castier, M., Thermodynamic properties of aqueous solutions of multiple salts using the Q-electrolattice equation of state. Fluid Phase Equilib., 362, 268-280 (2014).), metha-nol, and ethanol (present work) using the Q-electrolattice EOS. Pauling diameters of bare ions are presented as reference.
For all the cations in Table 4, it is observed that Monica and Senatore, 1970Monica, M. D. and Senatore, L., Solvated radius of ions in nonaqueous solvents. J. Phys. Chem., 74, 205-207 (1970).; Zipp, 1974Zipp, A. P., Solvation numbers in nonaqueous solvents. J. Phys. Chem., 78, 556-557 (1974).; Marcus, 1991Marcus, Y., Thermodynamics of solvation of ions. Part 5. Gibbs free energy of hydration at 298.15 K. J. Chem. Soc. Faraday Trans., 87, 2995-2999 (1991).), the diameters of ions in solution should follow the trend: -, are smaller than in water. but there is no similar trend for the anions. According to the literature (
 . However, all the fitted ion diameters in methanol, except Cl
On average, the fitted diameters of the cations in water and ethanol solutions are 31% and 146% larger than Pauling's diameters; in methanol solutions, they are 53% smaller. The fitted anion diameters in water, methanol, and ethanol, are 25%, 46%, and 29% smaller than Pauling's diameters. These results suggest that the effect of the solvent on cation diameter is bigger than on anion diameter. Regardless of this observation, our experience with the Q-electrolattice EOS is that fitting the ion diameters is important to the overall model accuracy.
Table 5 presents the correlated vapor pressure, mean ionic activity coefficients at 298.15 K, and densities of nonaqueous solutions containing strong electrolytes. It also contains the calculations of osmotic coefficients at 298.15 K. To calculate the average absolute relative deviation (AARD(%)) of such thermodynamic properties, the following equation is used:
Average absolute relative deviation (AARD (%)) for the vapor pressure, mean ionic activity coefficient (MIAC), density, and osmotic coefficient (OC) of solutions containing strong electrolytes in methanol and ethanol determined by Q-electrolattice EOS.

In Eq. (4), valcalc is the calculated value for vapor pressure, mean ionic activity coefficient, or density obtained by the Q-electrolattice EOS; valexp is the experimental value of the same thermodynamic property obtained from the literature.
Table 5 shows that the Q-electrolattice EOS is able to correlate vapor pressures satisfactorily in both methanol and ethanol solutions, with most deviations below 3.0%. An exception is the LiI + ethanol solution, whose vapor pressure AARD value is 10.4%. Furthermore, the model shows accurate results when correlating liquid density at 298.15 K of nonaqueous single salt solutions, with deviations below 2.0% for both solvents.
Figure 3 shows the effect of temperature and salt concentration on the correlated vapor pressures of LiI + ethanol solutions. At low salt concentrations, the calculations with the Q-electrolattice EOS are in good agreement with experimental data, and converge correctly to the vapor pressure of pure ethanol at any temperature. However, the Q-electrolattice EOS underestimates this property at concentrations between 1.0 and 4.0 molal, and overestimates it between 4.0 and 7.0 molal. The deviations found in these intermediate concentrations reach 18.0%, on average. At the maximum available salt concentration (8.62 molal), the deviation between the model's outcomes and experimental data are 20.0%, on average. Regarding temperature, the deviations at a given salt concentration tend to be lower at high temperatures. For example, at 2.7 molal, the deviations at 298.15 and 323.15 K are 18.9% and 16.0%, respectively; at 8.6 molal, they are 21.3% and 18.7%, respectively.
Correlation of vapor pressure of LiI in ethanol using the Q-electrolattice EOS (-) and experimental data (Gmehling, 2012Gmehling, J. Dortmund Data Bank. Software. Version 2012.) at 298.15 K (○), 303.15 K (▲), 308.15 K (□), 313.15 K (●), 318.15 K (∆), and 323.15 K (■).
Table 5 shows that the Q-electrolattice EOS exhibits significant deviations when used to correlate the mean ionic activity coefficient. For methanol solutions, the deviations vary from 5.47% for NaCl to 11.49% for LiCl, whereas for ethanol solutions the deviations are higher, reaching 25.92% for NaBr. The predictions of the osmotic coefficient at 298.15 K for electrolyte solutions of both solvents also exhibit high deviations.
Lack of experimental data for nonaqueoeus electrolyte solutions may have been a reason why the results of mean ionic activity coefficient and osmotic coefficient are not as good as those of vapor pressure and density. The objective function, Eq. (3), adds the squared deviations in vapor pressure, density, and mean ionic activity coefficient. For few salt solutions, all three properties are available; for most of them, experimental data for only one of these properties exist. Additionally, the number of experimental points is considerably larger for vapor pressure than for other properties. This may have led to an error compensation that favored the vapor pressure results.
The deviations between the experimental and calculated values of all thermodynamic properties presented in this work tend to grow as the salt concentration increases. Therefore, we recommend using the Q-electrolattice EOS within the molality range presented in Table 5 for each salt.
The performance of Q-electrolattice EOS is compared to the work of Held et al. (2012)Held, C., Prinz, A., Wallmeyer, V. and Sadowski, G., Measuring and modeling alcohol/salt systems. Chem. Eng. Sci., 68, 328-339 (2012)., in which the ePC-SAFT EOS was used to correlate thermodynamic properties of some similar salts in methanol and ethanol solutions. In general, both EOSs present thermodynamic property deviations of similar magnitude in comparison to experimental data. However, the Q-electrolattice EOS shows slightly better results for liquid density and mean ionic activity coefficient for the solutions of both solvents. On the other hand, it is less accurate than the ePC-SAFT EOS when calculating osmotic coefficient. A major advantage of the present work, compared to the work of Held et al. (2012)Held, C., Prinz, A., Wallmeyer, V. and Sadowski, G., Measuring and modeling alcohol/salt systems. Chem. Eng. Sci., 68, 328-339 (2012)., is the correlation of vapor pressures, whose results are very accurate.
The vapor pressure results of Zuo and Fürst (1997)Zuo, Y.-X. and Fürst, W., Prediction of vapor pressure for nonaqueous electrolyte solutions using an electrolyte equation of state. Fluid Phase Equilib., 138, 87-104 (1997). are generally better than those of this work. However, vapor pressure was the only property they considered for parameter fitting and comparison to experimental data. In addition to vapor pressure, this work focuses on density, mean ionic activity coefficient, and osmotic coefficient. The performance of the Zuo and Fürst (1997)Zuo, Y.-X. and Fürst, W., Prediction of vapor pressure for nonaqueous electrolyte solutions using an electrolyte equation of state. Fluid Phase Equilib., 138, 87-104 (1997). model for predicting those properties is unknown.
Figure 4 shows examples of thermodynamic properties of LiCl in methanol modeled by the Q-electrolattice EOS. In Figure 4(A), the correlated vapor pressure is in good agreement with the experi-mental data in a temperature range from 298.15 to 323.15 K. In Figure 4(B), the mean ionic activity coefficient tends to 1.0 at low concentrations; however, it is underestimated at concentrations above 0.4 molal. In Figure 4(C), the calculated osmotic coefficient, which was not included in the objective function, is underestimated below 2.0 molal; above this concentration, the thermodynamic property is overestimated. In Figure 4(D), although the density of pure methanol is reached at very low salt concentrations, the density of LiCl + methanol solution is slightly overestimated for molalities above 0.1.
Thermodynamic properties of LiCl in methanol modeled with the Q-electrolattice EOS (-) compared to the experimental data: (A) Vapor pressure (Gmehling, 2012) at 298.15 K (○), 303.15 K (▲), 308.15 K (□), 313.15 K (●), 318.15 K (∆), and 323.15 K (■), (B) mean ionic activity coefficient at 298.15 K (○) (Gmehling, 2012), (C) osmotic coefficient at 298.15 K (○) (Gmehling, 2012), and (D) liquid density at 298.15 K (○) (Pasztor and Criss, 1978).
Predictions of liquid density of single salts in methanol or ethanol are presented in Tables 6 and 7, respectively. The predictions have been performed considering the fitted parameters presented in Table 3. Most of the experimental data used in these calculations were obtained in papers whose focus was on the evaluation of apparent molar volume of salt. This thermodynamic property can be easily converted to liquid density by using an appropriate equation. The density predictions are performed at temperatures from 283.15 K to 323.15 K, and molalities up to 4.50 molal for both solvents. In general, they are in good agreement with the experimental data since the highest deviations are 2.04% for LiClO4 in methanol and 1.72% for NaI in ethanol. Additionally, the deviations of liquid density for a given salt in methanol or ethanol tend to increase at higher temperatures. As an example, the deviation obtained for NaClO4 in methanol at 283.15 K is 0.72%, whereas at 308.15 K it is 0.84%.
Average absolute relative deviation (AARD (%)) for the liquid density of Solutions containing a single salt in methanol using the Q-electrolattice EOS.
Average absolute relative deviation (AARD (%)) for the liquid density of solutions containing a single salt in ethanol using the Q-electrolattice EOS.
CONCLUSION
In this study, the Q-electrolattice equation of state was applied to model electrolyte solutions whose solvent is methanol or ethanol. Thermodynamic properties of sixteen methanol and ten ethanol single salt solutions were obtained using two adjustable parameters per ion, namely the ionic diameter and the solvent-ion interaction energy. Particularly for the cations, the parameters exhibit some reasonable trends related to the solvation phenomenon. Vapor pressure and density are correlated satisfactorily by using the Q-electrolattice equation of state. Correlated mean ionic activity coefficients and predicted osmotic coefficients have larger deviations compared to the other thermodynamic properties. Predictions of liquid density at temperatures different than 298.15 K are in good agreement with experimental data.
ACKNOWLEDGMENT
A. Z. acknowledges the financial support of the following Brazilian agency: Coordenação de Aperfeiçoamento de Pessoal de Nível Superior (CAPES).
REFERENCES
- Barthel, J., Neueder, R., Poepke, H. and Wittmann, H., Osmotic and activity coefficients of nonaqueous electrolyte solutions. 1. Lithium perchlorate in the protic solvents methanol, ethanol, and 2-propanol. J. Solution Chem., 27, 1055-1066 (1998).
- Baseri, H. and Lotfollahi, M. N., Modification of Peng Robinson EOS for modelling (vapor + liquid) equilibria with electrolyte solutions. J. Chem. Thermodyn., 43, 1535-1540 (2011).
- Blum, L., Simple method for the computation of thermodynamic properties of electrolytes in the mean spherical approximation. J. Phys. Chem., 92, 2969-2970 (1988).
- Chou, T.-J. and Tanioka, A., A vapor pressure model for aqueous an non-aqueous solutions of single and mixed electrolyte systems. Fluid Phase Equilib., 137, 17-32 (1997).
- Clarke, M. A. and Bishnoi, P. R., Development of a new equation of state for mixed salt and mixed solvent systems, and application to vapour-liquid and solid (hydrate)-vapour-liquid equilibrium calculations. Fluid Phase Equilib., 220, 21-35 (2004).
- Davidson, D. W., The dielectric properties of methanol and methanol-D. Can. J. Chem., 35, 458-473 (1957).
- Diogo, H. P., Santos, R. C., Nunes, P. M. and Piedade, M. E. P., Ebulliometric apparatus for the measurement of enthalpies of vaporization. Thermochim. Acta, 315, 113-120 (1995).
- Ge, X., Zhang, M., Guo, M. and Wang, X., Correlation and prediction of thermodynamics properties of electrolytes by the modified TCPC model. J. Chem. Eng. Data, 53, 149-159 (2008).
- Glugla, P. G., Byon, J. H. and Eckert, C. A., Partial molar volume of some monovalent salts and polar molecules in organic solvents. J. Chem. Eng. Data, 27, 393-398 (1982).
- Gmehling, J. Dortmund Data Bank Software. Version 2012.
- Held, C., Prinz, A., Wallmeyer, V. and Sadowski, G., Measuring and modeling alcohol/salt systems. Chem. Eng. Sci., 68, 328-339 (2012).
- Kalafati, D. D., Rasskazov, D. S. and Petrov, E. K., Experimental study of p,v,t - dependence of ethanol. Teploenergetika, 638, 77-81 (1967).
- Khoiroh, I. and Lee, M.-J., Isothermal (vapour + liquid) equilibrium for binary mixtures of polyethylene glycol mono-4-nonylphenyl ether (PEGNPE) with methanol, ethanol, or 2-propanol.J. Chem. Thermodyn., 155, 1417-1423 (2011).
- Marcus, Y., Thermodynamics of solvation of ions. Part 5. Gibbs free energy of hydration at 298.15 K. J. Chem. Soc. Faraday Trans., 87, 2995-2999 (1991).
- Mattedi, S., Tavares, F. W. and Castier, M., Group contribution equation of state based on the lattice fluid theory: Alkane-alkanol systems. Fluid Phase Equilib., 142, 33-54 (1998).
- Monica, M. D. and Senatore, L., Solvated radius of ions in nonaqueous solvents. J. Phys. Chem., 74, 205-207 (1970).
- Mousa, A. H. N., Critical properties, heat of vaporization and vapour pressure of ethanol from 20 kPa to the critical point. J. Chem. Eng. Japan, 52, 635-637 (1987).
- Myers, J. A., Sandler, S. I. and Wood, R. H., An equation of state for electrolyte solutions covering wide ranges of temperature, pressure, and composition. Ind. Eng. Chem. Res., 41, 3282-3297 (2002).
- Pasztor, A. J. and Criss, C. M., Apparent molal volume and heat-capacities of some 1-1 electrolytes in anhydrous methanol at 25-degree-C. J. Sol. Chem., 7, 27-44 (1978).
- Ramsay, W. and Young, S., Studien über verdampfung A. Zuber, R. F. Checoni and M. Castier und dissociation. Z. Phys. Chem., (Leipzig) 1, 237258 (1887). (In German).
- Richardson, A., Determinations of vapour-pressures of alcohols and organic acids, and the relations existing between the vapour-pressures of the alcohols and organic acids. J. Chem. Soc. London, 19, 761-776 (1886).
- Shirke, R. M., Chaudhari, A., More, N. M. and Patil, P. B., Dielectric measurements on methyl acetate + alcohol mixtures at (288, 298, 308, and 318) K using the time domain technique. J. Chem. Eng. Data, 45, 917-919 (2000).
- Takenaka, N., Takemura, T. and Sakurai, M., Partial molar volumes of uni-univalent electrolytes in methanol + water. 1. Lithium chloride, sodium chloride, and potassium chloride. J. Chem. Eng. Data, 39, 207-213 (1994a).
- Takenaka, N., Takemura, T. and Sakurai, M., Partial molal volumes of uni-univalent electrolytes in methanol + water. 2. Sodium bromide and potassium Bromide. J. Chem. Eng. Data, 39, 796-801 (1994b).
- Takenaka, N., Takemura, T. and Sakurai, M., Partial molal volumes of uni-univalent electrolytes in methanol + water. 3. Sodium iodide and potassium iodide. J. Chem. Eng. Data, 39, 802-807 (1994c).
- Wawer, J., Krakowiak, J. and Grzybkowski, W., Apparent molar volumes, expansibilities, and isentropic compressibilities of selected electrolytes in methanol. J. Chem. Thermodynamics, 40, 1193-1199 (2008).
- Young, S., The vapour-pressures, specific volumes, heats of vaporization, and critical constants of thirty pure substances. Sci. Proc. Roy. Dublin Soc., 522, 374-443 (1909).
- Zipp, A. P., Solvation numbers in nonaqueous solvents. J. Phys. Chem., 78, 556-557 (1974).
- Zuber, A., Checoni, R. F. and Castier, M., Thermodynamic properties of aqueous solutions of multiple salts using the Q-electrolattice equation of state. Fluid Phase Equilib., 362, 268-280 (2014).
- Zuo, Y.-X. and Fürst, W., Prediction of vapor pressure for nonaqueous electrolyte solutions using an electrolyte equation of state. Fluid Phase Equilib., 138, 87-104 (1997).
Publication Dates
-
Publication in this collection
Jul-Sep 2015
History
-
Received
26 Mar 2014 -
Reviewed
25 Sept 2014 -
Accepted
01 Oct 2014