
ABSTRACT
For foresters, it is sometimes required to estimate the diameter at breast height of tree that has been cut, though it is often only the stump that is available as an indicator of size, after illegal logging and quick removal of the cut trees from the forest. In this study, equations for predicting the diameter at breast height, were fit specifically for Quercus frainetto in the region of Evros in northeastern Greece. The selected equations (quadratic model) were, where  is the estimated diameter at breast height d (cm), and dst is the measured diameter at stump height (cm);
  for pure stands (R2 = 0.94);
  for mixed stands (R2 = 0.92);
 for the whole forest (R2 = 0.94).
Keywords:
Diameter at breast heigh; Diameter at stump height; Regression estimation
RESUMO
Para silvicultores, às vezes é necessário estimar o diâmetro à altura do peito de árvores cortadas, embora muitas vezes é somente o toco que está disponível como um indicador do tamanho, após a extração ilegal de madeira e remoção rápida das árvores cortadas da floresta. Neste estudo, equações para estimar o diâmetro à altura do peito foram ajustados especificamente para Quercus frainetto na região de Evros no nordeste da Grécia. As equações selecionadas (modelo quadrático) foram:  para talhões puros (R2 = 0.94);
  para talhões mistos (R2 = 0.92);
  para a floresta toda (R2 = 0.94), onde
  é o diâmetro estimado na altura do peito (cm), e dst é o diâmetro medido na altura do toco (cm).
Palavras chave:
Diâmetro à altura do peito; Diâmetro à altura do toco; Estimativa por regressão
INTRODUCTION
The most important variable to take into consideration regarding to forestry is tree diameter at breast height. Not only it is used to estimate the volume of the tree, but also as a way to describe the stand structure and to select an inventory sample. When a tree has been cut down, and the only thing that remains to indicate its former size is the stump, it becomes necessary to use these dimensions to predict the diameter and volume. Examples include (1) when the timber has already been harvested in the final cut or thinned, (2) when checking the harvesting practices after tree removal, (3) determining the loss of volume due to illegal cutting, (4) assessing the damage that results from environmental disturbances, and (5) tracing history of the cutover stands (MCCLURE 1968MCCLURE, J. 1968. Predicting tree dbh from stump measurements in the southeast. USDA Forest Service, South Eastern Forest Experiment Station, Research Note SE-99. 60pp., BYLIN 1982BYLIN, C. 1982. Volume prediction from stump diameter and stump height of selected species in Louisiana. USDA Forest Service, Southern Forest Experiment Station, Research Paper SO-182. 11pp., KOZAK and OMULE 1982KOZAK, A., OMULE, S. 1992. Estimating stump volume, stump inside bark diameter and diameter at breast height from stump measurements. The Forestry Chronicle 68(5): 623-627., WHARTON 1984WHARTON, E. 1984. Predicting diameter at breast height from stump diameters for the northeastern tree species. USDA Forest Service, North Eastern Forest Experiment Station, Research Note NE-322. 4pp., KHATRY CHHETRI and FOWLER 1996KHATRY CHHETRI, D., FOWLER, G. 1996. Estimating diameter at breast height and basal diameter of trees from stump measurements in Nepal's lower temperate broad-leaved forests. Forest Ecology And Management 81(1-3): 75-84., CORRAL-RIVAS et al. 2007CORRAL-RIVAS, J., BARRIO-ANTA, M., AGUIRRE-CALDERON, O., DIEGUEZ-ARANDA, U. 2007. Use of stump diameter to estimate diameter at breast height and tree volume for major pine species in El Salto, Durango (Mexico). Forestry 80(1): 29-40., ÖZÇELÍK et al. 2010ÖZÇELÍK, R., BROOKS, J., DIAMANTOPOULOU, M., WIANT, H. 2010. Estimating breast height diameter and volume from stump diameter for three economically important species in Turkey. Scandinavian Journal Of Forest Research 25(1): 32-45. ).
Current studies estimating diameter at breast height, and trees' volume from stump dimensions, are based on charts, equations, or tables. (BYLIN 1982BYLIN, C. 1982. Volume prediction from stump diameter and stump height of selected species in Louisiana. USDA Forest Service, Southern Forest Experiment Station, Research Paper SO-182. 11pp., KOZAK and OMULE 1982, MCCLURE 1968, WHARTON 1984WHARTON, E. 1984. Predicting diameter at breast height from stump diameters for the northeastern tree species. USDA Forest Service, North Eastern Forest Experiment Station, Research Note NE-322. 4pp., KHATRY CHHETRI and FOWLER 1996, CORRAL-RIVAS et al. 2007, ÖZÇELÍK et al. 2010ÖZÇELÍK, R., BROOKS, J., DIAMANTOPOULOU, M., WIANT, H. 2010. Estimating breast height diameter and volume from stump diameter for three economically important species in Turkey. Scandinavian Journal Of Forest Research 25(1): 32-45. ). Tree volume estimate is done in two steps. Firstly, diameter at breast height is measured; then, tree volume is estimated generally by using a one-entry volume table. However, when one-entry volume tables are unavailable, or cannot be elaborated upon (e.g. often when cutting trees in an isolated area); as such, in order to predict the volume of the trees that have been removed, other methods may be required.
Quercus spp. forests comprise the 22.6 % of the area of all Greek forests (MINISTRY OF AGRICULTURE 1992MINISTRY OF AGRICULTURE. 1992. Results of the first national forest inventory. The final data process was made by Tsaprounis I., Publication of Department of forest mapping, Athens [in Greek].). One of the most common Quercus species of the mainland country that dominates in most oak forests is Q. frainetto (BERGMEIER and DIMOPOULOS 2008BERGMEIER, E., DIMOPOULOS, P. 2008. Identifying plant communities of thermophilous deciduous forest in Greece: Species composition, distribution, ecology and syntaxonomy. Plant Biosystems 142 (2): 228-254., KORAKIS, 2015KORAKIS, G. 2015. Forest Botany (e-book). Hellenic Academic Libraries Link, Athens. Available in: http://hdl.handle.net/11419/742 [in Greek].
http://hdl.handle.net/11419/742 [in Gree...
). It expands from the Balkans to central Europe, while it is also found in south Italy and Anatolia (CHRISTENSEN, 1997CHRISTENSEN, K. 1997. Fagaceae. In: Flora Hellenica (Strid, A., Tan, K. eds). Koeltz Scientific Books, Germany, pp. 40-50.). It is considered a significant species for timber (CHRISTENSEN, 1997), which forms pure and mixed deciduous forests, while also it is found in open woodlands (BORATYNSKI, et al. 1992BORATYNSKI, A., BROWICZ, K., ZIELINSKI, J. 1992. Chorology of trees and shrubs in Greece. Kornik, Poznan; CHRISTENSEN, 1997). Quercus frainetto is usually appears at altitudes between 200 and 1,200 m (BORATYNSKI, et al. 1992; CHRISTENSEN, 1997). However it can be found in lowland degraded forests (MILIOS, et al. 2014MILIOS, E., PIPINIS, E., KITIKIDOU, K., BATZIOU, M., CHATZAKIS, S., AKRITIDOU, S. 2014. Are sprouts the dominant form of regeneration in a lowland Quercus pubescens-Quercus frainetto remnant forest in Northeastern Greece? A regeneration analysis in the context of grazing. New Forests 45: 165-177., BATZIOU, et al. 2016BATZIOU, M., MILIOS, E., KITIKIDOU, K.. 2016 Is diameter at the base of the root collar a key characteristic of seedling sprouts in a Quercus pubescens - Quercus frainetto grazed forest in north-eastern Greece? A morphological analysis. New Forests. ). It is an intermediate shade tolerant species (Athanasiadis 1986ATHANASIADIS, N. 1986. Forest botany, Part II. Giahoudis- Giapoulis, Thessaloniki, Greece [in Greek].). Even though it has the ability to appear and grow in low productive sites (KITIKIDOU, et al. 2015KITIKIDOU, K., MILIOS, E., TSIREKIS, E., PIPINIS, E., STAMPOULIDIS, A. 2015. Site quality assessment of degraded Quercus frainetto stands in central Greece. iForest8: 53-58.; KORAKIS, 2015), it exhibits the best growth in fertile sites (KORAKIS , 2015). Moreover, Q. frainetto is considered as a drought tolerant species (ABBATE, et al. 1990ABBATE, G., BLASI, C., PAURA, B., SCOPPOLA, A., SPADA, F. Phytoclimatic characterization of Quercus frainetto Ten. stands in peninsular Italy. Vegetatio 90: 35-45, 1990.; RAFTOYANNIS, et al. 2006RAFTOYANNIS, Y., RADOGLOU, K., HALIVOPOULOS, G. 2006. Ecophysiology and survival of Acer pseudoplatanus L., Castanea sativa Miller. and Quercus frainetto Ten. seedlings on a reforestation site in northern Greece. New Forests 31:151-163.)
Current equations estimating diameter at breast height from diameter at stump height developed for Q. frainetto in the south Evros region are presented. These equations can serve as an indicator of size, especially for trees removed from the forest due to illegal logging; in that case, the stump is the only available part left for diameter measurements.
MATERIAL AND METHODS
Study area
The study was carried out in northeastern Greece, in the southern part of the region of Evros (Figure 1). It covers an area of approximately 1,118 ha between the altitudes of 364 and 1,072 m. Mean annual air temperature, according to the data of the closest meteorological station is 14.8 oC and the total annual precipitation is 558.9 mm (Study of Protection and Management of the "Notios" forest 2008STUDY OF PROTECTION AND MANAGEMENT OF THE "NOTIOS" FOREST. 2008. Managing period 2008 - 2017. Forest Service of Alexandroupolis, Region of Eastern Macedonia - Thrace, Greece.). The trees used in this study were selected from pure and mixed Q. frainetto stands. The mixed stands involved Q. frainetto, Fagus sylvatica or Quercus pubescens or Q. coccifera.

Data
Equations to predict diameter at breast height from stump diameter were developed using data of 135 trees selected from pure stands, and 250 trees from mixed stands. Eighty four trees (SP trees), growing more or less freely, were selected in sparse pure stands, while 51 trees (DP trees) were selected in dense pure stands of the species. On the other hand, 111 (SM trees) trees, growing more or less freely, were selected in sparse mixed stands, and 139 trees (DM trees) were selected in dense mixed stands. In order for a tree to be classified as a SP or a SM, the closest distance between its crown and the crowns of adjacent trees had to be more than 0.5 m. The rest (being closer to a adjacent tree) were classified as DP and DM trees. However, the crown of almost all selected DP and DM trees touched the crown of adjacent trees in a great part of its circumference. The trees documented covered an existing range of qualities, and were selected in stands located within the study location. Trees were randomly selected, ensuring that there was a representative distribution among the diameters and height classes. Perimeter p at breast height 1.3 m, d (in cm), and the perimeter at stump height 0.2 m dst (in cm) were measured in each tree, using a measurement tape of 1 cm precision. Diameter was calculated applying the equation 1.
 [1]
[1]Relationships between diameter at stump height and diameter at breast height were examined by visually comparing scatter plots of stump diameter against diameter at breast height (Figure 2). Outliers weren't present in this study. The summary statistics of these final datasets, used to develop the equations to predict the diameter at breast height from the stumps, as shown in Table 1.

Scatter plots breast height diameter - stump height diameter of subsamples (beginning from the upper left corner: dense stands, sparse stands, pure dense stands, mixed dense stands, pure sparse stands, mixed sparse stands).
Statistic summaries for sampled trees, for each measured variable (breast height diameter d and stump height diameter dst), and subsample (whole forest, dense stands, sparse stands, pure dense stands, mixed dense stands, pure sparse stands, mixed sparse stands).
Models Analyzed
Eleven different models were tested, each available in the Curverfit command of SPSS v.21 (IBM 2012IBM Corp. Released 2012. IBM SPSS Statistics for Windows, Version 21.0. Armonk, NY: IBM Corp.), to help develop the equations used for predicting the parameters. Stump diameter was measured at 20 cm height (above ground level), and thus the stump height was not included as a covariate in the models. The models tested are shown in Table 2. Where: estimated diameter at breast height d (cm), bi: regression coefficients, dst: measured diameter at stump height (cm), u: upper boundary value (max d rounded up).
Evaluated mathematical expressions for the models tested for breast height diameter estimation from stump diameter.
Comparing Models
When judging the performance criteria of the functions, a numerical and graphical base was used to analyze the residuals. The two statistics that were calculated were the root mean square error (RMSE) and the coefficient of determination (R2 ) (KITIKIDOU, 2005KITIKIDOU, K. 2005. Applied statistics with use of the SPSS statistical package. Tziola publications, Thessaloniki, Greece [in Greek].).
The statistical expressions are as follows [2] and [3], where di
,  and
and  are the observed, the predicted and mean values, respectively, of the dependent variable, and n is depicted as the total number of observations used to fit the model.
 [2]
[2]
 [3]
[3]In order to compare the predictive capabilities of the models, one should take into account that the residuals (the RMSE criterion in our study) and the measurements of quality (the R 2 criterion in our study) do not determine the quality of future prediction (Myers 1990MYERS, R. 1990. Classical and modern regression with applications. 2nd edition. Duxbury Press, Boston, USA.). To this end, the model must be verified for this process, and only a newly collected dataset will be viable in this instance. However, as such data are scarce, several other methods have been proposed, though they seldom provide additional information when compared with the statistics that have been obtained directly from other complete datasets (KOZAK and KOZAK, 2003KOZAK, A., KOZAK, R. 2003. Does cross validation provide additional information in the evaluation of regression models?. Canadian Journal of Forest Research 33(6): 976-987.). Hence, validations can only be performed once new data have been collected and have become available.
RESULTS - DISCUSSION
Model selection
The statistics for each of the different models tested for diameter estimation are shown in Table 3 (all contained significant parameters). Optimal values are highlighted. The quadratic model performed best (Figure 3).
Comparison statistics (root mean square error (RMSE) and coeffi cient of determination R2), for pure and mixed stands, for the eleven models tested for breast height diameter estimation from stump diameter.

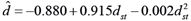
Fitting of the quadratic model estimating breast height diameter from stump diameter - (A) pure stands (
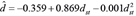 ); (B) mixed stands (
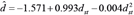 ).
).
The R2 values of both selected models are high. However, in the trees which grow in sparse stands (SP, SM trees) the R2 values (0.9500, 0.9426, respectively) of the selected models are higher than the R2 values of the corresponding trees (DP, DM trees) growing in dense stands (0.9022, 0.8810, respectively). The relationship between basal and breast height diameter of a tree is determined by the taper of the tree. Growth conditions (competition regime) affect form factors of trees (PHILIP 1994PHILIP, M. 1994. Measuring trees and forests. CAB International, UK., KITIKIDOU et al. 2014KITIKIDOU, K., MILIOS, E., LIPIRIDIS, I. 2014. Tree volume estimates and nearest neighbor analysis in the stands of scots pine (Pinus sylvestris) in the central part of Rodope mountain. Šumarski list, 138(11-12), 573-582.). The form of trees is affected by the stand density. Higher tree taper is the result of low stand densities (PHILIP, 1994; Smith et al., 1997SMITH, D., LARSON, B., KELTY, M., ASHTON, P., MARK, S. 1997. The practice of silviculture. Applied Forest Ecology. John Willey & Sons, Inc., MILIOS and AKRITIDOU 2002MILIOS, E., AKRITIDOU, S. 2002. Growth patterns of beech (Fagus sylvatica s.l.) trees under different growth conditions. In: Proceedings of the 10th conference of Hellenic forestry society, pp 676-684 [in Greek].). On the other hand, a free growing tree or a robust dominant tree puts more wood in its base, while trees with low vigor, suppressed trees, or trees growing in dense stands without being dominant add lower wood width in their base (compared to that of the other bole heights) (FRITTS, 1976FRITTS, H. 1976. Tree rings and climate. Academic Press Inc London., WILSON, 1984WILSON, B. 1984. The Growing Tree, University of Massachusetts Press, U.S.A., SMITH et al., 1997). So, high variability of tree tapers can be found in stands according to tree density and social position. Thus, in the present study the trees from the dense stands (DP, DM trees) can exhibit a high variability of form factors. However, this is not the case for the trees from sparse stands (SP, SM trees) which grow freely without intense competition from the adjacent trees. This is the reason for the lower estimation ability (lower R2 values) of the selected models for DP and DM trees compared to the selected models for SP and SM trees. Furthermore, high variability of form factors influences the volume prediction models (KITIKIDOU, et al. 2016KITIKIDOU, K., MILIOS, E., KATSOGRIDAKIS, S. 2016. Meta-analysis for the volume of Pinus sylvestris in Europe. Revista Chapingo Serie Ciencias Forestales y del Ambiente. Accepted for publication.).
Nevertheless, in the present study the model selected for all measured trees (Figure 4) had a R2 of 0.94, which is relatively high (Table 4). As a result, it is recommended for general use for simplicity as well as for accuracy reasons. More research is needed in order to be developed analogue models for more species. Moreover, use of competition indices may increase the accuracy of the models, through more accurate stem form predictions, especially when simple models are not accurate.

Fitting of the quadratic model estimating breast height diameter from stump diameter - whole forest (
 )
)
Comparison statistics (root mean square error (RMSE) and coeffi cient of determination R2), for the eleven models tested for breast height diameter estimation from stump diameter - whole forest (pure and mixed stands).
In the models tested, stump height was not considered as covariate, as each of the trees had been measured at the same stump height (20 cm). While prior studies have revealed that, for species having more or less the same stump height, this variable (i.e. stump height) did not significantly improve the variability explained by the regression equations that were developed for predicting diameter at breast height from diameter at stump height (e.g. Bylin 1982BYLIN, C. 1982. Volume prediction from stump diameter and stump height of selected species in Louisiana. USDA Forest Service, Southern Forest Experiment Station, Research Paper SO-182. 11pp.), this limitation suggests that further work and data is needed to be evaluated before adapting the equations to test stumps resulting from trees that have been cut at heights different from 20 cm.
CONCLUSION
In this study, equations to predict diameter at breast height from diameter at stump height, were developed. Fittings for pure Quercus frainetto stands, mixed stands, and for the whole forest were tested. These equations are useful for direct calculations of the volume of cut trees. This is particularly interesting for the prediction of the volume of trees that have been illegally cut down. Even if logs have been removed from the forest, one will still be able to obtain their diameter at breast height by employing these models. The selected equations (quadratic model) were: for pure stands (R 2 = 0.94) for mixed stands (R 2 = 0.92) for the whole forest (R 2 = 0.94), where is the estimated diameter at breast height d (cm), and dst is the measured diameter at stump height (cm).
REFERENCES
- ABBATE, G., BLASI, C., PAURA, B., SCOPPOLA, A., SPADA, F. Phytoclimatic characterization of Quercus frainetto Ten. stands in peninsular Italy. Vegetatio 90: 35-45, 1990.
- ARLINGHAUS, S. 1994. Practical handbook of curve fitting. CRC Press, USA.
- ATHANASIADIS, N. 1986. Forest botany, Part II. Giahoudis- Giapoulis, Thessaloniki, Greece [in Greek].
- BATZIOU, M., MILIOS, E., KITIKIDOU, K.. 2016 Is diameter at the base of the root collar a key characteristic of seedling sprouts in a Quercus pubescens - Quercus frainetto grazed forest in north-eastern Greece? A morphological analysis. New Forests.
- BERGMEIER, E., DIMOPOULOS, P. 2008. Identifying plant communities of thermophilous deciduous forest in Greece: Species composition, distribution, ecology and syntaxonomy. Plant Biosystems 142 (2): 228-254.
- BORATYNSKI, A., BROWICZ, K., ZIELINSKI, J. 1992. Chorology of trees and shrubs in Greece. Kornik, Poznan
- BYLIN, C. 1982. Volume prediction from stump diameter and stump height of selected species in Louisiana. USDA Forest Service, Southern Forest Experiment Station, Research Paper SO-182. 11pp.
- CHRISTENSEN, K. 1997. Fagaceae. In: Flora Hellenica (Strid, A., Tan, K. eds). Koeltz Scientific Books, Germany, pp. 40-50.
- CORRAL-RIVAS, J., BARRIO-ANTA, M., AGUIRRE-CALDERON, O., DIEGUEZ-ARANDA, U. 2007. Use of stump diameter to estimate diameter at breast height and tree volume for major pine species in El Salto, Durango (Mexico). Forestry 80(1): 29-40.
- DEMAERSCHALK, J., OMULE, S. 1982. Estimating Breast Height Diameters from Stump Measurements in British Columbia. The Forestry Chronicle58(3): 143-145.
- FOREST SERVICE OF ALEXANDROUPOLI (GREECE). http://gdday.damt.gov.gr/index.php/ddd/77-dasarxeio-alexandr
» http://gdday.damt.gov.gr/index.php/ddd/77-dasarxeio-alexandr - FRITTS, H. 1976. Tree rings and climate. Academic Press Inc London.
- IBM Corp. Released 2012. IBM SPSS Statistics for Windows, Version 21.0. Armonk, NY: IBM Corp.
- KHATRY CHHETRI, D., FOWLER, G. 1996. Estimating diameter at breast height and basal diameter of trees from stump measurements in Nepal's lower temperate broad-leaved forests. Forest Ecology And Management 81(1-3): 75-84.
- KITIKIDOU, K. 2005. Applied statistics with use of the SPSS statistical package. Tziola publications, Thessaloniki, Greece [in Greek].
- KITIKIDOU, K., MILIOS, E., KATSOGRIDAKIS, S. 2016. Meta-analysis for the volume of Pinus sylvestris in Europe. Revista Chapingo Serie Ciencias Forestales y del Ambiente. Accepted for publication.
- KITIKIDOU, K., MILIOS, E., LIPIRIDIS, I. 2014. Tree volume estimates and nearest neighbor analysis in the stands of scots pine (Pinus sylvestris) in the central part of Rodope mountain. Šumarski list, 138(11-12), 573-582.
- KITIKIDOU, K., MILIOS, E., TSIREKIS, E., PIPINIS, E., STAMPOULIDIS, A. 2015. Site quality assessment of degraded Quercus frainetto stands in central Greece. iForest8: 53-58.
- KORAKIS, G. 2015. Forest Botany (e-book). Hellenic Academic Libraries Link, Athens. Available in: http://hdl.handle.net/11419/742 [in Greek]
» http://hdl.handle.net/11419/742 [in Greek] - KOZAK, A., KOZAK, R. 2003. Does cross validation provide additional information in the evaluation of regression models?. Canadian Journal of Forest Research 33(6): 976-987.
- KOZAK, A., OMULE, S. 1992. Estimating stump volume, stump inside bark diameter and diameter at breast height from stump measurements. The Forestry Chronicle 68(5): 623-627.
- MCCLURE, J. 1968. Predicting tree dbh from stump measurements in the southeast. USDA Forest Service, South Eastern Forest Experiment Station, Research Note SE-99. 60pp.
- MILIOS, E., AKRITIDOU, S. 2002. Growth patterns of beech (Fagus sylvatica s.l.) trees under different growth conditions. In: Proceedings of the 10th conference of Hellenic forestry society, pp 676-684 [in Greek].
- MILIOS, E., PIPINIS, E., KITIKIDOU, K., BATZIOU, M., CHATZAKIS, S., AKRITIDOU, S. 2014. Are sprouts the dominant form of regeneration in a lowland Quercus pubescens-Quercus frainetto remnant forest in Northeastern Greece? A regeneration analysis in the context of grazing. New Forests 45: 165-177.
- MINISTRY OF AGRICULTURE. 1992. Results of the first national forest inventory. The final data process was made by Tsaprounis I., Publication of Department of forest mapping, Athens [in Greek].
- MYERS, R. 1990. Classical and modern regression with applications. 2nd edition. Duxbury Press, Boston, USA.
- ÖZÇELÍK, R., BROOKS, J., DIAMANTOPOULOU, M., WIANT, H. 2010. Estimating breast height diameter and volume from stump diameter for three economically important species in Turkey. Scandinavian Journal Of Forest Research 25(1): 32-45.
- PHILIP, M. 1994. Measuring trees and forests. CAB International, UK.
- POND, N., FROESE, R. 2014. Evaluating published approaches for modelling diameter at breast height from stump dimensions. Forestry 87(5): 683-696.
- RAFTOYANNIS, Y., RADOGLOU, K., HALIVOPOULOS, G. 2006. Ecophysiology and survival of Acer pseudoplatanus L., Castanea sativa Miller. and Quercus frainetto Ten. seedlings on a reforestation site in northern Greece. New Forests 31:151-163.
- SMITH, D., LARSON, B., KELTY, M., ASHTON, P., MARK, S. 1997. The practice of silviculture. Applied Forest Ecology. John Willey & Sons, Inc.
- STUDY OF PROTECTION AND MANAGEMENT OF THE "NOTIOS" FOREST. 2008. Managing period 2008 - 2017. Forest Service of Alexandroupolis, Region of Eastern Macedonia - Thrace, Greece.
- WHARTON, E. 1984. Predicting diameter at breast height from stump diameters for the northeastern tree species. USDA Forest Service, North Eastern Forest Experiment Station, Research Note NE-322. 4pp.
- WILSON, B. 1984. The Growing Tree, University of Massachusetts Press, U.S.A.
Publication Dates
-
Publication in this collection
Jul-Sep 2016
History
-
Received
25 June 2016 -
Accepted
13 Sept 2016

 Thumbnail
 Thumbnail
 Thumbnail


