
ABSTRACT
Tree volumes can alternatively be obtained by ratio estimates, instead of applying linear regression modeling. An interesting question was considered by the authors when comparing the precision of tree volumes obtained by these two statistical approaches, that allowed us to formulate a new hypothesis to conduct this study: “Is it possible to obtain better volume estimates if the form factor is associated only to the exponent of the independent variable that presents higher correlation with the stem volume?”. The research was conducted in commercial stands of black wattle (Acacia mearnsii De Wild) in the municipalities of Cristal, Encruzilhada do Sul and Piratini to answer this question. Forest stands were sampled in a sequence of ages after planting, varying from 1 to 14 years. In each forest stand, trees were felled, and the following characteristics were evaluated: diameter at breast height, total height, and stem scaling. The three age groups were specified according to the behavior of the form factor values. It was proposed three models to be solved by ratio estimates. A comparison of the proposed models with the Schumacher-Hall model, fitted by regression analysis, was done. The model in which the form factor was associated to the exponent of the diameter variable produced the best results, owing to a powerful correlation resulted of this confounding with volume as a dependent variable. Ratio estimates resulted in more accurate tree volumes predominantly, when compared with those obtained by the traditional Schumacher-Hall model fitted through regression analysis. Therefore, we recommend the application of model 2 fitted by ratio estimate.
Keywords:
Ratio; Form fator; Stem volume; Allometric relationship
INTRODUCTION
The volume of standing trees is the most important variable in a forest inventory. The volume is obtained as a function only of tree diameter (d) or of (d) times tree height (h). Mathematical formulation for this purpose is based on the cylindrical geometric solid and is the most adequate approach to its dimensional shape. A correction factor (f) is applied to this solid, most commonly known in the literature as form factor.
The analytical solution, including an estimation of the form factor as a function of a form quotient (q i ) and the tree height (h), was applied to different forest species in Europe, which opened the horizons for other formulations and conceptions for volume equations.
While biometricians today still make use of volumetric modeling for preparation of volume tables with participation only of the variabled, the solution with the additional inclusion of the variableh has been the most widely used, because the increase in accuracy of the estimates in this solution is statistically significant.
The volume modeling theme has been treated by many researchers and regression analysis is applied to fit equations, as presented in: Rufini et al. (2010RUFINI, A.L; SCOLFORO, J.R.S; OLIVEIRA, A.D; MELLO, J.M. Equações volumétricas para o cerrado sensu stricto, em Minas Gerais. CERNE, v. 16, p. 1-11, 2010.), Abdullah et al. (2011ABDULLAH, N.; JUBOK, Z.HJ.; AHMED, A. Improved stem volume estimation using p-value approach in polynomial regression models. Research Journal of Forestry, v. 5, p. 50-65, 2011.), Alegria (2011ALEGRIA, C. Modelling merchantable volumes for uneven aged maritime pine (Pinus pinaster Aiton) stands established by natural regeneration in the central Portugal. Annals of Forest Research, v. 54, n. 2, p. 197-214, 2011.), Özçelik and Brooks (2012ÖZÇELIK, R.; BROOKS, J.R. Compatible volume and taper models for economically important tree species of Turkey. Annals of Forest Science , v. 69, p. 105-118, 2012.), Özçelik and Bal (2013)ÖZÇELİK, R.; BAL, C. Effect of adding crown variables in stem taper and volume predictions for black pine. Turkey Journal of Agriculture and Forestry, v. 37, p. 231-242, 2013., Adekunle et al. (2013ADEKUNLE, V.A.J.; NAIR, K.N.; SRIVASTAVA, A.K.; SINGH, N.K. Models and form factors for stand volume estimation in natural forest ecosystems: a case study of Katarniaghat Wildlife Sanctuary (KGWS), Bahraich District, India. Journal of Forestry Research, v. 24, n. 2, p. 217-226, 2013.), Fortin et al. (2013FORTIN, M.; SCHNEIDER, R.; SAUCIER, J.P. Volume and error variance estimation using integrated stem taper models. Forest Science , v. 59, p. 345-358, 2013.), Gonzalez-Benecke et al. (2014GONZALEZ-BENECKE, C.A.; GEZAN, S.A.; MARTIN, T.A.; CROPPER. JR, W.P.; SAMUELSON, L.J.; LEDUC, D.J. Individual tree diameter, height, and volume functions for longleaf pine. Forest Science, v. 60, n. 1, p. 43-56, 2014.),Ver Planck and MacFarlane (2014)VER PLANCK, N.R.; MacFARLANE, D.W. Modelling vertical allocation of tree stem and branch volume for hardwoods. Forestry, v. 87, p. 459-469, 2014., Téo et al. (2018TÉO, S. J.; MACHADO, S.A.; FIGUEIREDO FILHO, A; TOMÉ, M. Equação de volume de aplicabilidade extensiva a diversas classes de idade para Pinus taeda l., na região meio oeste do estado de Santa Catarina. Revista Brasileira de Biometria, v. 36, p. 668, 2018.), Urbano et al. (2018URBANO, E.; MACHADO, S.A.; FIGUEIREDO FILHO, A.; SANQUETTA, C.R.; CAMANO, J. Z. Modelación del volumen de rodal para especies secundarias en bosques nativos de Mimosa scabrella en la región metropolitana de Curitiba, Paraná, Brasil. Bosque, v. 39, p. 1, 2018.).
Tree volumes can alternatively be obtained by ratio estimates, instead of applying linear regression modeling. This estimate was first applied by Gervorkiantz and Olsen (1955GERVORKIANTZ, S.R.; OLSEN, L.P. Composite volume tables for timber and their application in the Lake States. United States Department of Agriculture, Technical Bulletin, 1104. 1955. 51p.) for a composite of species in the Lake States. They observed that for those species, an average form factor could be used to construct a volume table with a reasonable accuracy for most of the species in that forest area, even though they have commented that for small or large trees, such estimates resulted in overestimation for young trees and in underestimation for older trees.
We are aware of such a reality, as under strong competition in native stands, young trees grow faster in height than in diameter at breast height, thus resulting in higher form factors. On the other hand, as stated by Hohenadl (1923)HOHENADL, W. Der aufbau der baumschafte. Forstwiss Cbl, v. 44, p. 17-18, 1924., the dominant trees present higher relative increments at the bottom, i.e., in the neiloid segment to ensure better balance to the stem weight; he concluded that, in these cases, its volume is associated to genetic and environmental effects, and to sylvicultural treatments, therefore presenting smaller form factor than in younger trees.
In plantation areas, most of these problems do not occur, because the models for volume estimation are fitted on tree data of one species at a specific age, consequently the use of ratio estimate becomes a promising alternative for volume estimation. In very young stands, the form factors are also affected when trees are not tall enough to balance the ratio between the real volume with the cylinder volume. If the forest inventory is carried out in stands of all ages, then, to avoid this trend, the population should be stratified in different classes of tree form.
As far as we know, there have been no advances after Gervorkiantz and Olsen (1955GERVORKIANTZ, S.R.; OLSEN, L.P. Composite volume tables for timber and their application in the Lake States. United States Department of Agriculture, Technical Bulletin, 1104. 1955. 51p.) regarding the application of ratio estimates and their comparison with other solutions obtained by the application of linear regression in the adjustment of volumetric functions.
An interesting question was considered by the authors to compare the accuracy of regression analysis and ratio estimates by fitting volume equations, that allowed us to formulate a new hypothesis to conduct this study: “It is possible to obtain better volume estimates if the form factor is only associated to the exponent of the independent variable that presents higher correlation with the stem volume”.
As the forest scientists are aware of, the researchers Schumacher and HallSCHUMACHER, F.X.; HALL, F.S. Logarithmic expression of timber-tree volume. Journal of Agriculture Research, v. 47, p. 719-734, 1933. proposed a mathematical model in which the form effect was associated with the three coefficients that participate of the general volumetric model, that is, to the circle-generating coefficient, to the coefficient exponent of the diameter at breast height, and to the exponent coefficient of height. In the present proposal the form effect will be tested concentrated on only each of these coefficients separately. Therefore, our hypothesis assumes that if the diameter at breast height shows a highest correlation with the form factor and with the volume as the dependent variable, then if the form is only associated with the power quadratic coefficient of the diameter variable, such associated effect should result in the best response to tree volume obtained by ratio estimate.
The main objective of the present work was to obtain estimators for individual tree volume with greater precision from models that potentiate the correlation of independent variables with the dependent variable. In the present work, this premise was evaluated with the concentration of the form effect on only one of the variables that integrate the volumetric model.
MATERIAL AND METHODS
Dendrometric data source
The research was conducted in commercial stands of black wattle (Acacia mearnsii De Wild) in the municipalities of Cristal, Encruzilhada do Sul and Piratini, a region in which the plantations of the species is concentrated in the state of Rio Grande do Sul, Brazil. These regions are characterized concerning climate, relief type, and soil inMochiutti (2007MOCHIUTTI, S. Produtividade e sustentabilidade de plantações de acácia-negra (Acacia mearnsii De Wild.) no Rio Grande do Sul. Tese de doutorado, Universidade Federal do Paraná. 2007.).
The seedlings for planting were produced in seed orchards from TANAC S.A./ TANAGRO S.A. company. The planting was performed manually and during this operation 50 g of NPK were added per plant. The plant spacing was 3 m between rows and 1.75 m between plants within rows.
The black wattle plantations did not need additional cultural treatments. Cleaning was the only sylvicultural activity carried out with the objective of reducing the weed competition with the black wattle seedlings during the first two years after planting. The cleanings were carried out mechanically using a tractor and an agricultural mowing.
The experiments were set out both in new areas (first rotation), as well as in cutover area plantations (second rotation). The soil preparation was performed only in the planting row (minimum cultivation), using a subsoiling with three rods 40 cm of depth and two harrows in the ground.
Forest stands were sampled in a sequence of ages after planting (Table I). Normally, the crop rotation of black wattle ranges from 6 to 8 years. The sampling conducted in this research covers the entire rotation, including the stands with ages in excess of 8 years.
In each forest stand, trees were felled, and the following characteristics were evaluated: diameter at breast height, total height, and stem scaling. The diameter at breast height - 1.3 m (d) was measured using a dendrometric tape, and total height was measured using a measuring tape.
The stem scaling was performed with Hohenadl’s method using a dendrometric tape and the stem volume (with bark) was obtained using Huber’s method, in which the measurements were taken along the stem, proportional to its total height at: 5%, 15%, 25%, 35%, 45%, 55%, 65%, 75%, 85% and 95% of it. The volume was obtained as in 1, where: v= stem volume, in m3, d i = diameter taken in the middle of the section, in (m), l i = length of the section, in (m).
Sampling data is composed of 1,163 trees, distributed in groups as shown in Table I, presented in a supplementary file. A summary statistic of data and correlations analysis between the variables was performed.
Descriptive statistics of sample data from black wattle stands in the state of Rio Grande do Sul, Brazil.
The three age groups were specified according to the behavior of the form factor values, as presented in Figure 1. The range of the groups were established considering the intervals of stand ages, i.e., the first group was composed of trees up to one year old, the second group of trees from one year up to two years old, and the third group of trees from 2 up to 14 years old.
The specified groups were integrated according to the variation of form factors, as shown in Figure 1, presented in a supplementary file. For small trees in the sample (with heights ≤ 2 m), the stem volumes resulted in values greater than the volumes of the cylinders taken at 1.3 m above ground. Therefore, the results of the form factors for these trees were greater than 1.

Variation in form factors stratified by age groups in black wattle stands, in the state of Rio Grande do Sul, Brazil
Conceptions for volume modeling by ratio estimate
It is assumed for modeling the stem volume in each forest area: “the metric units of the independent variables in the proposed models should be structured to express the same metric unit of the dependent variable, because the same volumetric units for both sides of the model will provide better allometric relationship between them”.
If this assumption is strictly observed, it is very easily verified that using the diameter at breast height (d) and height (h) of trees, as variables to integrate the volumetric model, in an isolated or combined manner, should generate compatible results with those of the dependent variable, i.e., shall be expressed in m³.
Consider the general model defined in 2, where: vis stem volume in (m³), g is cross-sectional area of the tree in (m2), dis diameter at breast height in (m), his total height in (m) and fis form factor.
In the first phase of our proposal, we should decide how the form factor (f) will participate indirectly in the model, i.e., it should be associated with only one coefficient, once it is impracticable to obtain it experimentally in all inventoried trees. This leads to the formulation of the following models:
For model 1, specified in 3, the effects of the constant and f are combined in the coefficient α1 ; for Model 2, specified in 4, the effects of f and the quadratic constant, exponent of the variable d, are combined in α2; and for model 3, specified in 5, the effects of f and the unitary constant, exponent of the variable h, are combined in α3 .
Note that model 1 was proposed by Spurr (1952SPURR, S.H. Forest Inventory. The Ronald Press Company, 476 p. 1952.), who called it “constant form factor”; however, at the time of its application to a data set, he proposed a solution combining it with the logarithmic application, i.e., the author added a coefficient as an exponent of the combined variable (d2h)β to solve it by linear regression.
The theoretical concept presented for the volumetric models is consistent for an individual tree, whereas the volume calculation for different trees will change if it includes the variability of the stem volume in relation to the cylinder volume, i.e., the variability inherent to the tree form.
As the coefficients α1, α2 , and α3 vary between trees, they will be considered as αji, where j stands for the jth model and i for ith tree in each model; therefore, we can obtain their probability distributions and evaluate if they are normally distributed.
If we take the mean values of the variables used in the models, the ratio means will be easily solved using 6 , 7 and 8, where  1,
1,  2 and
2 and  3 are the means of the stem volume in models 1, 2, and 3, respectively,
  is the mean of the variable d
2
h ,
is the mean of the variable d
2
h ,  is the mean of the variable d,
  h is the mean of the variable h and
  d2 is the mean of the variable d2 .
If we consider the relationship of the tree stem volume estimates as a function of a cylinder volume multiplied by the form factor f in (2), then this estimator will be a ratio with specific meaning, constituting one of central goal of this study.
The inclusion of a coefficient to express the origin of the model (β0) is not appropriate in the proposed modeling by the authors, as it was assumed that the form factor, which corrects the tree cylindrical volume to a real volume, should be expressed by only one coefficient of the model. Consequently, the ratio between the dependent and the independent variable is the only possibility to ensure such an assumption. Thus, this restrictive fact implies that modeling it by ratio estimate is more appropriate than by regression.
To obtain estimates by the ratio method applied to stem volume as the best linear estimate without trend, two possibilities should be considered:
1) the variance of the volume estimate is proportional to the independent variable xi obtained in sample plots:
2) the variance of the volume estimate is proportional to the square of the independent variable xi obtained in sample plots, as presented by Cochran (1963COCHRAN, W. G. 1963. Sampling Techniques. New York: John Wiley & Sons, 448 p.):
Option 2 is not considered appropriate to express the ratio of volumes, whereas experimental results reported in the literature for this condition occurred when the variable xi presented fixed growth (Jessen et al., 1947JESSEN, R.J.; BLYTE Jr., R.H.; KEMPTHORNE, O.; DEMING, W.E. On a population sample for Greece. Journal of the American Statistical Association, v. 42, p. 357-384, 1947.), and this is not the case in this model. As can be noted, option 1 is in fact a solution in which the ratio estimator is identical to a weighted no-intercept regression model, where the weight is inversely proportional to x, which has been already used by Gervorkiantz and Olsen (1955GERVORKIANTZ, S.R.; OLSEN, L.P. Composite volume tables for timber and their application in the Lake States. United States Department of Agriculture, Technical Bulletin, 1104. 1955. 51p.) in the United States for species in the Lake States.
The parametric ratio is then defined generically as in , where: Ri express generically the different models, in which j = 1, 2, 3, i.e.,  in model 1,
  in model 2, and
  in model 3, and are parametric values.
Using small sample sizes, Rj only approximate the true ratio values of the population and, in this case, produce bias in its estimate (Cochran 1963COCHRAN, W. G. 1963. Sampling Techniques. New York: John Wiley & Sons, 448 p.). An alternative to enable using ratio estimates is to take large samples in order to reach a good approximation of the population parameters. Our perception is that, in homogeneous forest areas, the ratios yi/xi are nearly the same in all sample trees (small variation); therefore, using them as defined in 6 to 8 will provide precise volume estimation.
Estimates of variances, absolute and relative standard errors, confidence intervals and their relative precision by ratio estimates can be found in Cochran (1963COCHRAN, W. G. 1963. Sampling Techniques. New York: John Wiley & Sons, 448 p.) and Péllico Netto and Behling (2019).
In the case of the experiment presented here, the mean variance is a function of the square of the arithmetic mean, so it does not generate any problem in this estimator, because, regardless of whether the mean of transformed or untransformed data is taken, it will always be positive. However, in the case of the standard deviation, the value of the arithmetic mean being negative generates incongruity in this estimator.
If the calculation procedure is to obtain the variance of the mean and then take its square root, the standard deviation will always be positive. Therefore, in order to maintain consistency in obtaining the standard deviation, it will be appropriate to take the absolute value of the arithmetic mean of transformed sample data when Xi <1.
We highlight that, for model 1, y equals ln(4v/π h) and X equals d2h . For model 2, y equals ln(4v/π h) and X equals ln(d), for model 3, y equals ln(4v/π d2) and x equals ln(h); consequently the estimate of v for model 2 is given by 15 , and for model 3 is given by 16
Obtaining the form factor in models 1, 2, and 3
As was noted, in the formalization of model 1, the effects of the constant π/4 and f are combined in the coefficient  1, so the form fator f is an average of sample values and can be obtained as in 17:
In the case of models 2 and 3, the form factor f can be obtained from the coefficients  and
and  considering the traditional formula to evaluate the volume (v
1 ), as well as that proposed in model 2 (v
2 ) and in model 3 (v
3 ), assuming they produce equal results, i.e., v
1 = v
2 = v
3 .
considering the traditional formula to evaluate the volume (v
1 ), as well as that proposed in model 2 (v
2 ) and in model 3 (v
3 ), assuming they produce equal results, i.e., v
1 = v
2 = v
3 .
Taking the first equality, we have 18:
Taking the second equality, we have 19:
Application of the proposed models
For modeling the stem volume, model 1 in 3, model 2 in 4, and model 3 in 5, the solutions for  ,
, ,
,  and formulated in 6, 7, and 8, from sample data are presented in 20, 21 and 22 respectively.
Comparison of the proposed models with the Schumacher-Hall model
A comparison of the proposed models was made with the Schumacher-Hall model y=ln(a)+b ln(d)+c ln(h), with d and h in meters. The fitting was carried out using the ordinary least squares method. For the linearized Schumacher-Hall equation, this value was corrected applying Meyer’s index. Considering the mean of the estimators, the form factor can be obtained as in (23).
The comparison between the proposed models and the Schumacher-Hall model was performed using the statistics: bias, root mean squared error and adjusted coefficient of determination, as discussed in Willmott and Matsuura (2005)WILMOTT, C.L.; MATSUURA, K. Advantages of the mean absolute error (MAE) over the root mean square error (RMSE) in assessing average model performance. Climate Research, v. 30, p. 79-82, 2005. and Sanquetta et al. (2018SANQUETTA, C.R., DALLA CORTE, A.P., BEHLING, A., OLIVEIRA, L.R., PÉLLICO NETTO, S., RODRIGUES, A.L, SANQUETTA, M.N.I. Selection criteria for linear regression models to estimate individual tree biomasses in the Atlantic Rain Forest, Brazil. Carbon Balance Management, v. 13, p. 25, 2018. ).
RESULTS
Summary statistics of data
A statistical summary of each group of variables: d, h, v and f are presented in Table 2 and in Figure 2. Changes in the values of the central tendency and dispersion measures for groups were detected. For example, f is more variable at younger ages, while v is at more advanced ages.
Descriptive statistics of sample data by group from black wattle stands in the state of Rio Grande do Sul, Brazil.

Box-plot of the variables: f, v, d and h from black wattle stands in the state of Rio Grande do Sul, Brazil.
The correlations for each group between the variables: d, h, v, f, d 2 and d 2 h are shown in Table 3 and Figures 3, 4 and 5. All variables are correlated and the intensities vary between groups; the weaker correlation was observed with the variable f. Correlations between d, v, and d 2 .h are stable, while the others vary by group, usually decreasing intensities at the older ages.
Correlation matrix of the variables: d, h, v, f, d 2 and d 2 .h from black wattle stands in the state of Rio Grande do Sul, Brazil.

This plot shows the correlation among the variables for group 1, positive correlations are blue, neutral are yellow and negative are red. Where: V, d2h =d²h and d2=d² *1000

This plot shows the correlation among the variables for group 2, positive correlations are blue, neutral are yellow and negative are red. Where: V, d2h =d²h and d2=d² *100

This plot shows the correlation among the variables for group 2, positive correlations are blue, neutral are yellow and negative are red. Where: V, d2h =d²h and d2=d² *100
Volume modeling by ratio estimate
In Table 4 the mean values of diameter at breast height (d), height (h), stem volume (v), form factor (f) and their combinations or transformations are presented, as well as solutions for  , , and respectively, in models 1, 2, and 3.
Mean values of variables d 2 . h, d² and αi values for three groups in black wattle stands, in the state of Rio Grande do Sul, Brazil.
The results of confidence intervals and accuracies obtained for models 1, 2, and 3 are presented in Table 5.
Confidence intervals and precision for stem volume using models 1, 2, and 3 in black wattle forest stands, in the state of Rio Grande do Sul, Brazil.
It was observed that the  i values in all proposed models presented overestimation of the stem volume in larger diameter classes. To solve this problem, the authors evaluated the possibility of establishing a function to estimate the alpha values for each tree as a function of the variable d and using these results to estimate the volume in the original equations 3, 4, and 5. This procedure was denominated calibrated alpha (ic). The fitted relationship was well described by the functions presented Table 6, additionally, presented in Figures 6, 7 and 8.
Function to estimate the alpha values for each tree as a function of the variable d, in black wattle forest stands, in the state of Rio Grande do Sul, Brazil.

Relationships between the coefficients αi and the variable diameter at breast height obtained from models 1, 2, and 3, in black wattle forest stands, state of Rio Grande do Sul, Brazil, for the first group.
The best relationships were observed in model 2, denoting an interesting alternative to correct possible systematic deviations in volume prediction, especially for trees with larger diameters. In this case, the values of the coefficient should be previously estimated and subsequently applied in equation 4 to obtain the tree volumes.
Volume modeling by regression analysis
The fitted Schumacher-Hall model is presented in 24,25, and 26, respectively for groups 1, 2, and 3, where:  is the adjusted coefficient of determination
Comparison of the proposed models with the Schumacher-Hall model
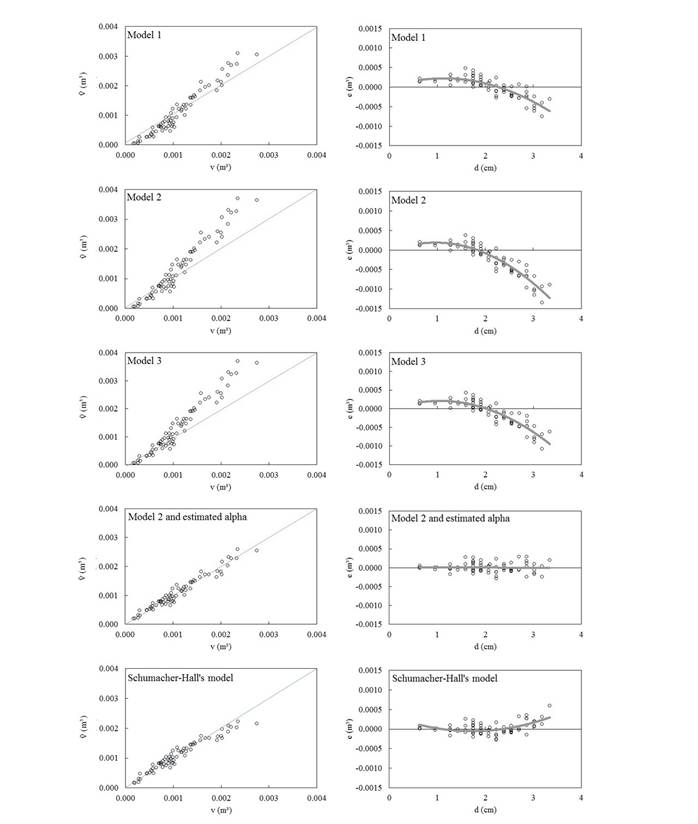
The relationships between the estimated and observed values for the variable stem volume are presented in Figures 9, 10 and 11, respectively for the results observed in groups 1, 2, and 3. The residuals for the variable volume obtained through models 1, 2, and 3 were biased. Using model 2 and its calibrated alpha ( 2c coefficient), it was possible to correct tendencies, as shown in Figures 9, 10 , and 11, and obtain randomly distributed residuals with calibrated alpha, as observed in the Schumacher-Hall model.

Estimated and observed values of the variable stem volume (v) for models 1 and 3, model 2 (with corrected alpha), and Schumacher-Hall’s model obtained for the second group, in black wattle forest stands, state of Rio Grande do Sul, Brazil. Where: v̂ = estimated volume, v = observed volume, e=yi- ŷ i and d is the diameter at breast height

Estimated and observed values of the variable stem volume (v) for models 1 and 3, model 2 (with corrected alpha), and Schumacher-Hall’s model obtained for the second group, in black wattle forest stands, state of Rio Grande do Sul, Brazil Where: v̂ = estimated volume, v = observed volume, e=yi-ŷi and d = diameter at breast height.

Estimated and observed values of the variable stem volume (v) for models 1 and 3, model 2 (with corrected alpha), and Schumacher-Hall’s model obtained for the third group, in black wattle forest stands, state of Rio Grande do Sul, Brazil. Where: v ̂ = estimated volume, v = observed volume, e=yi-ŷi and d = diameter at breast height.
Better predictions for the variable volume were obtained using model 2 (with calibrated alpha -  2c) and the Schumacher-Hall model, results evidenced by the graphical analysis of the previous figures. These models presented similar performances in relation to the calculated statistics (Table 7), however, with slight superiority for model 2 (with corrected alpha) for all groups.
Comparison between model 2 (with corrected alpha) and Schumacher-Hall model (SH), when modeling the variable stem volume in black wattle forest stands, state of Rio Grande do Sul, Brazil.
Solving the equations to obtain the mean form factor, the results of models 1, 2, 3, and Schumacher-Hall are presented in Table 8.
Results for mean form factor on trees from black wattle forest stands, state of Rio Grande do Sul, Brazil.
The variation of form factor in relation to the variable d is presented in Figure 12 (supplementary file), for the three groups.

Variation of form factor in relation to the variable d observed in black wattle forest stands, state of Rio Grande do Sul, Brazil.
DISCUSSION
Summary statistics of data
The allometric relationships of black wattle tree volumes varied according to age (Figures 3, 4 and 5), which is not surprising, and this indicated the importance of stratifying the data.
The correlation between volume and form factor was greater with diameter than with height (Table III and Figures 3, 4 and 5), which supports the hypothesis formulated.
Volume modeling by ratio estimate
The use of allometric volume equations is necessary because the method to assess the tree volume is destructive. In this paper, three models were proposed using the ratio estimate, in which the stem volume depends on the measured variablesdandh, and indirectly on the form factorf, i.e., the effect of f was concentrated only in one coefficient of the proposed models. The results observed in the experiment of black wattle forests, composed of trees of different ages, presented in model 2, using the calibrated  2c coefficient, are interesting proposals for obtaining volumetric estimates. The analysis of the evidences observed in the present research and maintaining the focus on the general model in (2) allowed us to confirm the hypothesis proposed in this study.
Ratio estimates applied for modeling stem volume were first used by Gevorkiantz and Olsen (1955). They have observed that for small or large trees such estimates resulted in overestimation for young trees and underestimation for older trees. The same problem was found in this research (especially with large trees), but we have proposed a solution to obtain appropriate estimates for these extreme values using ratio estimates. The coefficients presented variations as a function of the forest stands’ age and the dimensions of the trees. The ratio values  2 were smaller in young stands than in older ones, i.e., they followed variations like those occurring with the form factors, but in the inverse manner. It was also observed that older stands, where larger trees occur, presented smaller form factor values, but larger values of 2.
It was observed complementarily that the i values in all proposed models presented overestimation of the stem volume in larger diameter classes, as shown in Figures 6, 7, and 8. This shows the importance of calibration to obtain 2 values. It is important to identify a method to detect these variations, using a model that contains an easily measured independent variable, such as d. This could be achieved by taking the second proposed model, since the 2 coefficient is strongly correlated with the variable d. The fitted relationship was well described by a parabola for the younger group with R
2 = 0.8629 and a straight line for groups 2 and 3 with R
2 = 0.5831 and R
2 = 0.7847, respectively, as shown in Table 6. The new estimation of stem volume performed with obtained from the fitted equations as function of the variable d (calibrated 2c ), showed unbiased estimations, as presented in Figures 6, 7, and 8.

Relationships between the coefficients αi and the variable diameter at breast height obtained for models 1, 2, and 3, in black wattle forest stands, state of Rio Grande do Sul, Brazil, for the second group.

Relationships between the coefficients αi and the variable diameter at breast height obtained for models 1, 2, and 3, in black wattle stands, state of Rio Grande do Sul, Brazil, for the third group.
Why have we selected the ratio 2 to be calibrated as a function of the variable d? It is well known that for establishing a functional relationship of stem volume with other variables taken on the tree, d
2 is first used, because this is the most expressive and correlated variable to estimate volume. As the ratio 2 was intentionally included to aggregate the interaction effect of the form factor with the exponent 2 of the variable d, therefore it should maintain equally high correlation with this variable.
The main point in this method consists in allowing the calibration of the volume models through non-destructive measures or, if necessary, by sampling a few trees to evaluate the volume and other characteristics of interest (d and h). The quality of estimates is dependent on variations occurring between sites that affect volume allometric relationships. Identifying how these variations occur is obviously a challenge, but it is an interesting way to obtain more accurate estimates. In these circumstances, modeling 2 coefficient of model 2 as a function of the variable d is an appropriate solution for this purpose. Moreover, the effect of density, competition, and site quality can influence the diameter expression, hence, the importance of these estimates to be made by the ratio method.
Models 1 and 3 also presented good results, but the ratios α1 and α3 did not produce unbiased distribution of the residuals for estimated and observed values of the variable stem volume (v), when compared with model 2. Therefore, we recommend the model 2.
In Gevorkiantz and Olsen’s work (1955) there is an average form factor, but in our work the form effect was incorporated into one of the coefficients of the model as an exponent (model 2), so conceptually we have an effect inversely proportional to the size of each tree. Model 2 is better than 3, because the form factor is more correlated with d than with h.
Volume modeling by regression analysis
During the last century, the topic of stem volume was evaluated in many papers, especially with the purpose of finding easy and accurate methods to estimate this important dendrometric variable. Many volumetric equations have been proposed and most of them are composed of the variables d and h, included mostly in a combined or transformed manner. More complex applications also consider other variables of the forest stand, such as dominant height and density.
Even though researchers normally test well-known volume models, the Schumacher-Hall model, in general, presents the best fitting, because of its strong efficiency from combining the d and h variables to approximate the same metric of the dependent variable (stem volume). This is found in the literature around the world (Fonweban et al., 2012FONWEBAN, J.; GARDINER, B.; AUTY, D. Variable-top merchantable volume equations for scots pine (Pinus sylvestris) and sitka spruce (Picea sitchensis (Bong.) Carr.) in Northern Britain. Foresty, v. 85, p. 237-253, 2012.; Lo and Lin, 2013LO, C.S.; LIN, C. Growth-competition-based stem diameter and volume modeling for tree-level forest inventory using airborne LiDAR data. IEEE Transactions on Geoscience and Remote Sensing, v. 51, p. 2216-2226, 2013.; Cecilia et al., 2014CECILIA, R.C.; EUAN, M.; RICHARD, W.; FERNANDO, R. Volume and taper equations for P. taeda (L.) and E. grandis (Hill ex. Maiden). Agrociencia Uruguay, v. 18, p. 47-60, 2014.; Uvilla et al., 2014UVILLA, J.A.R.; GARCÍA-MAGAÑA, J.J.; HERNÁNDEZ-RAMOS, J.; GARCÍA-CUEVAS X.; VELARDE-RAMÍREZ, J.C.; MUÑOZ-FLORES, H.J.; ESPINOZA, G.G.G. Ecuaciones y tablas de volumen para dos especies de pinus de la sierra Purhépecha, Michoacán. Revista Mexicana de Ciencias Florestales, v. 5, p. 92-108, 2014.; McRoberts et al., 2015McROBERTS, R.E.; MOSER, P.; OLIVEIRA, L.Z.; VIBRANS, A.C. A general method for assessing the effects of uncertainty in individual-tree volume model predictions on large-area volume estimates with a subtropical forest illustration. Canadian Journal of Forest Research, v. 45, p. 44-51, 2015.; Vibrans et al., 2015VIBRANS, A.C.; MOSER, P.; OLIVEIRA, L.Z.; MAÇANEIRO, J.P. Generic and specific stem volume models for three subtropical forest types in southern Brazil. Annals of Forest Science , v. 72, p. 865-874, 2015.; Fernandes, 2017FERNANDES, A.M.V. 2017. Equações volumétricas para Carapa guianensis Aubl. e Swietenia macrophylla King em sistema silvipastoril na Amazônia. Nativa, v. 5, p. 73-77, 2017.; Miguel et al., 2017MIGUEL, E.P.; REZENDE, A.V.; PEREIRA, R.S.; AZEVEDO, G.B.; MOTA, F.C.M.; SOUZA, A.N.; JOAQUIM, M.S. Modeling and prediction of volume and aereal biomass of the tree vegetation in a Cerradão area of central Brazil. Interciência, v. 42, p. 21-27, 2017.). For this reason, we decided to use it as a reference to compare the results obtained from the proposed ratio estimate models in this paper.
Comparison of the proposed models with the Schumacher-Hall model
The effectiveness of the proposed models, especially model 2, were compared with the results obtained from the traditional Schumacher-Hall model, which has shown a slightly lower performance regarding the resulting statistics.
Ratio estimates may contribute to reducing the costs of the forest inventory. It is known that the coefficients obtained through the ratio method are dependent only on the average of the dependent and independent variables. Therefore, the measurement only of the trees that occur in the class where the arithmetic mean is found, would provide largely the reduction of the tree sample size and, consequently, the costs.
From the settings of models 1, 2, and 3 by the ratio method it was possible to confirm the formulated hypothesis that it is possible to concentrate the form effect in just one coefficient of the proposed mathematical models for obtaining tree volumes. It is a simple model, resulting in unbiased estimates of the residuals and it is as good as or even better than those models fitted using regression analysis.
By analyzing the variation of different theoretical models already proposed, it can be stated that the addition of combined variables achieves better estimators for the coefficient of determination, when adjusting them by linear regression. Additionally, authors have included other variables complementary to diameter at breast height (d) and height of the tree (h), attempting to better detect the form effect, although they were aware of the difficulty in measuring such variables and extra time required to carry out the field work in the forest inventory.
It is important to emphasize that, despite all the theoretical attempts to get the best possible quality of tree volume estimates, the models of Schumacher-Hall and “combined variable” of Spurr have generally presented the most accurate results, solved by regression analysis.
In Spurr’s combined variable model, he associated the form factor and the constant π/4 to become the angular coefficient of his model; however, he had proposed to solve it by regression analysis introducing an intercept coefficient to the model. In this work, we propose to solve it by ratio estimate.
In the Schumacher-Hall model, they allowed the form factor to be associated partially to the tree coefficients in (2), i.e., to the constant π/4, to the exponent of the diameter and to the exponent of the height and solved it by regression analysis. In this work, we proposed identifying two alternative models, in which the form factor was associated to the exponent of the variable d or to the exponent of the variable h, and we solve them by ratio estimates.
CONCLUSION
In the conducted experiment, the best results were achieved using the model in which the form factor was associated to the exponent of the diameter variable, owing to the high correlation between them as well as between the diameter and volume.
In the proposed ratio models, the metric units of the independent variables were structured to express the same metric unit of the dependent variable, especially for model 2, and provided better allometric relationship between them.
Volume estimates obtained by ratio are almost always slightly more accurate when compared to those obtained by the traditional model of Schumacher-Hall adjusted by regression analysis. Therefore, we recommend the application of model 2 fitted by ratio estimate.
REFERENCES
- ABDULLAH, N.; JUBOK, Z.HJ.; AHMED, A. Improved stem volume estimation using p-value approach in polynomial regression models. Research Journal of Forestry, v. 5, p. 50-65, 2011.
- ADEKUNLE, V.A.J.; NAIR, K.N.; SRIVASTAVA, A.K.; SINGH, N.K. Models and form factors for stand volume estimation in natural forest ecosystems: a case study of Katarniaghat Wildlife Sanctuary (KGWS), Bahraich District, India. Journal of Forestry Research, v. 24, n. 2, p. 217-226, 2013.
- ALEGRIA, C. Modelling merchantable volumes for uneven aged maritime pine (Pinus pinaster Aiton) stands established by natural regeneration in the central Portugal. Annals of Forest Research, v. 54, n. 2, p. 197-214, 2011.
- GONZALEZ-BENECKE, C.A.; GEZAN, S.A.; MARTIN, T.A.; CROPPER. JR, W.P.; SAMUELSON, L.J.; LEDUC, D.J. Individual tree diameter, height, and volume functions for longleaf pine. Forest Science, v. 60, n. 1, p. 43-56, 2014.
- CECILIA, R.C.; EUAN, M.; RICHARD, W.; FERNANDO, R. Volume and taper equations for P. taeda (L.) and E. grandis (Hill ex. Maiden). Agrociencia Uruguay, v. 18, p. 47-60, 2014.
- COCHRAN, W. G. 1963. Sampling Techniques. New York: John Wiley & Sons, 448 p.
- FERNANDES, A.M.V. 2017. Equações volumétricas para Carapa guianensis Aubl. e Swietenia macrophylla King em sistema silvipastoril na Amazônia. Nativa, v. 5, p. 73-77, 2017.
- FONWEBAN, J.; GARDINER, B.; AUTY, D. Variable-top merchantable volume equations for scots pine (Pinus sylvestris) and sitka spruce (Picea sitchensis (Bong.) Carr.) in Northern Britain. Foresty, v. 85, p. 237-253, 2012.
- FORTIN, M.; SCHNEIDER, R.; SAUCIER, J.P. Volume and error variance estimation using integrated stem taper models. Forest Science , v. 59, p. 345-358, 2013.
- GERVORKIANTZ, S.R.; OLSEN, L.P. Composite volume tables for timber and their application in the Lake States. United States Department of Agriculture, Technical Bulletin, 1104. 1955. 51p.
- HANSEN, M.H.; HURWITZ, W.N.; MADOW, W.G. Sample survey methods and theory. New York, John Wiley & Sons, 1953. 638 p.
- HOHENADL, W. Der aufbau der baumschafte. Forstwiss Cbl, v. 44, p. 17-18, 1924.
- JESSEN, R.J.; BLYTE Jr., R.H.; KEMPTHORNE, O.; DEMING, W.E. On a population sample for Greece. Journal of the American Statistical Association, v. 42, p. 357-384, 1947.
- LO, C.S.; LIN, C. Growth-competition-based stem diameter and volume modeling for tree-level forest inventory using airborne LiDAR data. IEEE Transactions on Geoscience and Remote Sensing, v. 51, p. 2216-2226, 2013.
- McROBERTS, R.E.; MOSER, P.; OLIVEIRA, L.Z.; VIBRANS, A.C. A general method for assessing the effects of uncertainty in individual-tree volume model predictions on large-area volume estimates with a subtropical forest illustration. Canadian Journal of Forest Research, v. 45, p. 44-51, 2015.
- MIGUEL, E.P.; REZENDE, A.V.; PEREIRA, R.S.; AZEVEDO, G.B.; MOTA, F.C.M.; SOUZA, A.N.; JOAQUIM, M.S. Modeling and prediction of volume and aereal biomass of the tree vegetation in a Cerradão area of central Brazil. Interciência, v. 42, p. 21-27, 2017.
- MOCHIUTTI, S. Produtividade e sustentabilidade de plantações de acácia-negra (Acacia mearnsii De Wild.) no Rio Grande do Sul. Tese de doutorado, Universidade Federal do Paraná. 2007.
- ÖZÇELİK, R.; BAL, C. Effect of adding crown variables in stem taper and volume predictions for black pine. Turkey Journal of Agriculture and Forestry, v. 37, p. 231-242, 2013.
- ÖZÇELIK, R.; BROOKS, J.R. Compatible volume and taper models for economically important tree species of Turkey. Annals of Forest Science , v. 69, p. 105-118, 2012.
- RUFINI, A.L; SCOLFORO, J.R.S; OLIVEIRA, A.D; MELLO, J.M. Equações volumétricas para o cerrado sensu stricto, em Minas Gerais. CERNE, v. 16, p. 1-11, 2010.
- SANQUETTA, C.R., DALLA CORTE, A.P., BEHLING, A., OLIVEIRA, L.R., PÉLLICO NETTO, S., RODRIGUES, A.L, SANQUETTA, M.N.I. Selection criteria for linear regression models to estimate individual tree biomasses in the Atlantic Rain Forest, Brazil. Carbon Balance Management, v. 13, p. 25, 2018.
- SCHUMACHER, F.X.; HALL, F.S. Logarithmic expression of timber-tree volume. Journal of Agriculture Research, v. 47, p. 719-734, 1933.
- SPURR, S.H. Forest Inventory. The Ronald Press Company, 476 p. 1952.
- TÉO, S. J.; MACHADO, S.A.; FIGUEIREDO FILHO, A; TOMÉ, M. Equação de volume de aplicabilidade extensiva a diversas classes de idade para Pinus taeda l., na região meio oeste do estado de Santa Catarina. Revista Brasileira de Biometria, v. 36, p. 668, 2018.
- URBANO, E.; MACHADO, S.A.; FIGUEIREDO FILHO, A.; SANQUETTA, C.R.; CAMANO, J. Z. Modelación del volumen de rodal para especies secundarias en bosques nativos de Mimosa scabrella en la región metropolitana de Curitiba, Paraná, Brasil. Bosque, v. 39, p. 1, 2018.
- UVILLA, J.A.R.; GARCÍA-MAGAÑA, J.J.; HERNÁNDEZ-RAMOS, J.; GARCÍA-CUEVAS X.; VELARDE-RAMÍREZ, J.C.; MUÑOZ-FLORES, H.J.; ESPINOZA, G.G.G. Ecuaciones y tablas de volumen para dos especies de pinus de la sierra Purhépecha, Michoacán. Revista Mexicana de Ciencias Florestales, v. 5, p. 92-108, 2014.
- VER PLANCK, N.R.; MacFARLANE, D.W. Modelling vertical allocation of tree stem and branch volume for hardwoods. Forestry, v. 87, p. 459-469, 2014.
- VIBRANS, A.C.; MOSER, P.; OLIVEIRA, L.Z.; MAÇANEIRO, J.P. Generic and specific stem volume models for three subtropical forest types in southern Brazil. Annals of Forest Science , v. 72, p. 865-874, 2015.
- WILMOTT, C.L.; MATSUURA, K. Advantages of the mean absolute error (MAE) over the root mean square error (RMSE) in assessing average model performance. Climate Research, v. 30, p. 79-82, 2005.
HIGHLIGHTS
-
1
Tree volumes can alternatively be obtained by ratio estimates.
-
2
When form factor is associated only to the exponent of diameter results in a more precise stem volume.
-
3
Ratio estimates resulted in more accurate stem volume compared to other traditional model using regression analysis.
Publication Dates
-
Publication in this collection
30 Mar 2020 -
Date of issue
Oct-Dec 2019
History
-
Received
21 Feb 2019 -
Accepted
11 Sept 2019


 (cm)
(cm) (m)
(m) (m³)
(m³)
 (m³)
(m³) (m²)
(m²) 


