ABSTRACT
The objective of this study was to use quantitative traits to estimate the genetic distance among E. pellita provenances and progenies, to inform possible hybridization strategies in a species improvement program. A provenance and progeny test with 118 progenies from seven provenances was evaluated. The following quantitative traits were measured at seven years of age: diameter at breast height (DBH); height; and individual volume. The data were submitted to REML/BLUP analysis to obtain the predicted genetic value (BLUP). From this, the Mahalanobis (D²) genetic distance was estimated for provenances and progenies, which were then grouped by Tocher’s method, the unweighted pair group method using arithmetic averages (UPGMA), and principal component analysis (PCA). In total, 29 divergent groups were obtained among progenies based on Tocher’s method, which showed greater reliability according to the cophenetic correlation coefficient than UPGMA. The opposite was found between provenances, where the results for UPGMA demonstrated greater clustering reliability. Based on principal component analysis (PCA), the M. Ray and Tully provenances were the most similar, while Connl. A and Orchard were the most divergent. Height was the most important trait in estimating genetic distance. The results obtained offer important insights for breeding programs; with this information, crosses can be designed between contrasting individuals among and within provenances to obtain E. pellita hybrids, validating the possible heterotic groups identified through the genetic distance and grouping methods.
Keywords:
Multivariate analysis; forest improvement; heterotic groups; hybrids
INTRODUCTION
In Brazil, Eucalyptus pellita F. Muell is an important species in hybridization, particularly in forest frontier regions, as there is a need to incorporate a range of characteristics, such as high levels of growth, basic density, and cellulose yield, into one single genotype (Resende and Assis, 2008RESENDE, M. D. V.; ASSIS, T. F. Seleção recorrente recíproca entre populações sintéticas multi-espécies (SRR-PSME) de eucalipto. Pesquisa Florestal Brasileira, n. 57, p. 57-60, 2008.). In addition, E. pellita has been exploited for its resistance to drought and diseases, such as eucalyptus rust (Puccinia psidii) and leaf spots caused by fungi of the genus Cylindrocladium (Resende and Assis, 2008RESENDE, M. D. V.; ASSIS, T. F. Seleção recorrente recíproca entre populações sintéticas multi-espécies (SRR-PSME) de eucalipto. Pesquisa Florestal Brasileira, n. 57, p. 57-60, 2008.; Assis et al., 2015ASSIS, T. F.; ABAD, J. I. M.; AGUIAR, A. M. Melhoramento genético do eucalipto, In: SCHUMACHER, M. V.; VIEIRA, M. Silvicultura do eucalipto no Brasil. UFSM, 2015. p. 217-244.). Therefore, in breeding programs, there is interest in incorporating these characteristics through the development of interspecific hybrids with high-productivity species, such as Eucalyptus grandis and Eucalyptus urophylla (Assis et al., 2015ASSIS, T. F.; ABAD, J. I. M.; AGUIAR, A. M. Melhoramento genético do eucalipto, In: SCHUMACHER, M. V.; VIEIRA, M. Silvicultura do eucalipto no Brasil. UFSM, 2015. p. 217-244.).
Due to the increasing attention given to using E. pellita parents to provide complementary alleles in hybridization, understanding the genetic divergence between populations and parents of these populations is crucial. For this, multivariate analysis methods to estimate genetic divergence between genotypes, such as Euclidean or Mahalanobis distance, are useful in defining potential parents in breeding programs (Cruz et al., 2014CRUZ, C. D.; REGAZZI, A. J.; CARNEIRO, P. C. S. Modelos biométricos aplicados ao melhoramento genético . Editora UFV, 2014. 668p.; Resende et al., 2014RESENDE, M. D. V.; SILVA, F. F.; AZEVEDO, C. F. Estatística matemática, biométrica e computacional: Modelos mistos, multivariados, categóricos e generalizados (REML/BLUP), inferência bayesiana, regressão aleatória, seleção genômica, QTL-GWAS, estatística espacial e temporal, competição, sobrevivência. Suprema, 2014. 881p. ).
However, due to the large number of combinations between pairs of divergent parents, visual identification of groups is not feasible; thus, it is necessary to use grouping methods, such as Tocher’s optimization method and the Unweighted Pair-Group Method using Arithmetic Averages (UPGMA), to facilitate reliable analysis (Cruz et al., 2012CRUZ, C. D.; REGAZZI, A. J.; CARNEIRO, P. C. S. Modelos biométricos aplicados ao melhoramento genético. Editora UFV, 2012. 480p. ). In recent studies, the generalized Mahalanobis distance showed satisfactory results when estimating genetic divergence in forest species such as Pinus caribaea var. caribaea (Silva et al., 2012SILVA, J. M.; AGUIAR, A. V.; MORI, E. S.; MORAES, M. L. T. Divergência genética entre progênies de Pinus caribaea var. caribaea com base em caracteres quantitativos. Pesquisa Florestal Brasileira , v. 32, n. 69, p. 69-77, 2012.), Eucalyptus camaldulensis (Costa et al., 2016COSTA, R. B.; SILVA, J. C.; SKOWRONSKI, L.; CONSTANTINO, M.; PISTORI, H.; PINTO, J. V. C. Genetic divergence in Eucalyptus camaldulensis progenies in the Savanna Biome in Mato Grosso, Brazil. PLoS ONE, v. 11, n. 9, e0163698, 2016.), and Corymbia citriodora (Luz et al., 2018LUZ, O. S. L.; HONÓRIO, A. B. M.; FIDELIS, R. R.; NASCIMENTO, I. R.; MORAES, C. B.; LEAL, T. C. A. B. Characteristics for the selection of parents of Corymbia citriodora aiming to the production of wood and essential oil. Revista Árvore, v. 42, n. 1, 2018.), along with Tocher’s optimization method and UPGMA, which were applied to identify divergent groups.
A widespread concept in agricultural studies, particularly studies on corn, is the identification of a heterotic group, which is a set of related inbred lines that when crossed with lines from different groups tend to form potential hybrids (Ertiro et al., 2017ERTIRO, B. T.; SEMAGN, K.; DAS, B.; OLSEN, M.; LABUSCHAGNE, M.; WORKU, M.; WEGARY, D.; AZMACH, G.; OGUGO, V.; KENO, T.; ABEBE, B.; CHIBSA, T.; MENKIR, A. Genetic variation and population structure of maize inbred lines adapted to the mid-altitude sub-humid maize agro-ecology of Ethiopia using single nucleotide polymorphic (SNP) markers. BMC Genomics, v. 18, p. 777, 2017.). These heterotic groups are obtained from diallel crosses, where the potential genotypes are crossed with each other. As such, it is possible to estimate the heterosis of each crossing, along with the specific combining ability (SCA) which measures the complementarity of favorable alleles (Souza Junior, 2001SOUZA JUNIOR, C. L. Melhoramento de espécies alógamas. In: NASS, L. L.; VALOIS, A. C. C.; MELO, I. S.; VALADARES-INGLIS, M. C. Recursos genéticos e melhoramento de plantas. Ed. Fundação MT: Rondonópolis, 2001. p. 159-199.).
Questions remain as to which genotypes should be used in hybridization, so that the crosses performed are effective and maximize the number of potential hybrids. Thus, it is essential to evaluate the feasibility of methodologies that group genetically divergent parents, which can help choose the parents to be used in diallelic designs.
Therefore, the objective of this study was to identify genetic distance and group E. pellita provenances and progenies based on quantitative traits, to support hybridization strategies in a breeding program for the species.
MATERIAL AND METHODS
Experimental data
The evaluated experiment is an open-pollinated provenance/progeny test of E. pellita belonging to the company Suzano S.A., located in the municipality of Mucuri, Bahia State, Brazil (latitude 18° 01’ 23.14” S and longitude 39° 54’ 45.18” W). The climate in the region according to the Köppen classification (Alvares et al., 2013ALVARES, C. A.; STAPE, J. L.; SENTELHAS, P. C.; GONÇALVES, J. L. M.; SPAROVEK, G. Köppen’s climate classification map for Brazil. Meteorologische Zeitschrift, v. 22, n. 6, p. 711-728, 2013.) is Af, or rainforest without dry season, with long, hot summers, average annual rainfall of 1,583 mm, and average annual temperature of 24.3 °C. The soil classification of the site is yellow Argisol, and the elevation is 78 m.
The trial was installed using a randomized block design, with five replications in linear plots of nine plants, 119 treatments, 118 progenies from seven provenances (Table 1) and a commercial clone used as a control. The control is a E. grandis x E. urophylla hybrid from the 2nd generation of an improvement program located in the extreme south coast of Bahia, Brazil. The clone was obtained through open pollination of E. grandis (seeds Coffs Harbor, Australia and Flores Island, Indonesia) and E. urophylla (seeds from Anhembi, São Paulo, Brazil). The spacing used for planting was 3x2 m.
The provenances Helenvale, M. Ray, Tully, Connl. A, Black M. Road, and Creb Track are natural populations from the north coast of the state of Queensland, Australia. The Orchard provenance is from Papua New Guinea (Figure S1, Supplementary Material) and is a seed orchard of E. pellita seedlings, with an undefined degree of improvement. This orchard was established in the early 1990s from a collection of seeds belonging to the Commonwealth Scientific and Industrial Research Organization (CSIRO).
At seven years of age, quantitative silvicultural traits were measured, including diameter at breast height (DBH, cm) and total height (m). The DBH, total height, and a form factor (ƒ) of 0.42 were used to estimate the individual volume (m³) with the equation 1, where,ƒ is the form factor (0.42); π is the mathematical constant Pi; DBH is diameter at breast height; and H is total height.
Statistical analysis
To estimate the predicted genetic values (BLUP), a mixed linear model was adjusted from the statistical package lme4 (Bates et al., 2015BATES, D.; MÄCHLER, M.; BOLKER, B. M.; WALKER, S. C. Fitting linear mixed-effects models using lme4. Journal of Statistical Software, v. 67, n. 1, p. 1-48, 2015. ), which is suggested for analysis of mixed models, using the Restricted maximum likelihood/best linear unbiased prediction method (REML/BLUP). The “ranef” function was used to extract the random effects corresponding to adjustments to the model.
The mixed linear model was adjusted with the aid of the R statistical software (R Core Team, 2019R Core Team. R: A language and environment for statistical computing. R Foundation for Statistical Computing. Vienna, Austria, 2019.): [2] in which Y ijkl is the phenotypic value of the th individual of the th progeny of the th provenance in the th repetition; μ is the fixed term of the general average of the trait under analysis; b i is the fixed effect of the th repetition; t j is the random effect of the th provenance; j:k is the random effect of the th progeny on the th provenance;ƒ (tb)ij is the effect of the interaction between the th provenance and the th repetition;ƒ (b)j:ki is the effect of the interaction between the th repetition and the th progeny of the th provenance; e ijkl is the effect of the relative experimental error of the th tree within the th progeny of the th provenance in the th repetition.
Genetic distance and clusters
The genetic distance between provenances and progenies was estimated using the Generalized Mahalanobis Distance (Mahalanobis, 1936MAHALANOBIS, P. C. On the generalized distance in statistics. Proceedings of the National Institute of Science of India, v. 2, p. 49-55, 1936.), in the vegan package with the “vegdist” function (Oksanen et al., 2018OKSANEN, J.; BLANCHET F. G.; FRIENDLY, M.; KINDT, R.; LEGENDRE, P.; MCGLINN, D.; MINCHIN, P. R.; O’HARA, R. B.; SIMPSON, G. L.; SOLYMOS P.; STEVENS, M. H. H.; SZOECS, E.; WAGNER, H. Vegan: community ecology package. R package, version 2.5-1. Available at: Available at: https://cran.r-project.org/web/packages/vegan/vegan.pdf . Accessed in: February 20th 2018.
https://cran.r-project.org/web/packages/...
). As recommended by Resende et al. (2014RESENDE, M. D. V.; SILVA, F. F.; AZEVEDO, C. F. Estatística matemática, biométrica e computacional: Modelos mistos, multivariados, categóricos e generalizados (REML/BLUP), inferência bayesiana, regressão aleatória, seleção genômica, QTL-GWAS, estatística espacial e temporal, competição, sobrevivência. Suprema, 2014. 881p. ), the predicted genetic values (BLUP) of DBH, height, and volume were used to calculate the Mahalanobis distance (D²).
From the Mahalanobis distance (D2), the progenies and provenances were grouped using the mutually exclusive Tocher’s Optimization Method (Rao, 1952RAO C. R. Advanced statistical methods in biometric research. John Wiley & Sons, 1952. 390p.), with the “tocher” function in the biotools package (Silva et al., 2017SILVA, A. R.; MALAFAIA, G.; MENEZES, I. P. P. Biotools: an R function to predict spatial gene diversity via an individual-based approach. Genetics and Molecular Research, v. 16, n. 2, p. 1-6, 2017.). This method adopts as a criterion the inclusion of new progenies into the group, in which η = number of progenies that make up the original group; α = addition limit; = average intra-group distance, for the formation or inclusion of a new member.
if the progeny is included in the group;
if progeny “i” should not be included in the group;
The progenies and provenances were also grouped using UPGMA, as proposed by Nei (1978NEI, M. Estimation of average heterozygosity and genetic distance from a small number of individuals. Genetics, v. 89, p. 583-590, 1978.), using the vegan package (Oksanen et al., 2018OKSANEN, J.; BLANCHET F. G.; FRIENDLY, M.; KINDT, R.; LEGENDRE, P.; MCGLINN, D.; MINCHIN, P. R.; O’HARA, R. B.; SIMPSON, G. L.; SOLYMOS P.; STEVENS, M. H. H.; SZOECS, E.; WAGNER, H. Vegan: community ecology package. R package, version 2.5-1. Available at: Available at: https://cran.r-project.org/web/packages/vegan/vegan.pdf . Accessed in: February 20th 2018.
https://cran.r-project.org/web/packages/...
), in which the grouping of individuals results in a dendrogram of the identified clusters. This method uses the arithmetic means (unweighted) of the dissimilarity measures (D²), avoiding the use of extreme values between genotypes when forming the clusters.
In order to verify and guarantee reliability in the groups identified using the Tocher and UPGMA methods, the cophenetic correlation coefficient (CCC), as proposed by Sokal and Rohlf (1962SOKAL, R. R.; ROHLF, F. J. The comparison of dendrograms by objective methods. Taxon, v. 11, n. 2, p. 33-40, 1962.), was estimated. The significance of CCC was assessed using the Mantel test (Mantel, 1967MANTEL, N. The detection of disease clustering and generalized regression approach. Cancer Research, v. 27, p. 209-220, 1967.) with 1,000 bootstraps. The relative importance of each quantitative trait in the estimate of genetic distance was obtained through the methodology proposed by Singh (1981SINGH, D. The relative importance of characters affecting genetic divergence. The Indian Journal of Genetic and Plant Breeding, v. 41, p. 237-245, 1981.) and implemented in the biotools package.
All analyses were performed with the aid of the R statistical software environment (R Core Team, 2019R Core Team. R: A language and environment for statistical computing. R Foundation for Statistical Computing. Vienna, Austria, 2019.).
Principal component analysis
In addition to the clustering methods used, the predicted genetic values (BLUP) of the progenies and provenances were subjected to principal component analysis (PCA) to assess the similarity of the progenies and provenances through graphic dispersion of the main components PC1 and PC2 in a biplot chart. The ggbiplot package (Vu, 2011VU, V. Q. ggbiplot: A ggplot2 based biplot. R package version 0.55. 2011. Available at: Available at: http://github.com/vqv/ggbiplot . Accessed in: Accessed in: April 12th 2020.
http://github.com/vqv/ggbiplot...
) was used to obtain the components using the “princomp” function.
RESULTS
Genetic distance and clusters
Using the Mahalanobis distance matrix (Table S1, Supplementary Material), genetic distances ranged from D2 = 0.101 to D2 = 5.702 between progeny pairs. The smallest distance was found between progenies 116-O and 114-O, both from the Orchard provenance located in Papua New Guinea. The greatest genetic distance was found between progenies 99-CT and 54-C, from two different populations, Creb Track and Connl. A.
Based on Tocher’s method, 29 divergent groups were obtained (Table 2) from the BLUPs of the 118 progenies. In general, no pattern in the formation of the groups in relation to the provenances was discernable, except group 1 which was formed only by progenies of Orchard, Papua New Guinea.
The grouping criterion between progenies was α = 1.08, which was the value used for inclusion of the progenies in group 1 or the formation of new groups. Group 2 included the largest number of progenies, 22.9% of those evaluated, which came from five different populations: Black Mount Road, Creb Track, Helenvale, M. Ray, Tully.
The intergroup analysis revealed that the greatest genetic distance occurred between groups 7 and 26 (D² = 5.702). Group 7 is formed by progenies 110-O, 98-CT, 99-CT, belonging to Orchard and Creb Track, while group 26 was formed by a single progeny, 54-C, from Connl. A. The 48-T progeny belonging to group 25, has the highest productivity averages for DBH, height, and volume (Figure 1). Progenies 67-B, 76-B, and 28-M belonging to group 11 and 36-M belonging to group 24, also show growth above the test average.

Mean DBH, height, and individual volume of the 29 groups formed by Tocher’s method, for Eucalyptus pellita progenies assessed at seven years of age in Mucuri, Bahia, Brazil.
Considering the results of UPGMA, some similarities were observed between the groupings obtained by Tocher’s method (Figure 2), however they do not correspond completely.

Dendrogram obtained by UPGMA based on the generalized Mahalanobis distance (D²), forming 29 groups from the genetic values (BLUP) of 118 Eucalyptus pellita progenies at seven years of age, Mucuri, Bahia. Clockwise: increasing genetic distance; Counterclockwise: decreasing genetic distance.
Some progenies were grouped in different clusters when comparing the two methods. Those progenies identified by Tocher’s method as the group of progenies with the greatest similarity (group 1), were also grouped by UPGMA, but were included in two groups (the first and second groups clockwise).
Progenies 107-O, 108-O, 119-O, and 120-O belonging to the Orchard provenance were paired, with progenies 107-O and 119-O forming a group and 108-O and 120-O forming another. According to the dendrogram (Figure 2), the progenies present in the branches beginning from the counterclockwise direction form four groups that are the most divergent of the 118 evaluated progenies.
The provenances were grouped by Tocher’s method into three divergent groups, with group 1 made up of five of the seven provenances and Connl. A and Orchard making up groups 2 and 3, respectively (Table 3).
Grouping of Eucalyptus pellita provenances at seven years of age, using Tocher’s optimization method, based on the generalized Mahalanobis distance (D²), and the traits DBH, total height, and individual volume, in Mucuri, Bahia, Brazil.
The grouping criterion was α = 2.41, with provenances Connl. A and Orchard showing the greatest genetic distance (D² = 3.37). The least contrasting provenances were M. Ray and Tully, with an estimated minimum genetic distance of D² = 0.853. These were clustered in group 1, together with Black M. Road, Creb Track, and Halenvale.
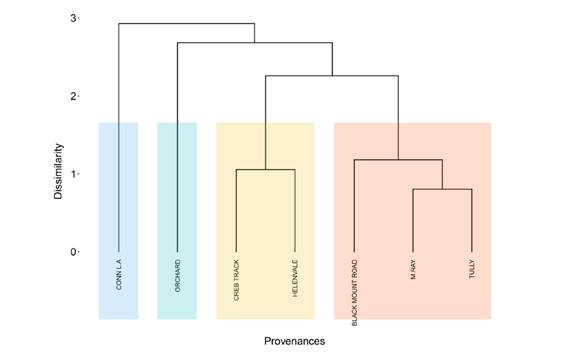
Based on the UPGMA, the grouping of the provenances (Figure 3) was similar to that identified by Tocher’s method, but they were grouped into four divergent groups by UPGMA, and three by Tocher. The Connl. A and Orchard provenances remained the most divergent; however, the Creb Track and Helenvale provenances were identified as a third group based on UPGMA, whereas using Tocher’s method they were grouped together with the other five provenances in the group of greatest similarity.

Dendrogram obtained by UPGMA based on the generalized Mahalanobis distance (D²) for seven provenances of Eucalyptus pellita at age seven.
Considering the two distinct grouping methods, UPGMA and Tocher’s optimization method, the groups do not fully correspond. For the grouping of progenies, Tocher’s presented a coefficient correlation coefficient (CCC) of 0.89, significant at 5% based on the Mantel test (Figure 4), while the grouping of the progenies by UPGMA showed a CCC of 0.63, significant at 5% based on the Mantel test.
For grouping the provenances using Tocher’s method, the CCC was 0.69 and significant at 1% (Figure 4), while the grouping with UPGMA presented a CCC = 0.86, significant at 5%.

Cophenetic correlation coefficients (CCC) between the Mahalanobis distance matrix (D²) of the Eucalyptus pellita provenances and progenies and the cophenetic matrices of Tocher’s clustering method and UPGMA.
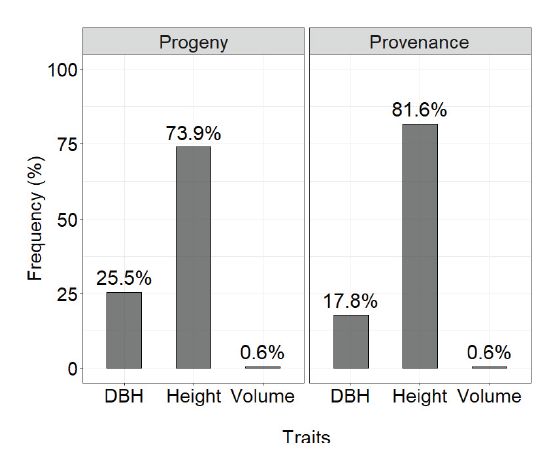
Considering the method described by Singh (1981SINGH, D. The relative importance of characters affecting genetic divergence. The Indian Journal of Genetic and Plant Breeding, v. 41, p. 237-245, 1981.), the variable that most contributed to the estimate of genetic divergence between the provenances and progenies at age seven was height, at 86.8% and 73.8%, respectively, followed by DBH at 12.6% and 25.7%, respectively (Figure 5). The individual volume contributed only 0.6% to the estimate of genetic divergence between the provenances and progenies.

Relative importance of the traits to estimate genetic divergence in progenies and provenances of Eucalyptus pellita at seven years of age.
Principal component analysis (PCA)
Principal component analysis for E. pellita progenies showed that the first two principal components explained 98.3% of the variability between BLUPs for quantitative traits (Figure 6). Principal component 1 (PC1) and 2 (PC2) contributed 90.7% and 7.6%, respectively. Based on their BLUP, the quantitative traits contributed similarly to PC1, with results for volume of 0.59, DBH of 0.57, and height of 0.56. For PC2, DBH (0.63) showed greater discriminatory power, followed by volume (0.12), with height acting in reverse (-0.76).

Dispersion of Eucalyptus pellita progenies according to the scores of the two principal components, based on the predicted genetic values (BLUP) of the quantitative traits DBH, height, and volume, at seven years of age in Mucuri, Bahia, Brazil.
Progenies 75, 28, 110, 7, and 120, all of which belong to different provenances, showed the best BLUP performance for DBH. For height, progenies 76, 108, 98, 109, and 119 were closer to the vector g_Height and belong to the provenances Orchard, Creb Track, and Black M. Road. For volume, progenies 67, 15, and 120 showed the best performance in terms of BLUP. We found no evident pattern of progeny distribution in relation to the provenances, where at least one progeny from each provenance stood out in relation to the traits evaluated.
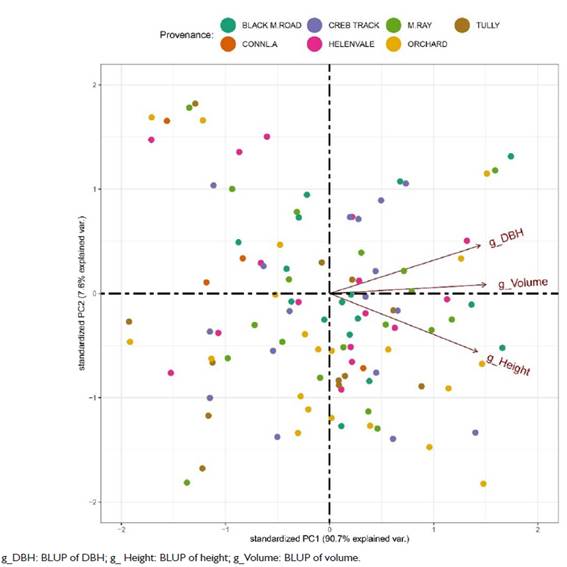
Through the dispersion of the scores of the principal components, it was also possible to assess the similarity of the provenances in terms of genetic values (BLUP) for DBH, height, and volume. The first two principal components explained 99.6% of the variability between BLUPs of quantitative traits (Figure 7). Principal component 1 (PC1) and principal component 2 (PC2) contributed 70.5% and 29.1%, respectively, with variance among E. pellita provenances. The trait with the greatest discriminatory power in PC1 was volume (0.68), followed by DBH (0.64) and height (0.35). For PC2, height (-0.92) again showed inverse discriminatory power in contrast to DBH (0.37) and volume (0.12).

Dispersion of Eucalyptus pellita provenances according to the scores of the two principal components, based on the predicted genetic values (BLUP) of the quantitative traits DBH, height, and volume, at seven years of age in Mucuri, Bahia, Brazil.
A distinct group can be seen between Helenvale, Black M. Road, and Creb Track as these provenances performed better in terms of BLUP for DBH and volume. As observed in the grouping methods mentioned above, Connl. A and Orchard were distinct from other provenances. Connl. A showed performance for DBH and volume contrary to that presented by the other provenances and with a particularly poor performance for height. Meanwhile, the Orchard provenance showed the best performance for BLUP in terms of height.
DISCUSSION
Genetic distance and clusters
Although DBH, height, and volume are highly correlated and result in multicollinearity, these traits should not be disregarded in studies of divergence, as they are particularly important for forest improvement. To alleviate this problem, the Mahalanobis distance standardizes and compensates for the existing correlation between these traits, while also considering the magnitude of the variance and residual covariance. As such, it offers an alternative for studies with traits that present multicollinearity (Hair Júnior et al., 2009HAIR JÚNIOR, J. F.; BLACK, W. C.; BABIN, B. J.; ANDERSON, R. E.; TATHAM, R. L. Análise multivariada de dados. Bookman, 2009. 688p.; Resende et al., 2014RESENDE, M. D. V.; SILVA, F. F.; AZEVEDO, C. F. Estatística matemática, biométrica e computacional: Modelos mistos, multivariados, categóricos e generalizados (REML/BLUP), inferência bayesiana, regressão aleatória, seleção genômica, QTL-GWAS, estatística espacial e temporal, competição, sobrevivência. Suprema, 2014. 881p. ).
The Mahalanobis distance has been shown to be applicable in studies on a range of Eucalypts, such as E. maculata, E. tereticornis, E. urophylla, E. grandis, E. cloeziana, E. camaldulensis, E. resinifera and E. pauciflora (Trugilho et al., 1997TRUGILHO, P. F.; REGAZZI, A. J.; VITAL, B. R.; GOMIDE, J. L. Aplicação de algumas técnicas multivariadas na avaliação da qualidade da madeira de Eucalyptus e seleção de genótipos superiores para a produção de carvão vegetal. Revista Árvore , v. 21, n. 1, p. 113-130, 1997.; Gauli et al., 2015GAULI, A.; VAILLANCOURT, R. E.; BAILEY, T. G.; STEANE, D. A; POTTS, B. M. Evidence for local climate adaptation in early-life traits of Tasmanian populations of Eucalyptus pauciflora. Tree Genetics & Genomes, v. 11, n. 5, p. 104, 2015.), and other forest species, such as Dalbergia sissoo (Kumar et al., 2016KUMAR, A.; RAVICHANDRAN, S.; DOBHAL, S.; KUMAR, V. D² analysis for estimating genetic divergence in different clones of Dalbergia sissoo. Journal of forestry research, v. 27, n. 5, p. 1085-1097, 2016.), P. caribaea var. bahamensis (Silva et al., 2012SILVA, J. M.; AGUIAR, A. V.; MORI, E. S.; MORAES, M. L. T. Divergência genética entre progênies de Pinus caribaea var. caribaea com base em caracteres quantitativos. Pesquisa Florestal Brasileira , v. 32, n. 69, p. 69-77, 2012.). The use of the Mahalanobis distance in conjunction with Tocher’s method was also positively assessed by Costa et al. (2016COSTA, R. B.; SILVA, J. C.; SKOWRONSKI, L.; CONSTANTINO, M.; PISTORI, H.; PINTO, J. V. C. Genetic divergence in Eucalyptus camaldulensis progenies in the Savanna Biome in Mato Grosso, Brazil. PLoS ONE, v. 11, n. 9, e0163698, 2016.), who classified both methods as effective in evaluating quantitative traits such as DBH and height in E. camaldulensis.
The minimum distance between the progenies (D² = 0.101) is equivalent to the existing distance between the progenies belonging to group 1, meaning that the progenies in this group are the most similar. This group was formed mostly by progenies from the Orchard provenance of Papua New Guinea (seven progenies) in addition to three progenies from the Tully provenance. The genetic similarity between progenies in group 1 may be the result of seed collection strategies used to develop the Orchard in Papua New Guinea, as some seeds from matrices in the Tully region may have been used. These provenances are geographically distant (Figure S1, Supplementary Material), thus preventing the occurrence of gene flow between these populations. Information about how the Orchard provenance was installed is important to understand this similarity between progenies and provenances. For example, it is unclear which populations were included in seed collection, or if there was previous use of genetic diversity methodologies in the formation of the Orchard. However, this information is unknown.
The concentration of 22.9% of the evaluated progenies in group 2, from five different provenances (Black Mount Road, Creb Track, Helenvale, M. Ray, Tully), may be related to the geographical proximity of these populations, which enabled gene flow between them (Figure S1, Supplementary Material). Orchard and Connl. A were the only provenances that did not contribute any progeny to group 2, possibly because they are isolated from the other populations (Table 2).
From the intergroup analysis, we identified the existence of groups with productive progenies in terms of DBH, height, and volume, for example progeny 48-T belonging to group 25, progenies 67-B, 76-B, and 28-M belonging to group 11, and 36-M belonging to group 24 (Figure 1). However, these groups have low and/or moderate genetic distance. Therefore, crossing between individuals in these groups is not recommended as it is likely that there would be no heterotic effect for the evaluated traits (DBH, height, and volume). Groups 25, 11, 9, 20, 7, 24, and 1 are the most productive in terms of individual volume and are thus strategic groups that can be used in hybridization.
In terms of improvement, the highest levels of heterosis tend to occur when individuals from genetically divergent groups and populations are crossed (Lee, 1995LEE, M. DNA markers and plant breeding programs. Advances in Agronomy, v. 55, p. 265-344, 1995. ; Souza Junior, 2001SOUZA JUNIOR, C. L. Melhoramento de espécies alógamas. In: NASS, L. L.; VALOIS, A. C. C.; MELO, I. S.; VALADARES-INGLIS, M. C. Recursos genéticos e melhoramento de plantas. Ed. Fundação MT: Rondonópolis, 2001. p. 159-199.). Thus, individuals from the same group should not be crossed with each other, as kinship between related individuals may occur, which can result in inbreeding and compromise the continuity of the improvement program (Kageyama, 1981KAGEYAMA, P. Y. Endogamia em espécies florestais. IPEF (Série Técnica), v. 2, n. 8, p. 1-40, 1981.).
The number of dendrogram clusters (Figure 2) obtained by UPGMA was pre-defined based on the number of groups identified using Tocher’s method. Some similarities were observed between the groupings obtained by both methods (Table 2), but the results are not identical, since some progenies were grouped in different clusters. Group 1, which Tocher’s method identified as the group of progeny with the greatest similarity, was also similarly classified by UPGMA, where the first and second groups (from left to right) include the progenies in group 1.
We can see that groups were formed of progenies from different provenances, demonstrating that the groups did not follow a pattern based solely on geographical location. Other factors, such as genetic drift and natural selection, can contribute to the formation of groups with different progenies (Sebbenn et al., 2005SEBBENN, A. M.; FREITAS, M. L. M.; MORAIS, E.; ZANATTO, A. C. S. Variação genética em procedências e progênies de Pinus patula ssp. tecunumanii no Noroeste do Estado de São Paulo. Revista Instituto Florestal, v. 17, n. 1, p. 1-15, 2005.). According to Aslam et al. (2011ASLAM, M.; RESHI, Z. A.; SIDDIQI, T. O. Genetic divergence in half-sib progenies of Pinus wallichiana A. B. Jackson plus trees in the Kashmir Himalaya, India. Tropical Ecology, v. 52, n. 2, p. 201-208, 2011.), when groups include progenies from different provenances, one hypothesis is that the species has genetic uniformity, which may be the case in E. pellita and should be further investigated.
In this study, we did not evaluate progeny for tolerance to pests and diseases. Nevertheless, these are important characteristics of E. pellita that make the species attractive for forest improvement programs, and particularly for hybridization, which is the main focus of this study. However, we must consider including in crosses those individuals that may be disease/pest tolerant not only in groups with high- or intermediate-level growth, but also those in the least productive progenies. Therefore, it is important to identify E. pellita individuals with resistance to Puccinia psidii (rust), as previously reported in the literature (Santos et al., 2014SANTOS, M. R.; GUIMARÃES, L. M. S.; RESENDE, M. D. V.; ROSSE, L. N.; ZAMPROGNO, K. C.; ALFENAS, A. C. Resistance of Eucalyptus pellita to rust (Puccinia psidii). Crop Breeding and Applied Biotechnology , v. 14, n. 4, p. 244-250, 2014.), including in the Helenvale provenance (Roux et al., 2015ROUX, J.; GERMISHUIZEN, I.; NADEL, R.; LEE, D. J.; WINGFIELD, M. J.; PEGG, G. S. Avaliação de risco para o estabelecimento de Puccinia psidii na África do Sul. Plant Pathology, v. 64, n. 6, p. 1326-1335, 2015.). Resistance to other diseases, such as those caused by Ceratocystis fimbriata (ceratocystis wild) and Cylindrocladium pteridis (leaf spot and defoliation) (Guimarães et al., 2010GUIMARÃES, L. M. S.; TITON, M.; LAU, D.; ROSSE, L. N.; OLIVEIRA, L. S. S.; ROSADO, C. C. G.; CHRISTO, G. G. O.; ALFENAS, A. C. Eucalyptus pellita as a source of resistance to rust, ceratocystis wilt and leaf blight. Crop Breeding and Applied Biotechnology, v. 10, n. 2, p. 124-131, 2010.), should also be considered in diallel designs along with individuals from fast-growing species such as E. grandis, to evaluate all possible crosses and identify the presence of heterosis of these crossings (Souza Junior, 2001SOUZA JUNIOR, C. L. Melhoramento de espécies alógamas. In: NASS, L. L.; VALOIS, A. C. C.; MELO, I. S.; VALADARES-INGLIS, M. C. Recursos genéticos e melhoramento de plantas. Ed. Fundação MT: Rondonópolis, 2001. p. 159-199.).
The use of E. pellita to compose hybrids in combination with highly productive species has potential, as E. pellita has shown high levels of resistance to diseases caused by Cylindrocladium (Rodas et al., 2005RODAS, C. A.; LOMBARD, L.; GRYZENHOINF, M.; SLIPPERS, B.; WINGFIELD, M. J. Cylindrocladium blight of Eucalyptus grandis in Colombia. Australian Plant Pathology, v. 34, n. 2, p. 143-149, 2005.). This is particularly important for regions in which the disease affects productivity, for example in Northern Brazil, which is also a forest frontier region (Assis et al., 2015ASSIS, T. F.; ABAD, J. I. M.; AGUIAR, A. M. Melhoramento genético do eucalipto, In: SCHUMACHER, M. V.; VIEIRA, M. Silvicultura do eucalipto no Brasil. UFSM, 2015. p. 217-244.). Therefore, it is important that the variability of E. pellita populations existing in Brazil is maintained, and forest improvement activities to adapt the species must not weaken existing tolerance (Silva et al., 2018SILVA, P. H. M.; PAULA, R. C.; MORAES, M. L. T. Melhoramento de Populações de Eucaliptos. IPEF, 2018. 108p.).
The fact that the groupings of the provenances by UPGMA (Figure 3) and Tocher’s method (Table 3) are similar demonstrates that both methods were able to identify the distances between each provenance pair. However, UPGMA was more robust as it was able to separate the provenances into four groups, instead of three as with Tocher. The robustness of UPGMA in the grouping of provenances is shown through the CCC = 0.86, which is higher than Tocher’s method CCC = 0.69 (Figure 4). This coefficient describes the similarity between the Mahalanobis distance matrix and the cophenetic matrix of each evaluated method, that is, it indicates how representative the Mahalanobis distance is in the groups formed (Sokal and Rohlf, 1962SOKAL, R. R.; ROHLF, F. J. The comparison of dendrograms by objective methods. Taxon, v. 11, n. 2, p. 33-40, 1962.).
For the progeny, the magnitude of the CCC (Figure 4) suggests that the groups formed by Tocher’s method (CCC = 0.89) are more reliable than the groups formed by UPGMA (CCC = 0.63); according to Rohlf (1970ROHLF, F. J. Adaptative hierarchical clustering schemes. Systematic Zoology, v. 19, n. 1, p. 58-82, 1970.), a CCC less than 0.7 indicates inadequate or limited reliability of the cluster.
Despite the fact that height had a greater relative importance in estimating the genetic distance between progenies and provenances (Figure 5) and volume was not very informative, this result must be considered with caution. At first glance, discarding the analysis of volume in estimating genetic distance would be indicated; however, the impact of discarding volume, or even DBH, must be weighed accordingly, given that it is one of the main traits used in selection. Santos et al. (2016SANTOS, W.; ARAÚJO, E. G.; SOUZA, D. C. L.; SILVA, J. R.; RECCO, C. R. S. B.; MORAES, M. L. T. AGUIAR, A. V. Divergência genética entre progênies de polinização aberta de Pinus caribaea var. hondurensis a partir de caracteres quantitativos. Pesquisa Florestal Brasileira , v. 36, n. 86, p. 127-133, 2016.) found contradictory results for Pinus caribaea var. hondurensis in terms of quantitative traits, where volume was the trait that contributed the highest percentage for genetic divergence (98%), followed by DBH (1.51%) and height (0.26%).
Considering the distribution of progenies in relation to BLUPs in the biplot graph (Figure 6), the fact that there is no evident pattern of progeny distribution in relation to provenances demonstrates a certain homogeneity across provenances, with greater divergence within provenances. The PCA analysis for provenances corroborates the results observed in the grouping methods, where Connl. A and Orchard were different from other provenances. The poor performance for the height of the Connl. A is likely one of the reasons for the distinct divergence from the other provenances, since height was the trait that most contributed to estimates of genetic divergence.
CONCLUSIONS
Groups of progenies identified by Tocher’s optimization method based on the Mahalanobis distance are more consistent than those obtained through UPGMA. Therefore, we recommended that crosses are performed between divergent and productive parents in order to determine through the resulting progenies if the groups identified by Tocher’s method can be used as heterotic groups in the hybridization of E. pellita. Australian provenances showed low genetic divergence, while the provenance from Papua New Guinea was the most genetically distant among all those studied. Height was the most important trait in estimating genetic distance.
ACKNOWLEDGEMENTS
To Suzano S.A. for the experiment deployment and the data. Mateus Chagas Andrade were supported by CAPES Master’s Degree scholarship. Professor Evandro Vagner Tambarussi, Ph.D. is supported by a National Counsel of Technological and Scientific Development (CNPq) research fellowship (Project n. 304899/2019-4).
REFERENCES
- ASLAM, M.; RESHI, Z. A.; SIDDIQI, T. O. Genetic divergence in half-sib progenies of Pinus wallichiana A. B. Jackson plus trees in the Kashmir Himalaya, India. Tropical Ecology, v. 52, n. 2, p. 201-208, 2011.
- ASSIS, T. F.; ABAD, J. I. M.; AGUIAR, A. M. Melhoramento genético do eucalipto, In: SCHUMACHER, M. V.; VIEIRA, M. Silvicultura do eucalipto no Brasil. UFSM, 2015. p. 217-244.
- ALVARES, C. A.; STAPE, J. L.; SENTELHAS, P. C.; GONÇALVES, J. L. M.; SPAROVEK, G. Köppen’s climate classification map for Brazil. Meteorologische Zeitschrift, v. 22, n. 6, p. 711-728, 2013.
- BATES, D.; MÄCHLER, M.; BOLKER, B. M.; WALKER, S. C. Fitting linear mixed-effects models using lme4. Journal of Statistical Software, v. 67, n. 1, p. 1-48, 2015.
- COSTA, R. B.; SILVA, J. C.; SKOWRONSKI, L.; CONSTANTINO, M.; PISTORI, H.; PINTO, J. V. C. Genetic divergence in Eucalyptus camaldulensis progenies in the Savanna Biome in Mato Grosso, Brazil. PLoS ONE, v. 11, n. 9, e0163698, 2016.
- CRUZ, C. D.; REGAZZI, A. J.; CARNEIRO, P. C. S. Modelos biométricos aplicados ao melhoramento genético. Editora UFV, 2012. 480p.
- CRUZ, C. D.; REGAZZI, A. J.; CARNEIRO, P. C. S. Modelos biométricos aplicados ao melhoramento genético . Editora UFV, 2014. 668p.
- ERTIRO, B. T.; SEMAGN, K.; DAS, B.; OLSEN, M.; LABUSCHAGNE, M.; WORKU, M.; WEGARY, D.; AZMACH, G.; OGUGO, V.; KENO, T.; ABEBE, B.; CHIBSA, T.; MENKIR, A. Genetic variation and population structure of maize inbred lines adapted to the mid-altitude sub-humid maize agro-ecology of Ethiopia using single nucleotide polymorphic (SNP) markers. BMC Genomics, v. 18, p. 777, 2017.
- GAULI, A.; VAILLANCOURT, R. E.; BAILEY, T. G.; STEANE, D. A; POTTS, B. M. Evidence for local climate adaptation in early-life traits of Tasmanian populations of Eucalyptus pauciflora Tree Genetics & Genomes, v. 11, n. 5, p. 104, 2015.
- GUIMARÃES, L. M. S.; TITON, M.; LAU, D.; ROSSE, L. N.; OLIVEIRA, L. S. S.; ROSADO, C. C. G.; CHRISTO, G. G. O.; ALFENAS, A. C. Eucalyptus pellita as a source of resistance to rust, ceratocystis wilt and leaf blight. Crop Breeding and Applied Biotechnology, v. 10, n. 2, p. 124-131, 2010.
- HAIR JÚNIOR, J. F.; BLACK, W. C.; BABIN, B. J.; ANDERSON, R. E.; TATHAM, R. L. Análise multivariada de dados. Bookman, 2009. 688p.
- KAGEYAMA, P. Y. Endogamia em espécies florestais. IPEF (Série Técnica), v. 2, n. 8, p. 1-40, 1981.
- KUMAR, A.; RAVICHANDRAN, S.; DOBHAL, S.; KUMAR, V. D² analysis for estimating genetic divergence in different clones of Dalbergia sissoo Journal of forestry research, v. 27, n. 5, p. 1085-1097, 2016.
- LEE, M. DNA markers and plant breeding programs. Advances in Agronomy, v. 55, p. 265-344, 1995.
- LUZ, O. S. L.; HONÓRIO, A. B. M.; FIDELIS, R. R.; NASCIMENTO, I. R.; MORAES, C. B.; LEAL, T. C. A. B. Characteristics for the selection of parents of Corymbia citriodora aiming to the production of wood and essential oil. Revista Árvore, v. 42, n. 1, 2018.
- MAHALANOBIS, P. C. On the generalized distance in statistics. Proceedings of the National Institute of Science of India, v. 2, p. 49-55, 1936.
- MANTEL, N. The detection of disease clustering and generalized regression approach. Cancer Research, v. 27, p. 209-220, 1967.
- NEI, M. Estimation of average heterozygosity and genetic distance from a small number of individuals. Genetics, v. 89, p. 583-590, 1978.
- OKSANEN, J.; BLANCHET F. G.; FRIENDLY, M.; KINDT, R.; LEGENDRE, P.; MCGLINN, D.; MINCHIN, P. R.; O’HARA, R. B.; SIMPSON, G. L.; SOLYMOS P.; STEVENS, M. H. H.; SZOECS, E.; WAGNER, H. Vegan: community ecology package. R package, version 2.5-1. Available at: Available at: https://cran.r-project.org/web/packages/vegan/vegan.pdf Accessed in: February 20th 2018.
» https://cran.r-project.org/web/packages/vegan/vegan.pdf - R Core Team. R: A language and environment for statistical computing. R Foundation for Statistical Computing. Vienna, Austria, 2019.
- RAO C. R. Advanced statistical methods in biometric research. John Wiley & Sons, 1952. 390p.
- RESENDE, M. D. V.; ASSIS, T. F. Seleção recorrente recíproca entre populações sintéticas multi-espécies (SRR-PSME) de eucalipto. Pesquisa Florestal Brasileira, n. 57, p. 57-60, 2008.
- RESENDE, M. D. V.; SILVA, F. F.; AZEVEDO, C. F. Estatística matemática, biométrica e computacional: Modelos mistos, multivariados, categóricos e generalizados (REML/BLUP), inferência bayesiana, regressão aleatória, seleção genômica, QTL-GWAS, estatística espacial e temporal, competição, sobrevivência. Suprema, 2014. 881p.
- RODAS, C. A.; LOMBARD, L.; GRYZENHOINF, M.; SLIPPERS, B.; WINGFIELD, M. J. Cylindrocladium blight of Eucalyptus grandis in Colombia. Australian Plant Pathology, v. 34, n. 2, p. 143-149, 2005.
- ROHLF, F. J. Adaptative hierarchical clustering schemes. Systematic Zoology, v. 19, n. 1, p. 58-82, 1970.
- ROUX, J.; GERMISHUIZEN, I.; NADEL, R.; LEE, D. J.; WINGFIELD, M. J.; PEGG, G. S. Avaliação de risco para o estabelecimento de Puccinia psidii na África do Sul. Plant Pathology, v. 64, n. 6, p. 1326-1335, 2015.
- SANTOS, M. R.; GUIMARÃES, L. M. S.; RESENDE, M. D. V.; ROSSE, L. N.; ZAMPROGNO, K. C.; ALFENAS, A. C. Resistance of Eucalyptus pellita to rust (Puccinia psidii). Crop Breeding and Applied Biotechnology , v. 14, n. 4, p. 244-250, 2014.
- SANTOS, W.; ARAÚJO, E. G.; SOUZA, D. C. L.; SILVA, J. R.; RECCO, C. R. S. B.; MORAES, M. L. T. AGUIAR, A. V. Divergência genética entre progênies de polinização aberta de Pinus caribaea var. hondurensis a partir de caracteres quantitativos. Pesquisa Florestal Brasileira , v. 36, n. 86, p. 127-133, 2016.
- SEBBENN, A. M.; FREITAS, M. L. M.; MORAIS, E.; ZANATTO, A. C. S. Variação genética em procedências e progênies de Pinus patula ssp. tecunumanii no Noroeste do Estado de São Paulo. Revista Instituto Florestal, v. 17, n. 1, p. 1-15, 2005.
- SILVA, A. R.; MALAFAIA, G.; MENEZES, I. P. P. Biotools: an R function to predict spatial gene diversity via an individual-based approach. Genetics and Molecular Research, v. 16, n. 2, p. 1-6, 2017.
- SILVA, J. M.; AGUIAR, A. V.; MORI, E. S.; MORAES, M. L. T. Divergência genética entre progênies de Pinus caribaea var. caribaea com base em caracteres quantitativos. Pesquisa Florestal Brasileira , v. 32, n. 69, p. 69-77, 2012.
- SILVA, P. H. M.; PAULA, R. C.; MORAES, M. L. T. Melhoramento de Populações de Eucaliptos. IPEF, 2018. 108p.
- SINGH, D. The relative importance of characters affecting genetic divergence. The Indian Journal of Genetic and Plant Breeding, v. 41, p. 237-245, 1981.
- SOKAL, R. R.; ROHLF, F. J. The comparison of dendrograms by objective methods. Taxon, v. 11, n. 2, p. 33-40, 1962.
- SOUZA JUNIOR, C. L. Melhoramento de espécies alógamas. In: NASS, L. L.; VALOIS, A. C. C.; MELO, I. S.; VALADARES-INGLIS, M. C. Recursos genéticos e melhoramento de plantas. Ed. Fundação MT: Rondonópolis, 2001. p. 159-199.
- TRUGILHO, P. F.; REGAZZI, A. J.; VITAL, B. R.; GOMIDE, J. L. Aplicação de algumas técnicas multivariadas na avaliação da qualidade da madeira de Eucalyptus e seleção de genótipos superiores para a produção de carvão vegetal. Revista Árvore , v. 21, n. 1, p. 113-130, 1997.
- VU, V. Q. ggbiplot: A ggplot2 based biplot. R package version 0.55. 2011. Available at: Available at: http://github.com/vqv/ggbiplot Accessed in: Accessed in: April 12th 2020.
» http://github.com/vqv/ggbiplot
HIGHLIGHTS
-
1
UPGMA and Tocher’s grouping methods showed contrasting results.
-
2
Tocher’s method was more reliable according to the cophenetic correlation coefficient.
-
3
Limited genetic distance was found between Eucalyptus pellita provenances.
-
4
Heterotic groups can be validated through crossings between divergent parents.
Publication Dates
-
Publication in this collection
14 Dec 2020 -
Date of issue
Oct-Dec 2020
History
-
Received
28 Apr 2020 -
Accepted
28 July 2020