Abstract
In iron ore pelletizing plants a range of process parameters such as particle size distribution, specific surface area, and moisture, must be controlled to achieve optimized operation conditions. Particle size distribution and specific surface area are controlled during the grinding operations. Moisture, however, is controlled during filtration of the ground products. This work investigates the relationship between particle morphology, filter cake moisture and filter capacity. The samples were taken during the filtration tests and referred to three different blends presenting distinct mineralogical features and similar chemical compositions in order to investigate the effects of only the hematite surface characteristics. Six types of morphology are distinguished: granular hematite, tabular hematite, martitic hematite, polycrystalline hematite, hematite-goethite aggregates and goethite. For each filtration test, the filter cloth product was characterised. The characterisation analysis revealed that blends containing martitic hematite concentration above 11.45 percent increased substantially the filter capacity. However, it had also caused an increasing in final moisture content that reached values around 10.0 % compared with industrial moisture specification that can vary on the range of 8.5 to 9.5 %.
Keywords:
hematite; optical microscopy; SEM; filtration; moisture
1. Introduction
In iron ore pelletizing plants, the process parameters must be under rigorous controlled conditions in order to maintain the process at optimized operating conditions. The industrial pelletizing process comprises the stages of the iron concentrate blend's preparation, formation of green balls and ball induration (Meyer, 1980MEYER, K. Pelletizing of iron ores. Berlin: Springer-Verlag, 1980. 302p.; Kelly & Spottiswood, 1982KELLY, E. G., SPOTTISWOOD, D. J. Introduction to mineral processing.New York: John Wiley & Sons, 1982. 491p.; Qiu et al., 2003QIU G. , JIANG T., LI H., WANG, D. Functions and molecular structure of organic binders for iron ore pelletization. Colloid and Surface A,v. 224, p.11-22, 2003.; Dwarapudi et al., 2008DWARAPUDI, S., DEVI, T. U., MOHAN RAO, S., RANJAN, M. Influence of pellet size on quality and microstructure of iron ore pellets. ISIJ International, v. 48, n. 6, p. 768-776, 2008.). The variables involved in iron ore concentrate blend preparation are particle size distribution, specific surface area, and filter cake moisture. Particle size distribution and specific surface area are controlled during the grinding stages, whereas the cake moisture is controlled during the filtration process. These operation variables are strongly influenced by the mineralogical features of the raw material to be processed, which interfere in the productivity indexes.
In grinding operations the efficiency may be expressed by relationships involving the initial and final particle size distributions. It can also be related to the ore blend specific surface area required up stream. It is a very intensive energy consuming stage being governed by the ore blends work index. The efficiency of the filtration process is marked by a relationship between the control of the filter cake moisture and capacity. It is also important to emphasize that the filter efficiency and cake moisture are also related to grinding parameters, such as final particle size distribution and specific surface area. The grinding process transforms the coarser ore particles into grains presenting distinct morphologies. In order to evaluate the physical controls exercised by the grinding process, the high-resolution aid of the scanning electron microscope was applied for microstructural characterization (Rowland & Kjos, 1997ROWLAND, C. A., KJOS, D. M. Rod and ball mills. In: KAWATRA, S. K. Comminution Practices. Colorado: Littleton, 1997. p. 319-338.; Prior et al., 1999PRIOR, D. J., BOYLE, A. P., BRENKER, F., CHEADLE, M. C., DAY, A., LOPEZ, G., PERUZZO, L., POTTS, G. J., REDDY, S. M., SPIESS, R., TIMMS, N. E., TRIMBY, P. W., WHEELER, J., ZETTERSTRÖM, L. The application of Electron Backscatter Diffraction and Orientation Contrast Imaging in the SEM to textural problems in rocks. American Mineralogist, v. 84, p. 1741-1759, 1999.; Mourão & Stegmiller, 1990MOURÃO, J. M., STEGMILLER, L. Influência da estrutura dos minérios de ferro na sua moabilidade. In: ENCONTRO NACIONAL DE TRATAMENTO DE MINÉRIOS E HIDROMETALURGIA, 14.Salvador, Anais... Salvador, v. 1, p. 228-243, 1990.; Santos et al., 2005SANTOS, L. D., BRANDÃO, P. R. G., SAMPAIO, D. A. Mineralogical and morphological characterization of iron ore types from Mina Gerais, Brazil - Influences on the specific surface area of concentrates. Minerals & Metallurgical Processing, v. 22, n. 2, p. 116-121, 2005.). Data about the filtration process of iron ore are restricted to the membrane fouling, measurement of filter height and large particles on microfiltration of small particles (Vyas et al., 2000VYAS, H. K., BENNETT, R. J., MARSHALL, A. D. Influence of feed properties on membrane fouling in crossflow microfiltration of particulate suspensions. International Dairy Journal, v. 10, p. 855-861, 2000.; Madaeni, 2000MADAENI, S. S. The effect of large particles on microfiltration of small particles. Journal of Porous Materials, v. 8, p. 143-148, 2000.; Saleem & Krammer, 2007SALEEM, M., KRAMMER, G. Optical in-situ measurement of filter cake height during bag filter plant operation. Powder Technology, v. 173, p. 93-106, 2007.; Haselhuhn et al., 2012HASELHUHN, H. J., SWANSON, K. P., KAWATRA, S. K. The effect of CO2 sparging on the flocculation and filtration rate of concentrated hematite slurries. International Journal of Mineral Processing, v. 112, p. 107-109, 2012.). However, the application of optical microscopy and electron microscopy techniques to understand the productivity of the filtering process has been increasing.
This paper is focused on the morphological feature types of the grains. Thus, filtration pilot tests were performed and the relationship between the moisture of the cake and the productivity was determined.
2. Materials and methods
The samples analyzed during the filtration pilot tests refer to three iron ore blends (blends 1, 2, and 3). The blends show distinct mineralogical features and similar chemical compositions; so that the filtration response can only be related to the morphologies effects. The blends are composed by six different ore concentrates. For blend composition, each one of these products is physically and chemically controlled in the pelletizing pilot plant. The chemical composition of these six concentrates designated as samples A, B, C, D, E and F are presented in Table 1.
The samples A, B, C, and F are flotation concentrates. Sample B was obtained via magnetic concentration and sample D was a screening product (P80= 8 mm). Those typical iron ore sample concentrates are produced in the daily industrial routine of the pelletizing plant.
The mineralogical characteristics of the samples were determined in four size class intervals [+1]mm, [-1+0.106]mm, [-0.106+0.045]mm and [-0.045]mm. The morphological types described were obtained in a scanning electron microscope (SEM) and in an optical microscope (OM). For the three-dimensional analyses, it was used SEM for carbon coated samples. For OM, it was considered 450 grains and/or polycrystals per grain size fraction. The relationship between the weight and morphological types of each grain size fraction defined the profile of each sample. In the same way, the three blends produced for filtration tests were obtained according to the association of weight products and mineralogical features.
Six different morphologies attributed to grains were identified: granular hematite, tabular hematite, martitic hematite, polycrystalline hematite, hematite-goethite aggregates, and goethite. The granular hematite is observed, under SEM, as grains with irregular surfaces, and under OM, as grains with an aspect ratio < 2. On the other hand, the tabular hematite consists of grains with plain to concave surfaces, under SEM, and the aspect ratio > 2, under OM. The martitic hematite grains show triangular sections derived from the topotactic transformation of magnetite to hematite. The high porosity of the martitic hematite grains is another evidence of the magnetite transformation to hematite (Barbosa & Lagoeiro, 2009BARBOSA, P. F., LAGOEIRO, L. Crystallographic texture of the magnetite-hematite transformation: evidence for topotactic relationships in natural samples from Quadrilátero Ferrífero, Brazil. American Mineralogist, v. 95, p.118-125, 2009.; Barbosa et al., 2011BARBOSA, P. F., SCHOLZ, R., GRAÇA, L., ALVAREZ, G. Electron Backscattering Diffraction (EBSD) as a tool to evaluate the topotactic and epitactic growth of minerals: the example of the magnetite and hematite. Microscopy and Microanalysis, v. 17, p. 408-409, 2011.). Occasionally, the pores contain variable amounts of the earthy-like goethite. Goethite in its earthy variety is a very fine material and occurs like crusts around the martitic hematite or filling cavities between grains in martitic hematite (Madaeni, 2000MADAENI, S. S. The effect of large particles on microfiltration of small particles. Journal of Porous Materials, v. 8, p. 143-148, 2000.). Polycrystalline hematite shows tabular and granular morphologies, combining sections with broad values of aspect ratio. The coexistence of hematite with goethite characterizes the hematite-goethite aggregates. The grains of granular and tabular hematite are dispersed in a goethitic matrix. Under OM, the goethite grains are identified by their shades of red and gray and irregular or saw-shaped edges.
Different blends were prepared and submitted to the grinding process in order to obtain a product with specific surface area of 1,900 cm2/g. This condition guarantees a product size below 0.045 mm. After grinding, each blend was submitted to filtration in an Humboldt-Wedag rotary disc vacuum filter, with dimensions of, respectively, 1,300 x 230 mm as disk and central duct diameters. The filter through put was equivalent to 2.5 t/h. Four samples (sample 1, 2, 3, and 4) weighing approximately 400 kg were collected for moisture determination and productivity rate (t/hm2).
Three samples representing each of the filter cake blends also had their morphological types characterized under SEM. In addition, the filter fabrics used for filtering were analyzed under SEM: two samples taken in each extreme of the filter sector, and the third taken at the central part. The morphologies of the cakes and the filtering fabric features were then related to the factors of efficiency of the filtration process, markedly moisture content and the productivity rate.
The determination of specific surface area values was conducted with the Fisher Scientific sub-sieve sizer model 95permeameter. The real density was determined by a gas pycnometer, from Quantachrome. The quantification of the moisture was made based on the difference between the mass of the natural sample before and after being dried in a lab for an hour at 105 °C. During the filtration tests, the vacuum pressure was set at 0.84 kg/cm2, the pulp density was maintained at 2.30 kg/L, and the final desired moisture for the filtered cake set between 8.5% and 9.5%. These conditions are kept the same as the applied to industrial operations.
3. Results
Results of size distribution, density, and specific surface area of the six iron ore concentrates are presented in Figure 1 and Table 2.
Results of density and specific surface area (standard deviation inside brackets) of the product samples.
The ore samples A, C, E and F consist of liberated grains iron oxide in which the following morphological types were recognized: sample A was characterized by the predominance of totally liberated tabular or granular hematite grains; sample C with predominance of tabular hematite grains and, samples E and F were predominantly composed by martitic hematite grains. Samples B display a high content of polycrystalline hematite and D are recognized by hematite grains in a goethite-rich matrix composed by hematite-goethite aggregates. These aggregates observed in samples B and D were not observed in the other ore samples (Figure 2). The morphological differences observed under SEM were also confirmed under OM and the results obtained for each sample are shown in Table 3.
Main mineralogical characteristics under SEM (left) and OM (right). Sample A with granular (Gr) and tabular (Tb) hematite; sample B with polycrystalline (Pol) hematite; sample C with tabular hematite; sample D with hematite-goethite aggregates (Agr) and samples E and F with martitic hematite (MH).
The blends for pilot plant filtration tests were prepared focusing on the varying percentage of the martitic hematite. It is important to mention that the chemical composition of each one of the three blends achieved the industry's standards. These proportions are presented in Table 4.
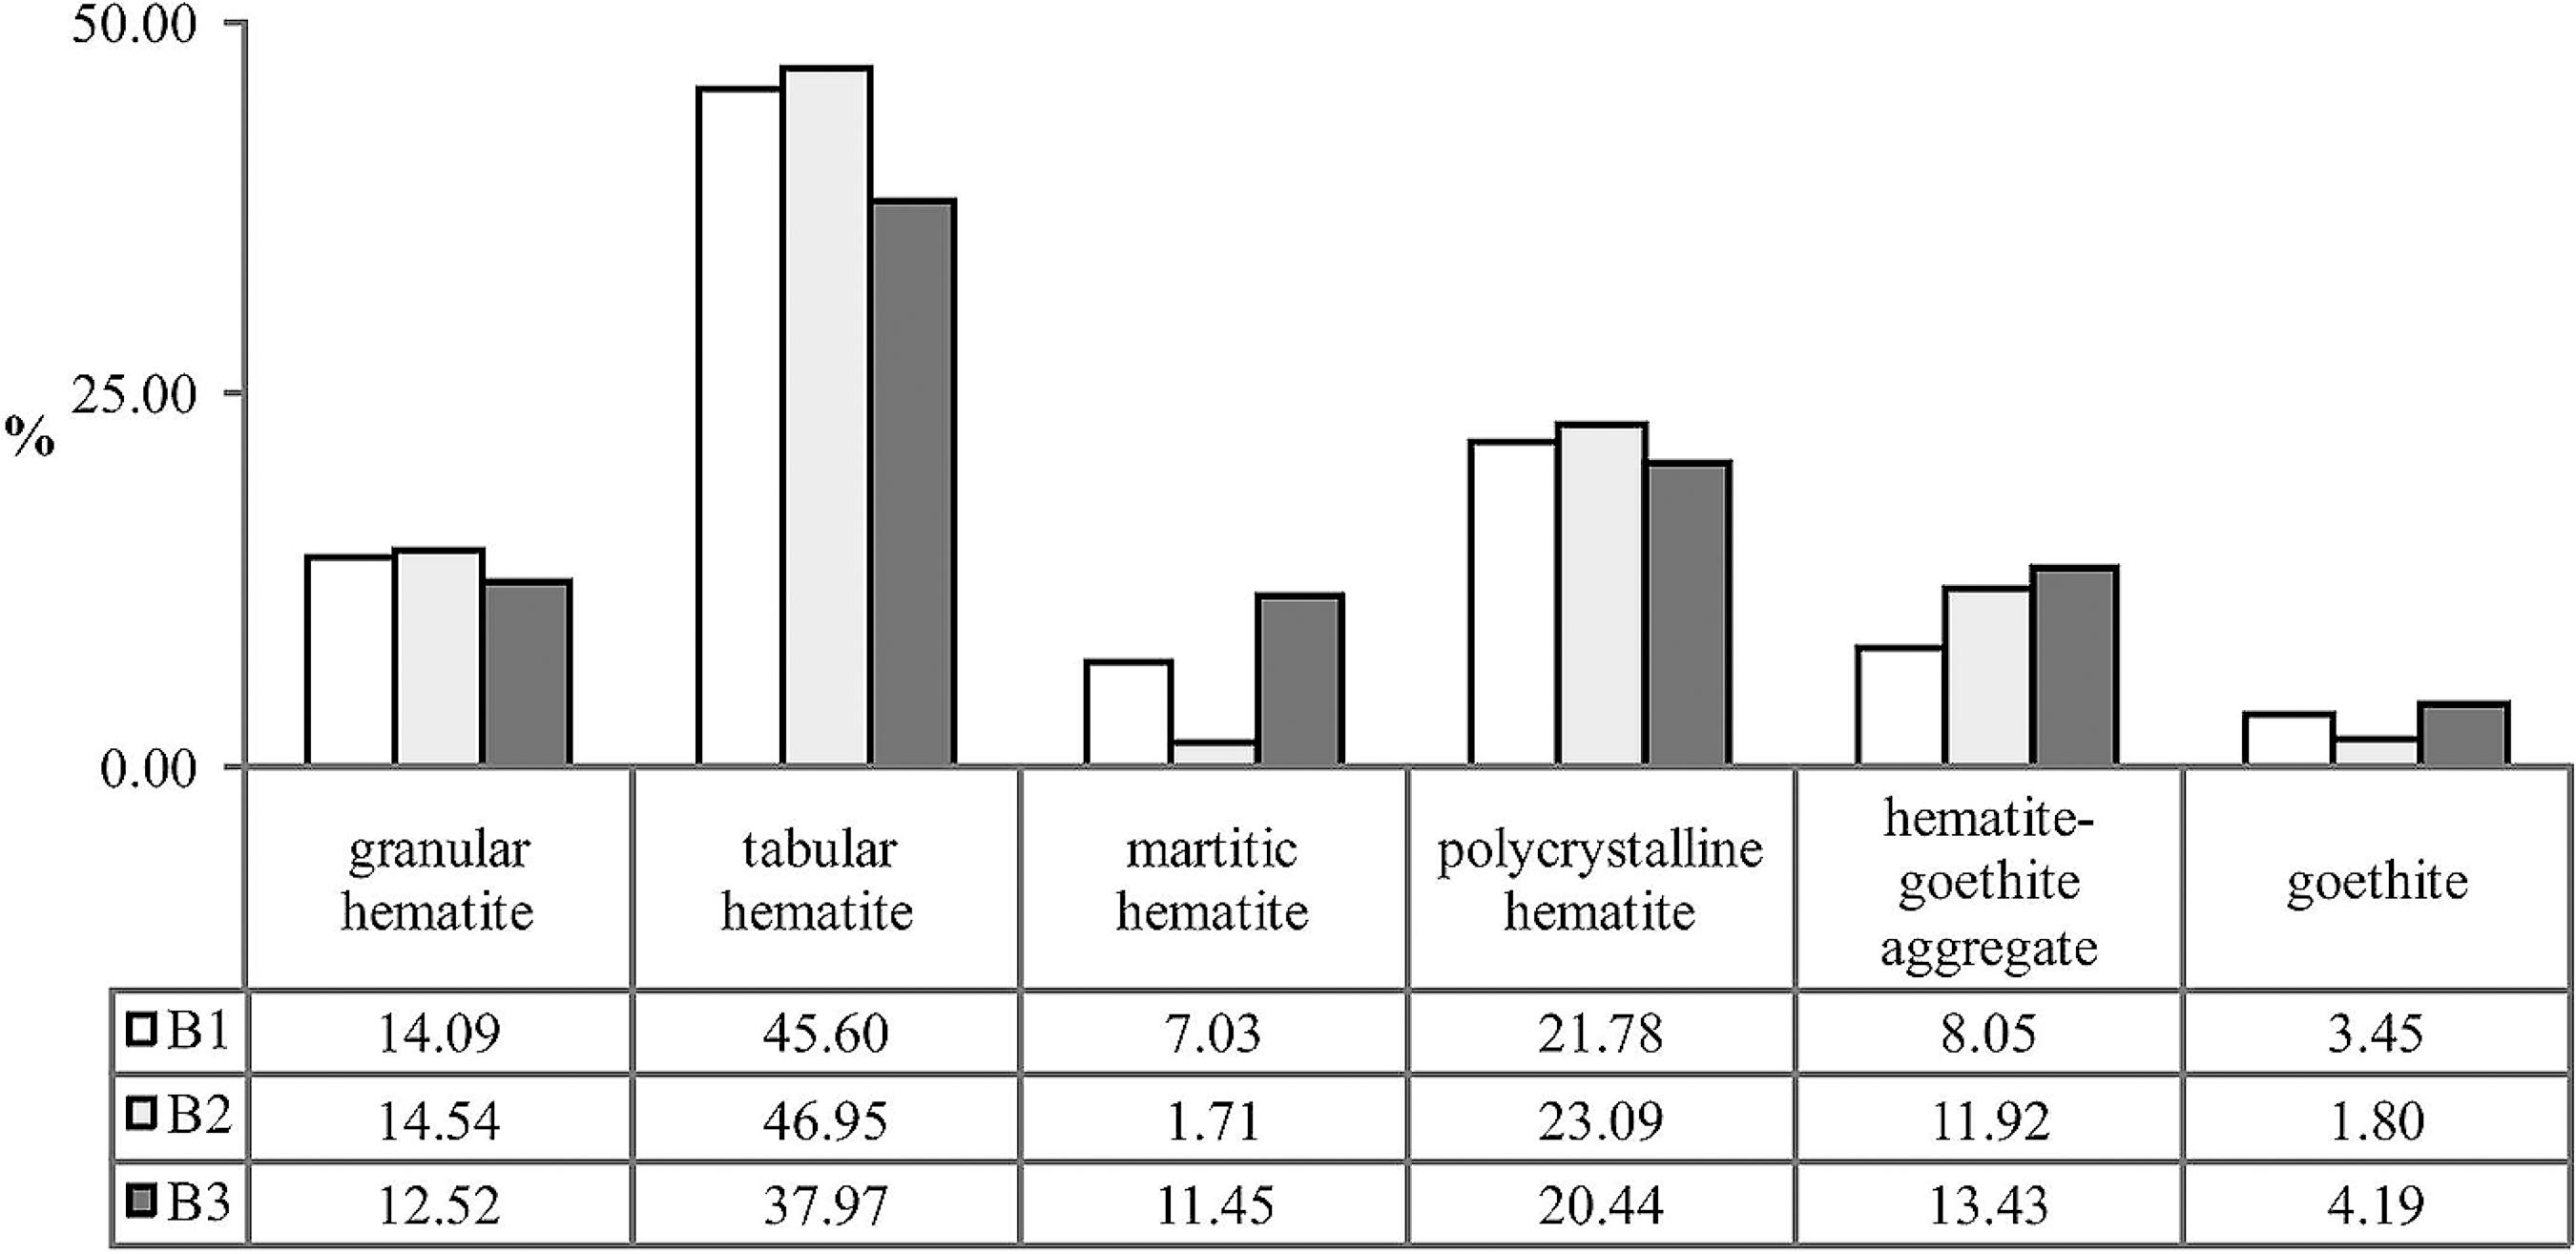
Figure 3 displays the mineralogical composition of the blends submitted to filtration tests. The characterisation results shows that granular and polycrystalline hematite have similar proportions in the blends. The tabular hematite in blend 3 is lower in proportion to that in blends 1 and 2. This is due to the lower proportion of the sample A in blend 3. Blend 1 is characterized by an intermediate amount of martitic hematite when compared to blends 2 and 3. The proportion of martitic hematite in each blend occurs due the presence of samples E and F. In regards to the goethite, it was observed that its proportion is very similar in all three blends, varying together with martitic hematite. Thus, the blends can be differentiated by their content of martitic hematite and also by the slightly increasing in the goethite content from blend 2 to blend 1 and to blend 3. Although, goethite content is lower in all blends, its content increases due to the hematite-goethite aggregate.
In the analysis by SEM (Figure 4) of the cake samples of blends 1 and 2, it is possible to observe the presence of granular and tabular hematite together with fine hematite grains. The martitic hematite is only verified in blend 3. On the other hand, polycrystalline hematite and the goethite-hematite aggregates are not identified in the retained filter cake after the grinding and filtering processes. Similar results are observed for the filter fabrics. A clear difference was found in the filtration of the three blends. The filter fabric impregnation by hematite grains decreases from blend 1 to blend 3.
For each sample, it was measured the filtration rate (t/hm2) and moisture content. The sampling results with parameters associated in the filtration test are shown in Table 5. Blends 1 and 2 exhibit the filter rate of 1.41 and 1.23 t/hm2. Blend 3 presents the highest average filter rate, reaching 1.80 t/hm2. Only blends 1 and 2 presented moisture contents close to the expected values obtained in industrial operations. The moisture content in blend 1 was 9.49% and blend 2 was 9.41%. However, for blend 3 the measured moisture content of 10.38% did not reach the industrial specification. For those tests, the main operating parameters, the pulp density, the specific surface area, and the weight percent below 0.045 mm, were kept under controlled conditions and remained stable. Thus, it was ensured that the differences between tests performance could be only attributed to the differences of the ore morphological types.
4. Discussion
Samples A, C, E, and F are originally flotation products and the results obtained for the specific surface area for those samples increases as the proportion of martitic hematite gets higher, such as observed in samples E and F. Samples, A, C, E, and F show similar particle size distributions. Thus, similar values for specific surface area for those samples would be expected. However, the specific surface area parameters showed differences. This may be explained by the higher porosity characteristic of martitic hematite, which the pores space contributing to the increase of the specific surface area. Hence, samples E and F contain larger proportions of martitic hematite compared to the others, so they show higher values for the specific surface area (see Table 2). The lowest value for the specific surface area in sample B is due to the predominance of polycrystalline hematite and a lower proportion of the hematite-goethite aggregates that contain fine grains of goethite. On the other hand, sample D showed a specific surface area greater than all of the samples due to the presence of the hematite-goethite aggregate.
The grinding process was applied in order to yield a product specification characterized by a specific surface area of 1,900 cm2/g and a high proportion of the ground product below 0.045 mm. This process is well understood when applied to ores composed mostly of polycrystalline mineral particles (Silva et al., 2003SILVA, C. E. A., JÚNIOR P. A. S., CARNEIRO, R. T. S., VIEIRA, C. B., ARAÚJO, F. G. S., KRÜGER, F. L. V., KRÜGER, P. V. O Projeto de Geossiderurgia na Pelotização da Companhia Vale do Rio Doce. In: SIMPÓSIO BRASILEIRO DE MINÉRIO DE FERRO, 4. 2003. Ouro Preto, Anais... Ouro Preto, 2003, v. 2, p. 624-633.). However, the polycrystalline proportions for the different blends investigated were similar. On the other hand, the blend results showed a positive relationship between the proportion of martitic hematite (see Figure 3) and the mass retained in the size fraction below 0.045mm (see Figure 1). This implies in the existence of a quasi-linear relationship between the filtration rate and the martitic hematite content, as shown in Figure 5a) and 5b). It is believed that a linear relationship can be obtained under more controlled filter operation. The martitic hematite is typical in blends 1 and 3 after the grinding. As observed in OM and SEM, the morphology consists of rough surfaces and grains with a large proportion of pore spaces.
(a) Relationship between the martitic hematite with filter rate and; (b) martitic hematite content and moisture.
The effect of these ore features on the filtering efficiency is evident. The proportion of martitic hematite on the three blends increases following the sequence: B2 (1.71%) < B1 (7.03%) < B3 (11.45%). It is important to mention that, although the moisture content increases in the sequence B2 → B1 → B3 (Figure3b), the filtration productivity, measured as the filter rate, follows the same behavior: B2 (1.23 t/hm2) < B1 (1.41 t/hm2) < B3 (1.80 t/hm2). Thus, the different results about moisture and productivity can be related to the martitic hematite content in the blend. The results suggest that the moisture and productivity increase with the increasing percentage of martitic hematite in the blend. The large proportion of martitic hematite in the blends causes an increase of the efficiency of the filtration process as observed in moisture content in blend 3, that does not attain the industrial requirements (between 8.5% and 9.5%).
Martitic hematite shows highly porous grains displaying a typical trellis structure which consists of an angular network of hematite lamellae resulting from the martitization of magnetite (Morris, 1980MORRIS, R. C. A textural and mineralogical study of the relationship of iron ore to banded iron-formation in the Hamersley Iron Province of Western Australia. Economic Geology, v. 75, p. 184-209, 1980.). Porosity may reduce the strength of the ore in grinding and increase the specific surface area. Furthermore, the existence of highly porous grains enhances the presence of interstitial water, which would imply high moisture in the filter cake. Moreover, the fine-grained hematite derived from the martitization would lead to an impregnation of the filter fabrics increasing the moisture.
5. Acknowledgements
This study was partially supported by the Fundação de Amparo a Pesquisa do Estado de Minas Gerais (FAPEMIG) and the Conselho Nacional de Desenvolvimento Científico e Tecnológico (CNPq) e CAPES/PROEX. All the analyses were performed in the Laboratory of Microscopy and Microanalysis (MICROLAB) at the Universidade Federal de Ouro Preto (UFOP).
6. References
- BARBOSA, P. F., LAGOEIRO, L. Crystallographic texture of the magnetite-hematite transformation: evidence for topotactic relationships in natural samples from Quadrilátero Ferrífero, Brazil. American Mineralogist, v. 95, p.118-125, 2009.
- BARBOSA, P. F., SCHOLZ, R., GRAÇA, L., ALVAREZ, G. Electron Backscattering Diffraction (EBSD) as a tool to evaluate the topotactic and epitactic growth of minerals: the example of the magnetite and hematite. Microscopy and Microanalysis, v. 17, p. 408-409, 2011.
- DWARAPUDI, S., DEVI, T. U., MOHAN RAO, S., RANJAN, M. Influence of pellet size on quality and microstructure of iron ore pellets. ISIJ International, v. 48, n. 6, p. 768-776, 2008.
- HASELHUHN, H. J., SWANSON, K. P., KAWATRA, S. K. The effect of CO2 sparging on the flocculation and filtration rate of concentrated hematite slurries. International Journal of Mineral Processing, v. 112, p. 107-109, 2012.
- KELLY, E. G., SPOTTISWOOD, D. J. Introduction to mineral processingNew York: John Wiley & Sons, 1982. 491p.
- MADAENI, S. S. The effect of large particles on microfiltration of small particles. Journal of Porous Materials, v. 8, p. 143-148, 2000.
- MEYER, K. Pelletizing of iron ores Berlin: Springer-Verlag, 1980. 302p.
- MORRIS, R. C. A textural and mineralogical study of the relationship of iron ore to banded iron-formation in the Hamersley Iron Province of Western Australia. Economic Geology, v. 75, p. 184-209, 1980.
- MOURÃO, J. M., STEGMILLER, L. Influência da estrutura dos minérios de ferro na sua moabilidade. In: ENCONTRO NACIONAL DE TRATAMENTO DE MINÉRIOS E HIDROMETALURGIA, 14.Salvador, Anais... Salvador, v. 1, p. 228-243, 1990.
- PRIOR, D. J., BOYLE, A. P., BRENKER, F., CHEADLE, M. C., DAY, A., LOPEZ, G., PERUZZO, L., POTTS, G. J., REDDY, S. M., SPIESS, R., TIMMS, N. E., TRIMBY, P. W., WHEELER, J., ZETTERSTRÖM, L. The application of Electron Backscatter Diffraction and Orientation Contrast Imaging in the SEM to textural problems in rocks. American Mineralogist, v. 84, p. 1741-1759, 1999.
- QIU G. , JIANG T., LI H., WANG, D. Functions and molecular structure of organic binders for iron ore pelletization. Colloid and Surface A,v. 224, p.11-22, 2003.
- ROWLAND, C. A., KJOS, D. M. Rod and ball mills. In: KAWATRA, S. K. Comminution Practices Colorado: Littleton, 1997. p. 319-338.
- SALEEM, M., KRAMMER, G. Optical in-situ measurement of filter cake height during bag filter plant operation. Powder Technology, v. 173, p. 93-106, 2007.
- SANTOS, L. D., BRANDÃO, P. R. G., SAMPAIO, D. A. Mineralogical and morphological characterization of iron ore types from Mina Gerais, Brazil - Influences on the specific surface area of concentrates. Minerals & Metallurgical Processing, v. 22, n. 2, p. 116-121, 2005.
- SILVA, C. E. A., JÚNIOR P. A. S., CARNEIRO, R. T. S., VIEIRA, C. B., ARAÚJO, F. G. S., KRÜGER, F. L. V., KRÜGER, P. V. O Projeto de Geossiderurgia na Pelotização da Companhia Vale do Rio Doce. In: SIMPÓSIO BRASILEIRO DE MINÉRIO DE FERRO, 4. 2003. Ouro Preto, Anais... Ouro Preto, 2003, v. 2, p. 624-633.
- VYAS, H. K., BENNETT, R. J., MARSHALL, A. D. Influence of feed properties on membrane fouling in crossflow microfiltration of particulate suspensions. International Dairy Journal, v. 10, p. 855-861, 2000.
Publication Dates
-
Publication in this collection
Apr-Jun 2016
History
-
Received
22 Aug 2014 -
Accepted
03 Feb 2016