ABSTRACT
In order to search for an ideal test for multiple comparison procedures, this study aimed to develop two tests, similar to the Tukey and SNK tests, based on the distribution of the externally studentized amplitude. The test names are Tukey Midrange (TM) and SNK Midrange (SNKM). The tests were evaluated based on the experimentwise error rate and power, using Monte Carlo simulation. The results showed that the TM test could be an alternative to the Tukey test, since it presented superior performances in some simulated scenarios. On the other hand, the SNKM test performed less than the SNK test.
Index terms:
Type I error rate; simulation; range; midrange; midrangeMCP package.
RESUMO
Em face de ainda haver a busca de um teste ideal aos procedimentos de comparações múltiplas, esse trabalho teve como objetivo desenvolver dois testes de comparações múltiplas, similares aos testes Tukey e SNK, porém, baseados na distribuição da amplitude estudentizada externamente. Os nomes dos testes são Tukey Midrange (TM) e SNK Midrange (SNKM). Os testes foram avaliados baseados na taxa de erro por experimento e no poder, usando simulação Monte Carlo. Os resultados mostraram que o teste TM pode ser uma alternativa ao teste Tukey, uma vez que apresentou desempenho superior em alguns cenários simulados. Ao passo que o teste SNKM apresentou desempenho inferior ao teste SNK.
Termos para indexação:
Erro tipo I; simulação; amplitude; midrange; pacote midrangeMCP.
INTRODUCTION
The development of the multiple comparison procedures (MCP) is generally based on type I and type II error rates control. In the literature, many multiple comparisons procedures were proposed. The Tukey test, one of the most used and known MCP, is based on the distribution of the externally studentized range, well documented in the literature. Although the Tukey test is widely used in applied areas, it is viewed as a very conservative one. In order to develop more powerful tests with the control of the type I error, Fisher proposed the protected Student’s t-test. Duncan’s test is a variant of the Tukey’s test, causing flexibilization in the control of type I and increasing the power; this also uses the externally studentized range distribution.
In a few cases, in any science, there will be no difference between the treatments. What occurs is the existence of two or more different groups of homogeneous treatment means, which are called partial null hypotheses cases. Under such conditions, Fisher’s protection does not control type I error at the nominal significance level for the Student’s t-test. As shown by Carmer and Swanson (1973CARMER, S. G.; SWANSON, M. R. An evaluation of ten pairwise multiple comparison procedures by Monte Carlo methods. Journal of the American Statistical Association, 68(341):66-74, 1973.), at the 5% nominal significance level of probability, this test presents a type I error of up to 45%, which is considered as a liberal test. Westfall, Tobias and Wolfinger (2011WESTFALL, P. H.; TOBIAS, R. D.; WOLFINGER, R. D. Multiple Comparisons and Multiple Tests Using SAS. 2nd. ed. North Carolina: SAS Publishing, 2011) suggested that the test be called a partially protected Fisher’s test.
Duncan’s test is an alternative to adjust the nominal significance level based on the number of comparisons involved. Although the test presents high power, it always has high type I error rates (Carmer; Swanson, 1973CARMER, S. G.; SWANSON, M. R. An evaluation of ten pairwise multiple comparison procedures by Monte Carlo methods. Journal of the American Statistical Association, 68(341):66-74, 1973.; Bernhardson, 1975BERNHARDSON, C. S. 375: Type I error rates when multiple comparison procedures follow a significant F test of anova. Biometrics, 31(1):229-232, 1975.), and is, therefore, a liberal test.
Observing the high type I error rates of Duncan’s test and the low power of Tukey’s test, another test, known as SNK test, has been proposed. Glaz and Yeater (2018GLAZ, B.; YEATER, K. Y. Applied Statistics in Agricultural, Biological, and Environmental Sciences. New Jersey: John Wiley & Sons. 2018. 661p.), consider this test as conservative. However, under the partial H 0 hypothesis, this test also presents a high probability of type I error.
With these arguments, the objective of obtaining an optimal multiple comparison procedure remains unattained, since there is no high-power test up to the present time that controls type I error under all conditions. Therefore, the possibility of developing two new procedures of multiple comparisons similar to the SNK and Tukey tests was considered in this work by using an alternative to the externally studentized range distribution. Instead, the externally studentized midrange distribution is proposed here. Similar to Tamhrane and Gou (2017TAMHANE, A. C.; GOU, J. Advances in p-values based multiple test procedures. Journal of Biopharmaceutical Statistics, 28(1):10-27, 2017.), we will restrict ourselves to the tests that control the familywise error rate that will be discussed later. In our paper, we prefer to call this the rate of experimentwise error.
Let Y (1), Y (2), ..., Y (n) be the order statistics of independent random variables Y 1, Y 2, ..., Y n with size n from a normal distribution with mean μ and variance σ 2. Thus, the externally studentized midrange is defined by Equation 1,
where is the sample midrange and S is an estimator of the population standard deviation with ν degrees of freedom and independent of .
Batista, Ferreira and Chaves (2017BATISTA, B. D. O.; FERREIRA, D. F.; CHAVES, L. M. Externally studentized normal midrange distribution. Ciência e Agrotecnologia, 4(41):1-12, 2017.) showed the distribution and density functions of from Equation 1. However, they also showed that the statistic is not an ancillary statistic, making it difficult to develop new tests based on this statistic. In this way, Batista and Ferreira (2014BATISTA, B. D. O.; FERREIRA, D. F. SMR: An R package for computing the externally studentized normal midrange distribution. The R Journal, 6(2):123-136, 2014.) showed that for Yi ~N(0, σ2), the probability density and distribution functions are given by Equations 2 and 3,
and
respectively, where f (x;ν) is given by Equation 4,
Considering Y i ~N(μ,σ 2), it can be shown that the expectation of is given by Equation 5,
where Γ is the complete gamma function and ν is the degree of freedom associated with S, in which for μ = 0, the expectation of is . This is fundamental to the development of the new tests proposed in this work.
Therefore, as an alternative to original tests, this work aims to develop two new multiple comparison procedures making use of the externally studentized midrange similar to the Tukey and SNK tests, called TM and SNKM tests, respectively. The performance of these tests is evaluated using Monte Carlo simulations, considering experimentwise error rates (EER) and power.
MATERIAL AND METHODS
Consider the following random sample Y 11, Y 12, ..., Y 1r , Y 21, ..., Y 2r , ..., Y i1 , Y i2 , ..., ij, ..., Y ir , ..., Y n1 , Y n2 , ..., Y nr , from a normal distribution N (μ i , σ2), where Y ij is the random observation of ith treatment in the jth replication, i = 1, 2, ..., n and j = 1, 2, ..., r. The sample average of the ith treatment is given by Equation 6,
This sample was submitted to an analysis of variance, adopting the following model by Equation 7
where ϵij ~ N (0, σ 2) and μ i = μ + τ i is the mean of the ith treatment. Thus, the mean square of the error MSE, the estimator of the population common variance σ 2, is given by Equation 8,
It is well known that and MSE are independently distributed in the normal case, and that (Christensen, 2016CHRISTENSEN, R. Analysis of variance, design, and regression: Linear modeling for unbalanced data. 2nd. New York: Chapman and Hall/CRC. 2016. 636p.).
Under the null hypothesis, H 0: μ 1 = μ 2 = ... = μ n = μ, the n treatments have a common average μ. In this particular case, the order statistics Y (1)., Y (2)., ..., Y (n). are centered around μ. Thus, the externally studentized midrange, defined by Equation 9
has a distribution function dependent on μ (under H 0). We chose to use the externally studentized midrange distribution in the specific case where μ = 0, expression (3). Therefore, to use the distribution centered in 0, a correction in the statistic of the new test was proposed. As has a distribution centered in μ, the corrected statistic was , where is an unbiased estimator of μ.
The mean of the group with the highest number of means in the two candidate groups was used to develop an estimator with the lowest standard error. This estimator was determined based on empirical criteria and Monte Carlo simulation validation. Thus, considering the partitions and , whose point k has been set for j where the Equation 10
occurs for j = 1, 2, ..., n - 1. If there are ties with two or more values of k, say k 1, k 2, ..., then, the partition is formed where k = max{min (k 1, n - k 1), min(k 2, n - k 2),...}. In this way, taking as Equations 11 and 12,
and
respectively, the value of will correspond to if k ≥ n - k or equal to . Thus, the statistic can be expressed by Equation 13,
and the Minimum Significant Difference (MSD) for the rejection or not of the hypothesis, was given by Equation 14,
where is the 100α/2% quantile of the , Equation 9.
Tukey’s test based on the midrange TM test
Considering the information presented above, the steps for the application of the new test denoted by TM test are:
1. The treatment means are ordered as: ;
2. The MSD is obtained by Equation 15:
3. The value of the statistic is calculated by determining k and as described above, by Equation 16:
4. If , then the n averages will not be considered as different. Otherwise, go to step 5, considering m = n averages;
5. Update m by m = m - 1
6. Considering the groups of averages: ; ;...; the group of groups is given by l = n - m + 1
7. For each of the groups with m averages, the statistic is computed by Equation 17
where is obtained in the same way, as described for the set of all the n averages, considering m < n, in this case.
8. For each group obtained and marked as divisible, consider m as the number of averages of the related group, and it should be used as MSD given by Equation 18,
9. If , then the m averages do not differ statistically; otherwise, they are different at this stage;
10. The process is repeated for all l groups of m averages, redoing the steps 7, 8, and 9. After a comparison of all l groups of m averages, we return to step 5, updating the value of m. This must be repeated while m ≥ 2.
SNK test based on midrange (SNKM)
The algorithm for the SNKM test is the same used for the TM test. The difference is shown in step 11, which follows:
11. The value of the MSD is given by Equation 19,
Thus, Δm changes as the number of averages m modifies for each of the l = n - m + 1 groups, since the argument n changes, which is one of the parameters of the distribution of .
Performance on the proposed tests
Two strategies have been considered here. The first was to evaluate the experimentwise type I error rates (EER) of the proposed multiple comparisons tests. The second was to evaluate the power. In both cases, Monte Carlo simulation was used.
In each simulation the multiple comparisons tests were applied at a pre-established significance level of α, checking whether the null hypothesis was rejected. This process was repeated N * = 5,000 times. To evaluate the empirical EER using Monte Carlo simulation, the exact binomial test with a confidence coefficient of 99% probability was used to test the hypotheses H 0: α = 5% versus H1: α ≠ 5% and H 0: α = 1% versus H 1: α ≠ 1%. If the null hypothesis is rejected and the empirical EER is considered to be significantly (p-value 0.01) below the nominal level, the test is considered conservative. If the empirical EER is considered significantly (p-value < 0.01) higher than the nominal level, the test will be considered liberal. If the observed value of the empirical EER is non-significant (p-value > 0.01), the test will be considered as an exact test (Oliveira; Ferreira, 2010OLIVEIRA, I. R. C.; FERREIRA, D. F. Multivariate extension of chi-squared univariate normality test. Journal of Statistical Computation and Simulation, 80(5):513-526, 2010.).
Considering y as the number of null hypotheses rejected in 5,000 Monte Carlo simulations for a nominal significance level α, and also considering the relationship between the F and binomial distributions, with the probability of success p = α, the statistic of test is given by Equation 20,
that under H 0, it has an F distribution with ν 1 = 2(N * - y) and ν 2 = 2(y + 1) degrees of freedom. If F < F 0.005 or F ≥ F 0.995, the null hypothesis must be rejected at the nominal significance level of 1%, where F 0.005 and F 0.995 are the quantiles of the F distribution with ν 1 and ν 2 degrees of freedom (Oliveira; Ferreira, 2010OLIVEIRA, I. R. C.; FERREIRA, D. F. Multivariate extension of chi-squared univariate normality test. Journal of Statistical Computation and Simulation, 80(5):513-526, 2010.).
The power was evaluated in the second step. The treatment effects were simulated with two options, to generate a complete hypothesis (H 1, complete alternative hypotheses) and a partial null hypothesis (H 0). Thus, for the first option, the treatment effect 1, on the Equation 7, was considered equal to 0, that is, τ1 = 0, and the other effects were settled by Equation 21
for δ = 1, 2, 4, 8, 16, and 32 representing the number of standard errors of the difference between means to specify the consecutive treatments effect, considering i = 2, 3, ..., n.
The second option for the power involves a simulation under partial H 0 with two groups of treatment means, with k 1 = [n/2] and k 2 = n - k1 means in each, where [x] refers to the largest integer less than or equal to x. The means of the first group were equal, for which the effects were τ i = 0, i = 1, 2, 3, ..., k 1, without loss of generality. The second group, with k 2 treatment means, has its effects settled by Equation 22
for different values of δ, as δ = 1, 2, 4, 8, and 16. In this case, the proportion of rejections involving comparisons of the different groups in the total of N * k 1 k 2 comparisons between the means of the two groups in the N * simulated experiments is an estimator of the power. The intragroup comparisons also allowed, evaluation of the EER under partial H 0.
Some configurations in both steps (EER and Power) with different values of n and r were considered. The n and r values were n = 5, 10, 20, 40, and 100, and r = 4, 10, and 20. The nominal significance level of 5% was also considered. The coefficient of variation (CV) of the experiment was CV = 10%.
RESULTS AND DISCUSSION
The performance evaluation of the proposed tests will be presented, and comparisons between their results and the results from those tests that already exist in the literature (Tukey and SNK tests) will be made. The performance evaluation will be based on the experimentwise Type I error rates (EER) and the power of the test. Several arrangements were chosen for the performance evaluation, as already mentioned above. To facilitate exposure and interpretation, the results will be discussed and presented through tables and graphs.
Experimentwise Type I error rates
Two scenarios were considered for computing experimentwise type I error rates: under complete H 0 and under partial H 0 hypotheses. In Table 1 the results of experimentwise type I error rates are shown under complete null hypothesis (H 0). The proposed TM and SNKM tests were compared with the Tukey and SNK tests to evaluate the performance. For the last two tests, we also use results from other performance evaluations found in the literature. Other MCPs found in the literature have also been commented upon in this discussion.
Experimentwise Type I error rates, in percent, of Tukey, SNK, TM, and SNKM tests, as a function of the number of treatments and number of replicates, under the complete null hypothesis H 0, at the nominal significance level α = 5%, evaluated by the exact binomial test with a confidence coefficient of 99% probability.
The proposed tests controlled the experimentwise type I error rates conservatively or exactly, since none of them had the empirical EER rejected by the exact binomial test, such as that of F ≥ F 0.995. However, in some cases, the empirical EER for the TM and SNKM tests were significantly less (p-value <0.01) than the nominal significance level by the exact binomial test, such that F < F0.005, making them conservative tests. Confirming the results of the present work, Carmer and Swanson (1973CARMER, S. G.; SWANSON, M. R. An evaluation of ten pairwise multiple comparison procedures by Monte Carlo methods. Journal of the American Statistical Association, 68(341):66-74, 1973.), and Borges and Ferreira (2003BORGES, L. C.; FERREIRA, D. F. Poder e taxas de erro tipo I dos tetes Scott-Knott, Tukey e Student-Newman-Keuls sob distribuições normal e não normais dos resíduos. Revista Matemática e Estatística, 21(1):67-83, 2003.) showed that the Tukey and SNK tests present control of the experimentwise type I error rates. Regardless of the number of replicates, the proposed tests controlled the experimentwise type I error rates. Borges and Ferreira (2003BORGES, L. C.; FERREIRA, D. F. Poder e taxas de erro tipo I dos tetes Scott-Knott, Tukey e Student-Newman-Keuls sob distribuições normal e não normais dos resíduos. Revista Matemática e Estatística, 21(1):67-83, 2003.) also verified this when they evaluated the performance of Tukey and SNK tests.
With the increase in the number of treatments, the experimentwise type I error rates of the tests decreased. Carmer and Swanson (1973CARMER, S. G.; SWANSON, M. R. An evaluation of ten pairwise multiple comparison procedures by Monte Carlo methods. Journal of the American Statistical Association, 68(341):66-74, 1973.), and Boardman and Moffitt (1971BOARDMAN, T. J.; MOFFITT, D. R. Graphical Monte Carlo type I error rates for multiple comparison procedures. Biometrics , 27(3):738-744, 1971.) found this same behavior for the Scheffé’s test, after considering 4,000 experiments. For n = 20 treatments, the EER of this test reached almost 0% of experimentwise type I error rates, showing it to be a very conservative test.
Considering a normal population, for the Tukey and SNK tests, regardless of the number of treatments, Borges and Ferreira (2003BORGES, L. C.; FERREIRA, D. F. Poder e taxas de erro tipo I dos tetes Scott-Knott, Tukey e Student-Newman-Keuls sob distribuições normal e não normais dos resíduos. Revista Matemática e Estatística, 21(1):67-83, 2003.) have shown that the experimentwise type I error rates remain the same as the overall significance level. In contrast to these PCMs, Bernhardson (1975BERNHARDSON, C. S. 375: Type I error rates when multiple comparison procedures follow a significant F test of anova. Biometrics, 31(1):229-232, 1975.) showed that the LSD (test based on the t of Student) and Duncan tests, considering 10 treatments, presented high experimentwise type I error rates of 49.0% and 36.3%, respectively. Carmer and Swanson (1973CARMER, S. G.; SWANSON, M. R. An evaluation of ten pairwise multiple comparison procedures by Monte Carlo methods. Journal of the American Statistical Association, 68(341):66-74, 1973.), also studying the t-Bayesian test, observed that the values of experimentwise type I error rates were 15.6%, 18.4% and 18.7%, respectively, for treatment numbers equal to 5, 10, and 20, and the nominal significance level of α = 5%, confirming that it was a liberal test.
It is interesting to say that the proposed TM and SNKM tests have identical EERs to that of the Tukey and SNK tests, regardless of the number of replications and treatments, under the complete null hypothesis H 0. This is because of the similarity in the theoretical development of the tests. For example, the Tukey and SNK tests for the first difference between the extreme mean (lowest mean and highest mean) have the same MSD, as observed by Carmer and Swanson (1973CARMER, S. G.; SWANSON, M. R. An evaluation of ten pairwise multiple comparison procedures by Monte Carlo methods. Journal of the American Statistical Association, 68(341):66-74, 1973.), and Borges and Ferreira (2003BORGES, L. C.; FERREIRA, D. F. Poder e taxas de erro tipo I dos tetes Scott-Knott, Tukey e Student-Newman-Keuls sob distribuições normal e não normais dos resíduos. Revista Matemática e Estatística, 21(1):67-83, 2003.). However, in real experiments, there are usually different groups of treatment means. Therefore, the scenario in which the simulation was based on the partial null hypothesis was also considered, the results of which can be seen in Figure 1.

Experimentwise Type I error rates, in percent, of Tukey, SNK, TM, and SNKM tests, as a function of the difference of consecutive means (δ), under partial hypothesis H 0, (a) n = 5, (b) n = 20, and (c) n = 100, for α = 5% and r = 10.
Different from the works of Borges and Ferreira (2003BORGES, L. C.; FERREIRA, D. F. Poder e taxas de erro tipo I dos tetes Scott-Knott, Tukey e Student-Newman-Keuls sob distribuições normal e não normais dos resíduos. Revista Matemática e Estatística, 21(1):67-83, 2003.), to get more information about the experimentwise type I error rates under partial H 0, the size of the differences between consecutive treatment means was greater than those in this paper, that is, standard errors. In Figure 1, the performance evaluation of the tests concerning the difference of consecutive means (δ) is presented, setting the number of treatments (n = 5, 20, and 100) and the number of replicates (r = 10). The EER of the proposed tests exceeds the nominal significance levels in general, especially when the difference of consecutive means is greater than .
For the simulation performed in the present study, not all results were presented under partial H 0 , because the Tukey’s test is the only test that has EER equal to the overall significance level, regardless of the configuration of the experiment-as verified in the work of Borges and Ferreira (2003BORGES, L. C.; FERREIRA, D. F. Poder e taxas de erro tipo I dos tetes Scott-Knott, Tukey e Student-Newman-Keuls sob distribuições normal e não normais dos resíduos. Revista Matemática e Estatística, 21(1):67-83, 2003.). These authors confirmed the same behavior for the SNK test. However, when the difference between groups of consecutive means was greater than , the EER of SNK test exceeded the nominal level that characterized it as a liberal test. There was control of the overall significance level for the SNKM test only when the number of treatments was large (n = 100) when δ ≤ 2, as in Figure 1. The TM test presented the control of the overall significance level in this scenario only when δ ≤ 2.
In addition to the Tukey’s test, another test that presents EER according to the overall significance level is the Scheffé’s test, with EER values lower than those presented by the Tukey’s test (Carmer; Swanson, 1973CARMER, S. G.; SWANSON, M. R. An evaluation of ten pairwise multiple comparison procedures by Monte Carlo methods. Journal of the American Statistical Association, 68(341):66-74, 1973.). In the same work, it was also observed that the Duncan and t-Bayesian tests presented the highest experimentwise type I error rates under partial H 0, the latter with the highest magnitude, reaching the order of 32.6% and 58.5%, respectively, of rejection with n = 10 and r ≥ 3.
Power of the tests
Not all results on the correct test decisions, under complete H 1, were presented. However, the main results will be presented according to the simulation performed in this study and based on performance evaluations of the Tukey and SNK tests, which were also evaluated. The number of treatments influenced the power of the tests. In Figure 2, the performance evaluation of the Tukey, TM, SNK, SNKM, and modified SNK tests for the difference between means of , r = 4 replications and a nominal significance level of α = 5% are shown. Perecin and Malheiros (1989PERECIN, D.; MALHEIROS, E. B. Uma avaliação de seis procedimentos para comparações múltiplas. In: ESCOLA SUPERIOR DE LAVRAS. 3º Simpósio de Estatística aplicada à Experimentação Agronômica. Lavras, MG, 1989. 66p.) evaluated the modified SNK test in the same performance evaluation scenario of the present study.

Power of SNK, modified SNK, SNKM, TM, and Tukey tests, in percent, under complete H 1, to detect a difference between averages of , with r = 4 replications, as a function of the number of treatments and nominal significance level α = 5%.
Due to the way in which the tests were evaluated, the performance evaluation of other tests found in the literature is not comparable with the results found in the present study. Carmer and Swanson (1973CARMER, S. G.; SWANSON, M. R. An evaluation of ten pairwise multiple comparison procedures by Monte Carlo methods. Journal of the American Statistical Association, 68(341):66-74, 1973.) found that the EER of Tukey and Scheffé tests did not exceed 3.1% in all configurations, considering a nominal significance level of α = 5%.
The SNK, modified SNK, and TM tests increased in power with an increasing number of treatments (n), with the highest power gain of all for the TM test. The TM test showed enormous power difference, mainly concerning the Tukey test, which performed the worst. Under the complete null hypothesis H 0, the TM test shows the exact size, and may be an alternative to the Tukey test. The initial power value for the TM test is 37.87%, reaching a maximum value of 53.03% when n = 20. The SNK and modified SNK tests showed less power than the TM test. For n ranging from 5 to 100, the power of the modified SNK and SNK tests was between 22.50% and 25.9%, respectively.
However, the Tukey and SNKM tests decrease in power with the increase in the number of treatments. The Tukey test has practically a power of 0% when the number of treatments is 100, as observed by Perecin and Malheiros (1989PERECIN, D.; MALHEIROS, E. B. Uma avaliação de seis procedimentos para comparações múltiplas. In: ESCOLA SUPERIOR DE LAVRAS. 3º Simpósio de Estatística aplicada à Experimentação Agronômica. Lavras, MG, 1989. 66p.). This proves that the Tukey test cannot be recommended for pairwise comparisons when there is a large number of treatment means. The SNKM test also decreases in power with an increasing number of treatments. However, the power of this test is far superior to that of the Tukey test.
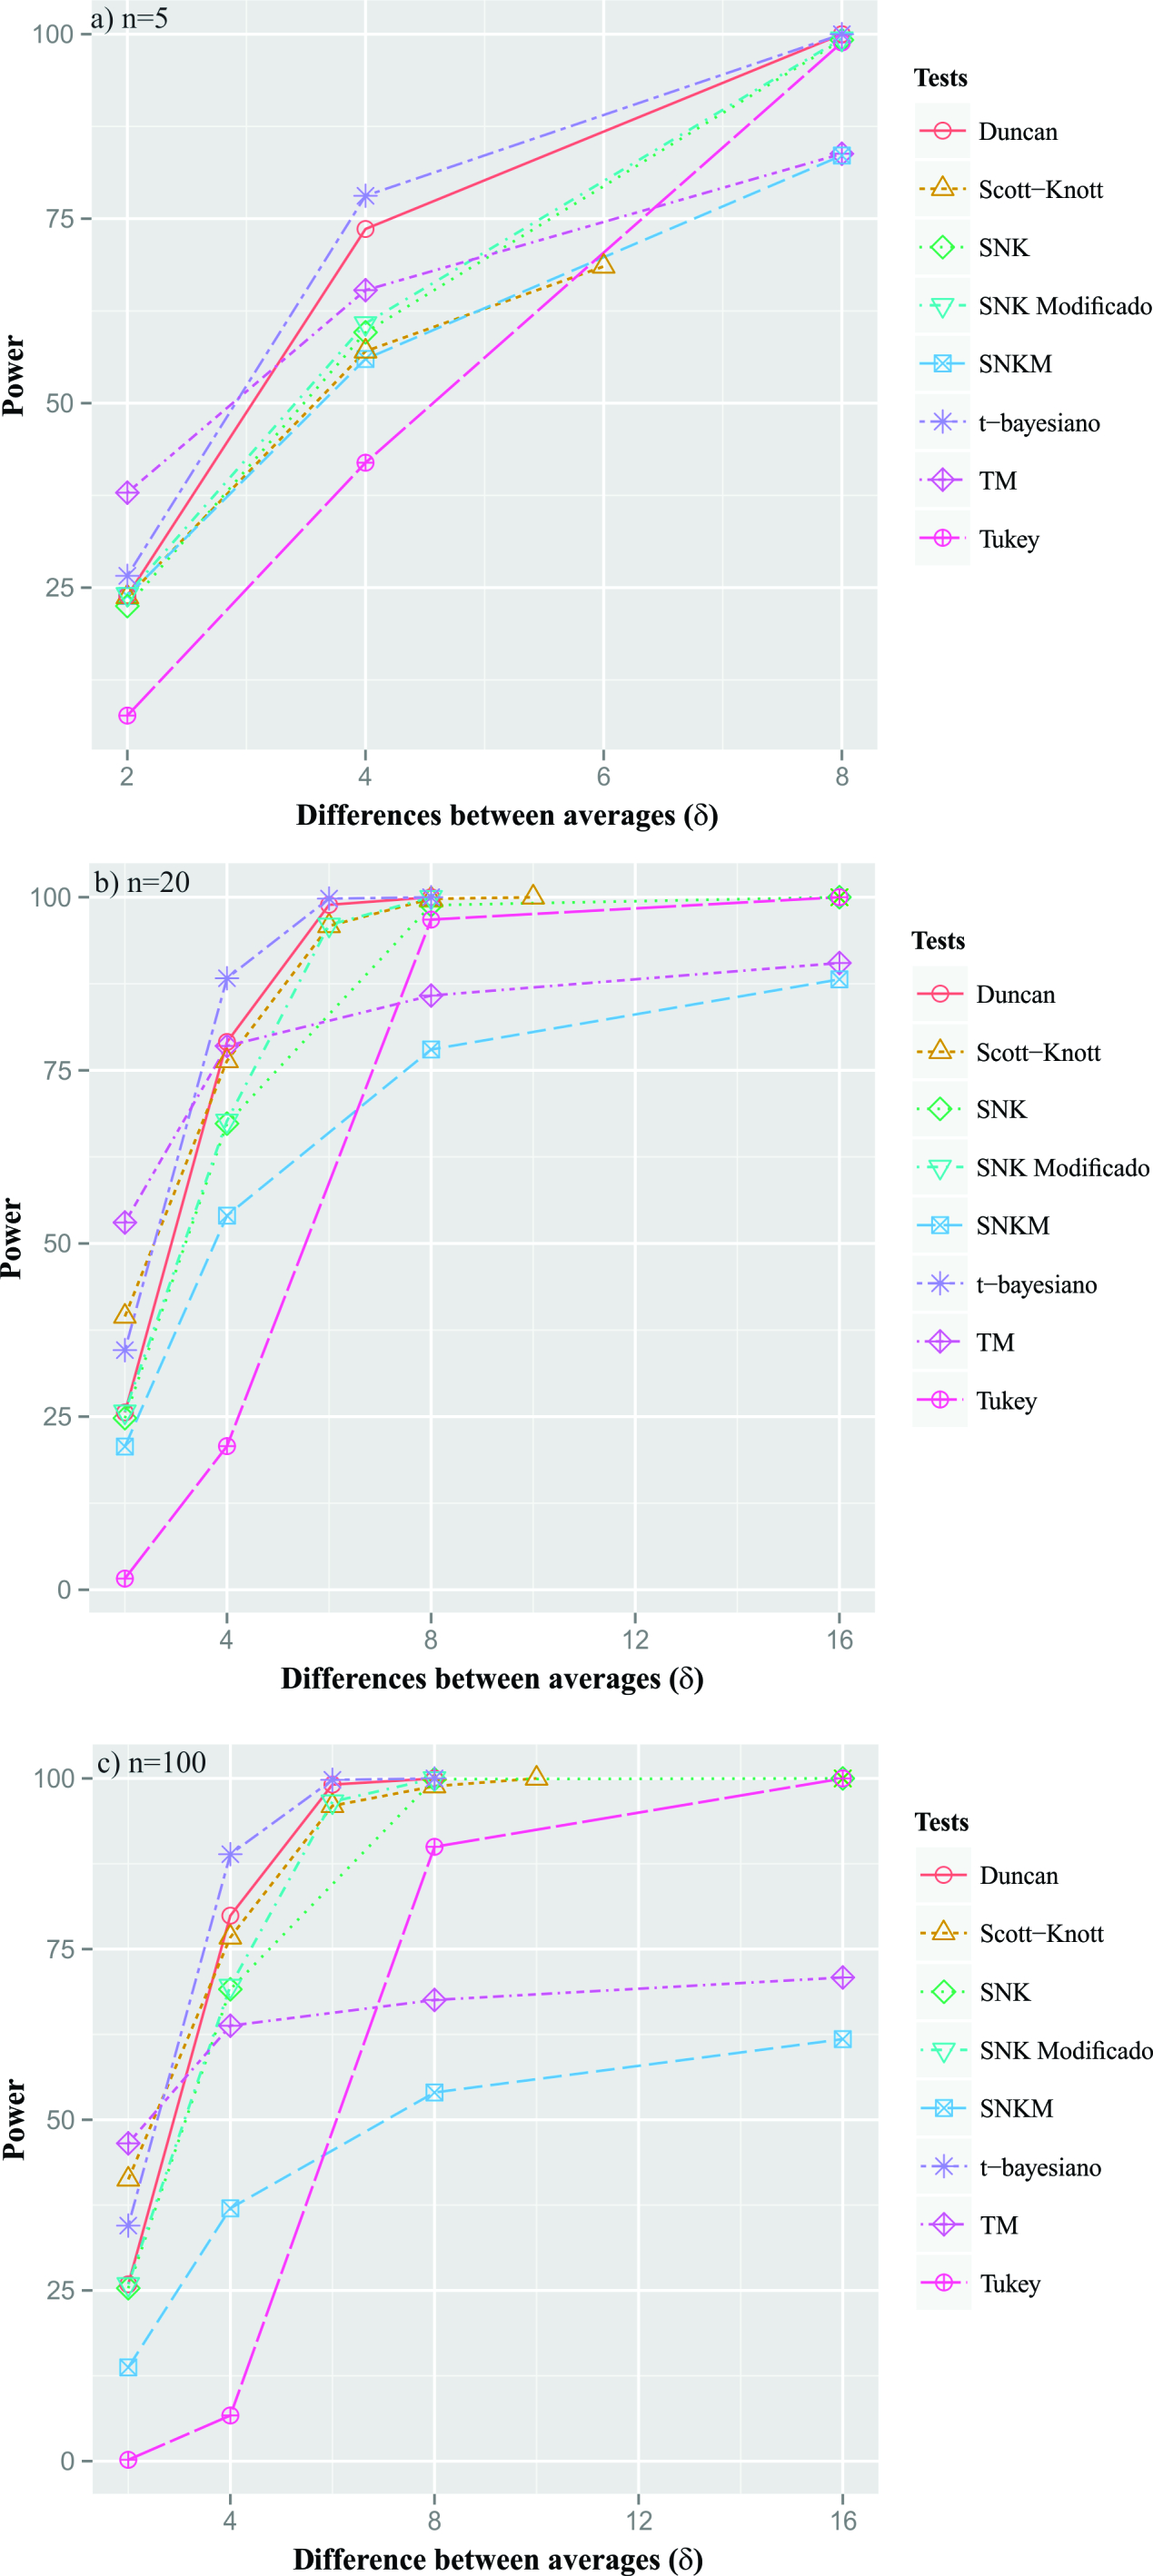
Another power performance assessment was based on the difference between means. Comparing the power of the proposed tests with the power of the other tests in the literature, the actual difference between means was considered from 2 to , for the number of treatments 5, 20, and 100, with 4 replicates and α = 0,05 (Figure 3). This scenario was considered since the performance evaluation of several tests done by Perecin and Malheiros (1989PERECIN, D.; MALHEIROS, E. B. Uma avaliação de seis procedimentos para comparações múltiplas. In: ESCOLA SUPERIOR DE LAVRAS. 3º Simpósio de Estatística aplicada à Experimentação Agronômica. Lavras, MG, 1989. 66p.), and Borges and Ferreira (2003BORGES, L. C.; FERREIRA, D. F. Poder e taxas de erro tipo I dos tetes Scott-Knott, Tukey e Student-Newman-Keuls sob distribuições normal e não normais dos resíduos. Revista Matemática e Estatística, 21(1):67-83, 2003.) were based on this configuration. For a small real difference between means, independent of the size of n, the TM test showed higher outcomes than the others did. However, when the δ increases, the t-Bayesian test has the greatest power, with a power convergence faster than 100%, compared to the other tests.

Power of Duncan, Scott-Knott, SNK, modified SNK, SNKM, TM, and Tukey tests, in percent, under complete H 1, to detect a difference between averages of 2 to , considering the number of treatments (a) n = 5, (b) n = 20, n = 100, r = 4 replications and nominal significance level α = 5%.
The highest power performance of the t-Bayesian and Duncan tests was already expected, since these two tests present higher experimentwise type I error rates (Bernhardson, 1975BERNHARDSON, C. S. 375: Type I error rates when multiple comparison procedures follow a significant F test of anova. Biometrics, 31(1):229-232, 1975.; Perecin; Malheiros, 1989PERECIN, D.; MALHEIROS, E. B. Uma avaliação de seis procedimentos para comparações múltiplas. In: ESCOLA SUPERIOR DE LAVRAS. 3º Simpósio de Estatística aplicada à Experimentação Agronômica. Lavras, MG, 1989. 66p.), and are considered as liberal tests. Therefore, it implies a small type II error rate and consequently high power. As the difference between means increased, these two tests converged more rapidly to 100%.
The Scott-Knott, SNK, and modified SNK tests also showed intermediate power and, in almost all configurations, these last two tests had practically the same performance, except for the differences in averages between 4 and . Comparing the two proposed tests, the TM test had greater power than the SNKM test. Comparing this test with the original test, it was found that the power of the TM test was also higher than that of the Tukey test, except when δ >.
A very relevant aspect in the proposed tests (TM and SNKM) was that although it could have shown a slower convergence of 100% to the percentage of correct maximum decisions, for small values of δ, these tests surpassed the original tests in most of the simulated scenarios. In real experiments, this is the most common case.
Figure 4 shows the scenarios for the actual difference between means of , with n = 5, 4 replicates α = 5%. The initial values of the real differences between consecutive means show a strong influence in the power of the tests, and these values were different. Therefore, for these three scenarios, Figure 4a to 4c, considering the same difference between averages of , the TM test power values for all three scenarios were 32.96%, 63.31%, and 89.57%, respectively. As the population averages became more heterogeneous the power of the proposed tests and the SNK test increased. For the Tukey test, power is constant for the same difference between increasingly heterogeneous population averages, because this test is very conservative. An excessive control in the type I error has a strong influence on the power, as can be seen in the literature.

Power of SNK, SNKM, TM, and Tukey tests, in percent, under complete H 1, concerning the initial values of differences between averages for and n = 5 treatments, and nominal significance level α = 5%.
All the proposed tests, under partial null hypothesis H 0 showed the power to be superior to the original tests. However, the power of the proposed tests, as well as the SNK test, had little practical meaning, since the experimentwise type I error rate of all these tests was higher than the nominal significance level. The same result was verified by Conrado et al. (2017CONRADO, T. V. et al. Adjusting the Scott-Knott cluster analysis for unbalanced designs. Crop Breeding and Applied Biotechnology, 17(1):1-9, 2017.), when trying to adjust the Scott-Knott test for balanced and unbalanced data. Only the Tukey and Scheffé tests had EER identical to the nominal level, as shown by Carmer and Swanson (1973CARMER, S. G.; SWANSON, M. R. An evaluation of ten pairwise multiple comparison procedures by Monte Carlo methods. Journal of the American Statistical Association, 68(341):66-74, 1973.). However, their power in certain cases was 0%.
A characteristic that can be improved in the proposed tests, to control the experimentwise type I error rates and to show high power under partial H 0, is to try and improve the contribution that the unknown population mean influences in the LSD, since the distribution of the midrange centered in μ depends on the location parameter.
CONCLUSIONS
The results show that the TM test can be an alternative to the Tukey test. Although the performance of the TM test has been liberal, under partial H
0, we realize that the Tukey’s test shows a power close to zero, as the number of treatments increased. Another test among those studied that showed the control of the error rate experimentwise was the Scheffé test. However, this test has the same characteristics as that of the Tukey test. In other scenarios, in comparisons made between the Tukey and TM tests, the latter shows superior performance. The initial gaps between groups of averages of the simulated scenarios changed the power of the tests, except for the Tukey test, which did not have major changes. This shows that with greater initial gaps in the simulated scenarios, the power of the TM test was superior to the compared tests, including the Tukey test. In contrast to the TM test, the SNKM test did not show the same performance when compared to its respective original test (SNK test). The SNKM test, in addition to being liberal under partial H
0, was inferior to the SNK test in power. Another result of this work that has not been emphasized throughout the text is the application of these tests. We developed an R package for this purpose, called the midrangeMCP package (Batista; Ferreira, 2020BATISTA, B. D. O.; FERREIRA, D. F. midrangeMCP: Multiple comparisons procedures based on studentized midrange and range distributions. R package version 3.1. Vienna, Austria, 29/06/2020. Available in: <Available in: http://CRAN.R-project.org/package=midrangeMCP
>. Access in: March 31, 2020.
http://CRAN.R-project.org/package=midran...
; R Core Team, 2020R CORE TEAM. R: A Language and Environment for Statistical Computing. Vienna, Austria, 2020. Available in: <Available in: https://www.R-project.org/
. Access in: March 31, 2020.
https://www.R-project.org/...
). An advantage of this package is the use of the graphical user interface (GUI), which makes its use more flexible for users unfamiliar with the R language.
ACKNOWLEDGMENTS
We would like to thank CNPq and CAPES for their financial support.
REFERENCES
- BATISTA, B. D. O.; FERREIRA, D. F. midrangeMCP: Multiple comparisons procedures based on studentized midrange and range distributions. R package version 3.1. Vienna, Austria, 29/06/2020. Available in: <Available in: http://CRAN.R-project.org/package=midrangeMCP >. Access in: March 31, 2020.
» http://CRAN.R-project.org/package=midrangeMCP - BATISTA, B. D. O.; FERREIRA, D. F. SMR: An R package for computing the externally studentized normal midrange distribution. The R Journal, 6(2):123-136, 2014.
- BATISTA, B. D. O.; FERREIRA, D. F.; CHAVES, L. M. Externally studentized normal midrange distribution. Ciência e Agrotecnologia, 4(41):1-12, 2017.
- BERNHARDSON, C. S. 375: Type I error rates when multiple comparison procedures follow a significant F test of anova. Biometrics, 31(1):229-232, 1975.
- BOARDMAN, T. J.; MOFFITT, D. R. Graphical Monte Carlo type I error rates for multiple comparison procedures. Biometrics , 27(3):738-744, 1971.
- BORGES, L. C.; FERREIRA, D. F. Poder e taxas de erro tipo I dos tetes Scott-Knott, Tukey e Student-Newman-Keuls sob distribuições normal e não normais dos resíduos. Revista Matemática e Estatística, 21(1):67-83, 2003.
- CARMER, S. G.; SWANSON, M. R. An evaluation of ten pairwise multiple comparison procedures by Monte Carlo methods. Journal of the American Statistical Association, 68(341):66-74, 1973.
- CHRISTENSEN, R. Analysis of variance, design, and regression: Linear modeling for unbalanced data. 2nd. New York: Chapman and Hall/CRC. 2016. 636p.
- CONRADO, T. V. et al. Adjusting the Scott-Knott cluster analysis for unbalanced designs. Crop Breeding and Applied Biotechnology, 17(1):1-9, 2017.
- GLAZ, B.; YEATER, K. Y. Applied Statistics in Agricultural, Biological, and Environmental Sciences. New Jersey: John Wiley & Sons. 2018. 661p.
- OLIVEIRA, I. R. C.; FERREIRA, D. F. Multivariate extension of chi-squared univariate normality test. Journal of Statistical Computation and Simulation, 80(5):513-526, 2010.
- PERECIN, D.; MALHEIROS, E. B. Uma avaliação de seis procedimentos para comparações múltiplas. In: ESCOLA SUPERIOR DE LAVRAS. 3º Simpósio de Estatística aplicada à Experimentação Agronômica. Lavras, MG, 1989. 66p.
- R CORE TEAM. R: A Language and Environment for Statistical Computing. Vienna, Austria, 2020. Available in: <Available in: https://www.R-project.org/ Access in: March 31, 2020.
» https://www.R-project.org/ - TAMHANE, A. C.; GOU, J. Advances in p-values based multiple test procedures. Journal of Biopharmaceutical Statistics, 28(1):10-27, 2017.
- WESTFALL, P. H.; TOBIAS, R. D.; WOLFINGER, R. D. Multiple Comparisons and Multiple Tests Using SAS. 2nd. ed. North Carolina: SAS Publishing, 2011
Publication Dates
-
Publication in this collection
16 Nov 2020 -
Date of issue
2020
History
-
Received
31 Mar 2020 -
Accepted
21 Sept 2020